


Impact Statement
Our experimental study devised a novel surface-morphing strategy that adaptively adjusts surface topography in response to flow velocity, significantly reducing drag on a sphere. We systematically explored the effect of dimple depth ratio across a Reynolds number range and identified an optimal dimple depth for each Reynolds number. As dimple depth increases, drag decreases until reaching a critical point, after which drag rises due to upstream flow separation. This demonstrates that precise control of dimple depth can regulate flow separation over bluff bodies. We developed a predictive model linking optimal dimple depth to Reynolds number, which was successfully implemented for real-time drag reduction of up to 50 %. The dimples autonomously adjust to varying flow velocities to maintain minimal drag. These findings offer a transformative solution for adaptive flow control, with significant potential to enhance the efficiency and maneuverability of unmanned underwater and aerial vehicles across broad engineering applications.
1. Introduction
Bluff bodies experience large drag due to flow separation as a consequence of steep adverse pressure gradient. This can significantly affect the structural stability and aerodynamic/hydrodynamic performance of the body. One of the widely studied bluff bodies is a sphere, which represents one of the most fundamental and symmetric three-dimensional prototypes. A hallmark study which uncovered the flow physics around a sphere was conducted by Achenbach (Reference Achenbach1972), where a sphere was tested over a Reynolds number range of 5 × 10⁴ ≤ Re ≤ 6 × 10⁶. A sudden decrease in the drag coefficient was observed at a critical Reynolds number of 3.7 × 10⁵. At critical Reynolds number, the boundary layer over the sphere surface transitions from laminar to turbulent delaying the flow separation leading to significant drag reduction, also known as the drag crisis. In the post-critical regime, the flow separation location starts moving upstream that leads to an increase in drag (Achenbach Reference Achenbach1972, Reference Achenbach1974b).
Several studies have investigated passive strategies for reducing drag on a sphere using surface modifications. These modifications enhance near-wall flow momentum, transitioning the boundary layer from laminar to turbulent, which delays flow separation and reduces drag (Bearman & Harvey Reference Bearman and Harvey1976; Maxworthy Reference Maxworthy1969; Choi et al. Reference Choi, Jeon and Kim2008, Reference Choi, Jeon and Choi2006; Sareen et al. Reference Sareen, Hourigan and Thompson2024a). Surface modification by dimples is one of the passive methods able to delay flow separation on a sphere (Smits & Ogg Reference Smits and Ogg2004). A systematic analysis of the drag performance on a dimpled sphere was first performed by Davies (Reference Davies1949) who studied the dynamics of a spinning golf ball, finding that adding dimples increased the flying distance of the ball. Bearman & Harvey (Reference Bearman and Harvey1976) reported that the addition of dimples reduced the critical Re number when compared with a smooth counterpart, and performed a first analysis on the optimal shape of the elements, concluding that hexagonal dimples developed slightly lower drag than circular elements. The mechanisms behind the performance improvements were noted as the effectiveness of dimples in tripping the boundary layers and delaying the flow separation over the sphere surface.
Choi et al. (Reference Choi, Jeon and Choi2006) reported that the velocity fluctuations increase along the separating shear layer producing vortical structures and high momentum near the wall which overcomes the adverse pressure gradient and hence delays the flow separation. A direct numerical simulation (DNS) study conducted by Beratlis et al. (Reference Beratlis, Balaras and Squires2019) found that the mean turbulent kinetic energy starts to increase at a position of 51∘ due to dimples, leading to modifications in the velocity profiles and overcoming the effect of adverse pressure gradient. Nevertheless, the authors reported that, in the post-critical regime, dimples would decrease the mean skin friction coefficient and incur a local pressure penalty which increased the total drag force by approximately 50 %.
While there have been several studies investigating the flow over a dimpled sphere, there is a lack of systematic study investigating the effect of dimple depth ratios for a wide range of Reynolds number. Previous research by Choi et al. (Reference Choi, Jeon and Choi2006) and Bearman & Harvey (Reference Bearman and Harvey1976) only studied one dimple depth corresponding to professional golf sport. A preliminary study by Aoki et al. (Reference Aoki, Muto and Okanaga2012) studied only three dimple depths (lower than the minimum dimple depth ratio investigated in this study) and lacked any particle image velocimetry measurements investigating the near-wake behaviour. Furthermore, although the drag reduction capabilities of dimples on the surface of a sphere are well known, prior preliminary studies have suggested that these benefits are strongly correlated with the Reynolds number. To overcome this limitation, an active surface morphing strategy is needed to actively change the dimple depth on-demand or adaptively with changing flow condition to minimise drag across a wide range of Reynolds numbers.
Terwagne et al. (Reference Terwagne, Brojan and Reis2014) used wrinkling instabilities in thin stiff films on curved, compliant substrates, activated through pneumatic actuation, to generate intricate hierarchical surface patterns such as labyrinthine structures and hexagonal dimples. Their study revealed that increasing the roughness parameter of hexagonal dimple-like patterns shifts the drag crisis to lower Reynolds numbers. Previous research on surface morphing techniques has similarly demonstrated that the roughness parameter (or dimple depth ratio, in the case of dimples) plays a crucial role in controlling flow over bluff bodies. While Terwagne et al. (Reference Terwagne, Brojan and Reis2014) proposed a pneumatically actuated surface morphing technique, their approach is relatively complex, relying on the sophisticated wrinkling instability of thin stiff films on curved compliant substrates. This mechanism generates various intricate hierarchical surface patterns, such as labyrinths and hexagonal dimples. However, most of these patterns lack demonstrated hydrodynamic benefits, with the exception of hexagonal dimple-like structures. In contrast, our study significantly simplifies the surface morphing technique and generates only dimples, which have a well-established effect on reducing drag on a sphere. This simple and easy to design and implement surface morphing technique enables a straightforward and adaptive method for flow control over a sphere.
Using this morphable approach, we first systematically investigate the impact of fixed dimple depth ratio (k/d) on aerodynamic drag and flow characteristics of a sphere for a wide range of Reynolds numbers. The dimple coverage ratio is maintained at the optimal value, consistent with Choi et al. (Reference Choi, Jeon and Choi2006) and dynamically similar to a real golf ball (Titleist DT-Distance) without rotation. We then use the comprehensive experimental data to develop a predictive model relating optimal dimple depth ratio k/d and Reynolds number Re. We then implement the predictive model to demonstrate the closed-loop control approach, whereby the dimple depth changes in real-time as the flow velocity is changed.
The present paper is organised as follows. Section 2 describes the experimental methodology comprising experimental set-up and development of the morphable sphere. Section 3 discusses the main findings of the experiment, while § 4 summarises all the main findings of the present study and draws conclusions.
2. Experimental methods
The experiments were conducted in an open-loop wind tunnel at the Department of Aerospace Engineering at the University of Michigan, Ann Arbor, with a test section of 0.6 m width, 0.6 m depth and 3 m length. The wind tunnel was capable of producing steady flow speeds of 5 ≤ U[m s−1] ≤ 22. The free stream turbulence intensity levels were within T i = 1.8 % for the range of flow speeds tested. Although this value is relatively high compared with other studies, previous work has shown that T i < 2 % have a limited impact on the drag production of a sphere in the subcritical Re range (Achenbach (Reference Achenbach1974a)).
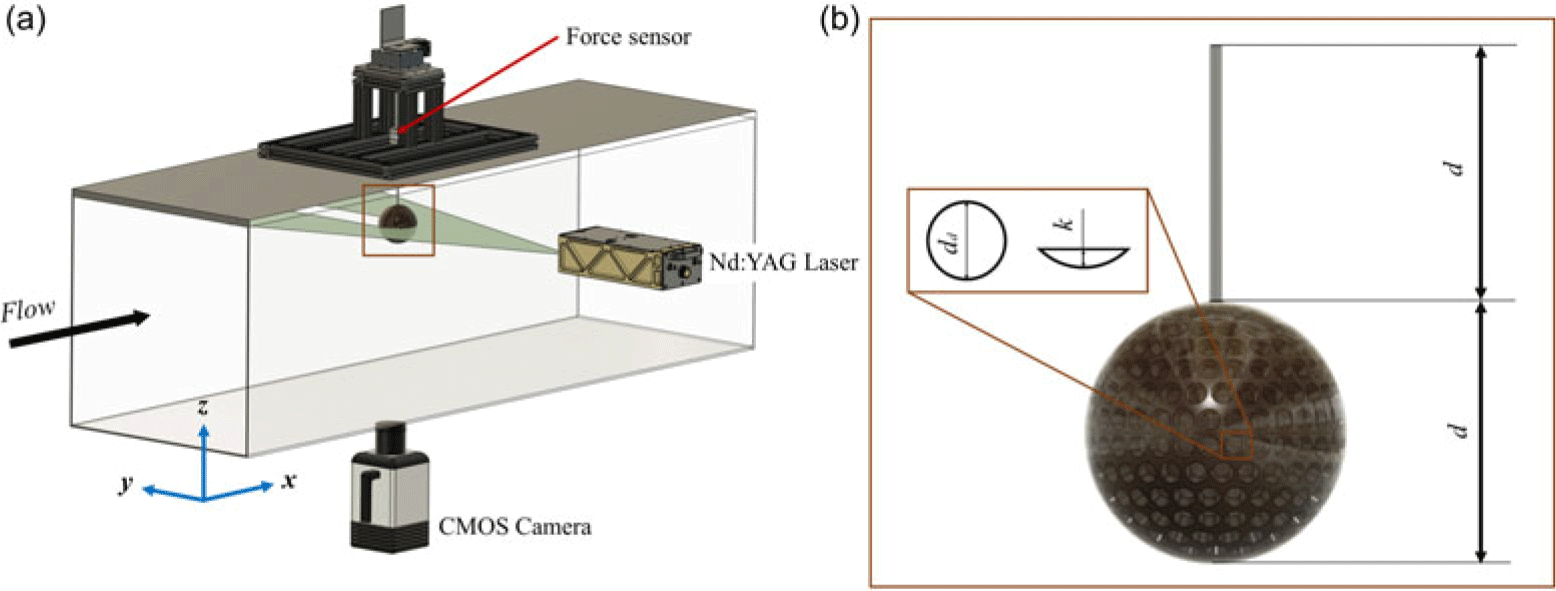
A brief schematic of the experimental set-up is shown in figure 1. The sphere is mounted from the top of the test section with a holding structure containing a load cell. The sphere is supported with a cylindrical support rod of diameter 5 mm, which is 20 times smaller than the sphere diameter. Sareen et al. (Reference Sareen, Zhao, Sheridan, Hourigan and Thompson2018) conducted systematic experiments to investigate the impact of a support rod on the flow around a sphere. Their findings indicated that a diameter ratio (sphere diameter/rod diameter) of ≥20 results in negligible effects of the support rod on the wake and forces acting on the sphere within the subcritical Reynolds number range. Additionally, the length of the support rod was set to one sphere diameter to minimise wall effects while maintaining structural integrity, in line with previous studies (Sareen et al. Reference Sareen, Zhao, Sheridan, Hourigan and Thompson2018, Reference Sareen, Hourigan and Thompson2024b). The blockage ratio, defined as the diameter of the sphere against the width of the test section (d/W = 0.16), is small enough to neglect the blockage effect on the flow field (Achenbach Reference Achenbach1974a).
(a) A brief schematic (not to scale) of the experimental set-up. (b) Schematic of the dimpled sphere model. Here, dd is the dimple diameter, k is the dimple depth and d is the sphere diameter.
The spheres considered in this study are constructed using a stereolithography (SLA) resin three-dimensional (3-D) printer (Form 3, FormLabs) with a resolution of 25 µm. The morphology of the dimples are defined by two aspects: the dimple diameter (d
d
) and the dimple depth (k). In line with Choi et al. (Reference Choi, Jeon and Choi2006), the ratio between the diameter of the dimple and sphere is kept constant at d
d
/d = 0.087, while the normalised dimple depth (k/d) is varied from 0 (smooth configuration) to 0.02 in small increments. Two types of models are considered in this study: a sphere with rigid dimples and a morphable sphere with active dimples. The former is built with similar non-dimensional parameters as Choi et al. (Reference Choi, Jeon and Choi2006) for validation purposes (d = 0.08 m, d
d
/d = 0.087, k/d = 0.004 and 384 dimples uniformly distributed over the sphere surface (N
d
)). The sphere with morphing capabilities (d = 0.1 m, d
d
/d = 0.087, k/d = 0 − 0.02 and 296 dimples across the surface (N
d
)) is built that can actively change its dimple depth on-demand. In the morphable sphere, the total number of dimples N
d
is reduced compared with the study by Choi et al. (Reference Choi, Jeon and Choi2006) to ensure structural integrity, leading to a coverage ratio (area of dimples against total surface area of the sphere) of $\varPhi$
= 55.6 %.
$\varPhi$
= 55.6 %.
(a) A schematic of the morphable sphere’s pneumatic actuation system, which can actuate precise dimple depth on demand. (b) An image of the morphable sphere shifting from a smooth (left) to a dimpled configuration with increasing dimple depth as depressurisation levels in the core are increased using the pneumatic actuation system.
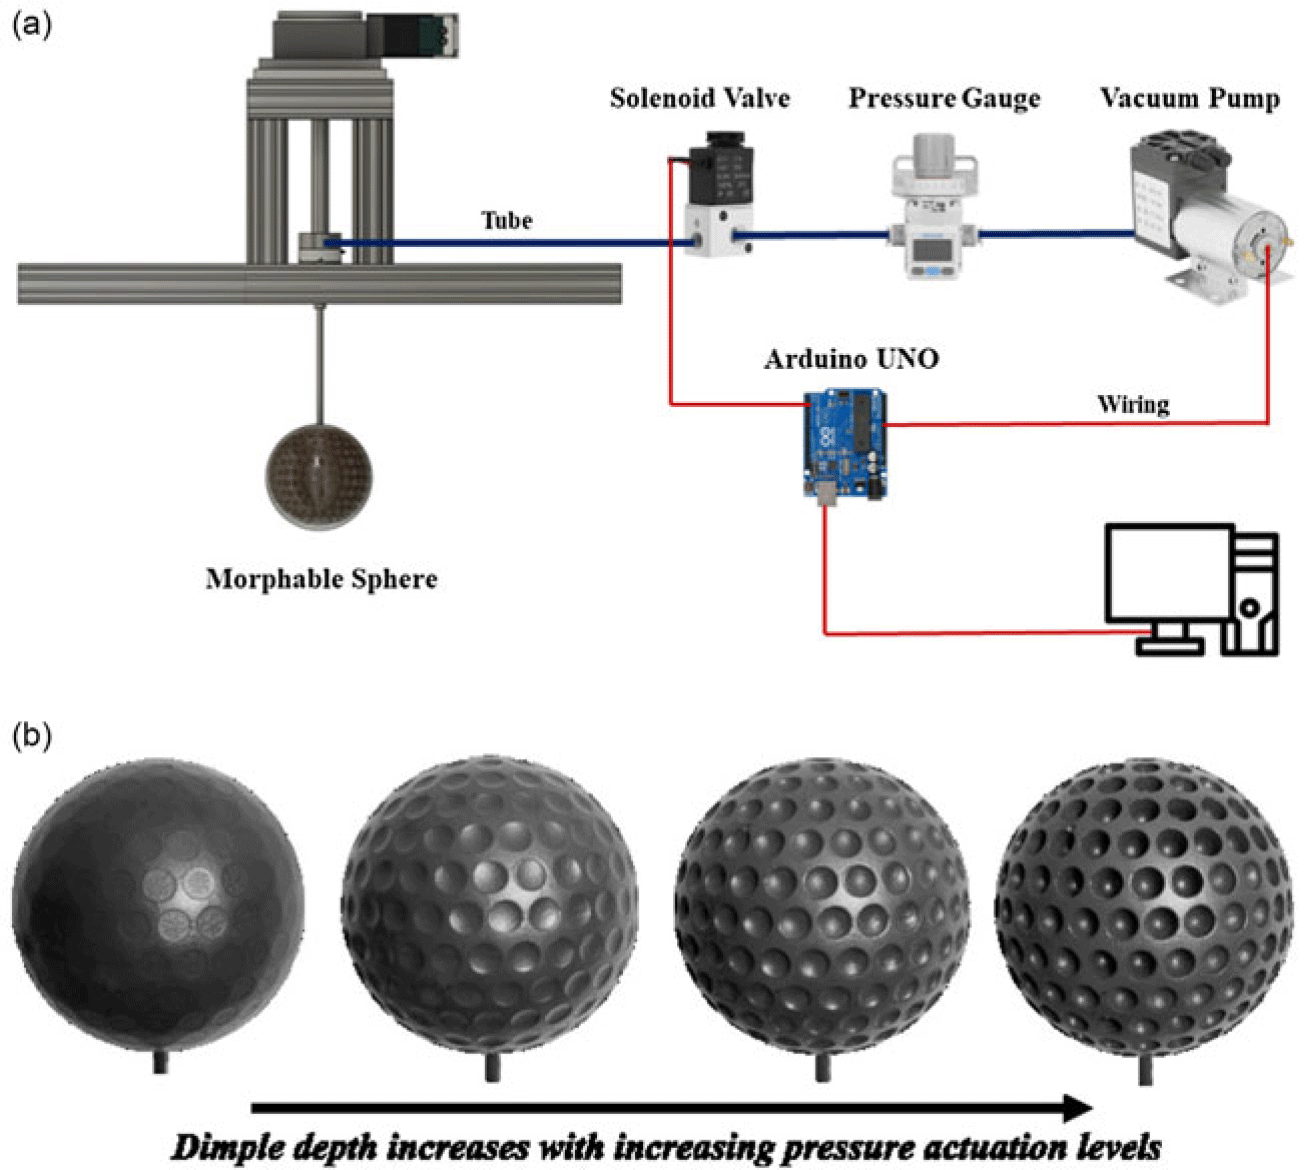
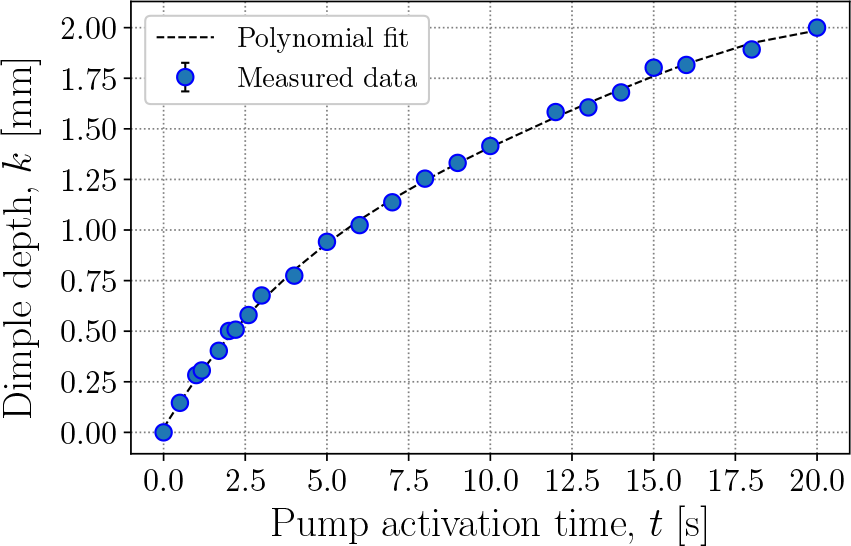
The method for actuating dimples on the sphere’s surface is outlined in figure 2. The morphable sphere consists of a 3-D-printed rigid inner skeleton with circular holes uniformly distributed over its surface. The inner skeleton is covered by a pre-stretched thin latex membrane of thickness 0.276 ± 0.001 mm and shear modulus of 340 ± 12 kPa, as depicted in figure 2(a). Pre-stretching ensured that no fluttering of the latex membrane occurred during the testing. Dimples are actuated by depressurising the sphere’s core using a vacuum pump (Kamoer KLVP6) with a maximum pressure of − 85 kPa, controlled by an Arduino UNO. The dimple depth can be precisely controlled with a resolution of 0.01 mm by varying the pump’s activation time, illustrated in figure 2(b). Once the desired depth is attained, an Arduino-controlled solenoid valve seals the vacuum at the core of the sphere, maintaining the desired dimple depth. To establish the relationship between pump activation time and dimple depth ratio (k/d), the surface deformations are measured using a 3-D scanner with a 5 µm resolution. Dimple depth is recorded for various pump activation times, repeating the process three times for each dimple depth. Subsequently, as shown in figure 3, a polynomial fit is applied to the data points, yielding a control model to determine the necessary depressurisation characteristics for achieving the desired k/d. It is important to note here that the maximum pressure due to the flow at the highest Reynolds number tested was only approximately 0.3 kPa, which is an order of magnitude smaller than the vacuum pressure levels required to actuate the dimples. Thus, any surface deformation over the sphere surface due to the flow can be neglected.
Calibration chart showing the variation of dimple depth k [mm] as a function of the pump activation time [s]. The error bars represents the uncertainty in the measurements and are mostly contained inside the markers.
The forces acting on the spheres were measured with a six-axis force sensor (ATI mini40 IP65), with a resolution of 0.01 N in the streamwise and spanwise force directions. The frequency response range of the ATI mini40 force sensor is up to 1.4 kHz, as per the technical documentation of the sensor. The forces were acquired at a sampling frequency of 1 kHz, for a duration of 1 minute, with each data point repeated at least three times. The non-dimensional time, defined as t * = tU ∞/d, varied from 5300 to 11 500 across the Re range considered. Additionally, all data samples collected at different Re values were independent of each other. After each data point acquisition, the wind tunnel is stopped. Then, after letting the flow come to full rest, we zero the load cell, input the required new velocity and acquire a new data point, ensuring independence between samples. The reported streamwise force (drag) is defined as
 \begin{align} C_D=\frac {2 F_D}{\rho U_\infty ^2 A}, \end{align}
where F D represents the drag force in N, ρ is the fluid density, U ∞ denotes the free stream flow velocity and A is the projected area of the sphere, calculated as A = πd 2/4. The data acquisition and analysis was performed using Matlab and Python. We measured the force on the isolated support rod after removing the sphere and adjusting the end condition with an end plate, resulting in a drag coefficient of C D = 1.2, which aligns well with previous studies (Schlichting & Gersten Reference Schlichting and Gersten2016). The drag of an isolated support rod was then subtracted from the total drag measured by the sensor to provide a precise estimate of the drag of an isolated sphere. The propagation of uncertainties in the measurements δC D has been calculated following the procedure stated by Taylor & Thompson (Reference Taylor and Thompson1982):
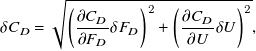 \begin{align} \delta C_D=\sqrt {\left (\frac {\partial C_D}{\partial F_D} \delta F_D \right )^2 + \left (\frac {\partial C_D}{\partial U} \delta U \right )^2}, \end{align}
where δF
D
and δU correspond to the uncertainty in the force and velocity readings. The values obtained with the previous equation are later combined with the random error ( $\sigma _{\overline {C}_D} = \sigma /\sqrt {N}$
), where N is the number of repetitions and
$\sigma _{\overline {C}_D} = \sigma /\sqrt {N}$
), where N is the number of repetitions and $\sigma _{\overline {C}_D}$
is the standard deviation of the drag coefficient, as follows:
$\sigma _{\overline {C}_D}$
is the standard deviation of the drag coefficient, as follows:
 \begin{align} \mathcal {U}_{C_D} = \sqrt {\left ( \sigma _{\overline {C}_D}\right )^2 + \left (\delta C_D \right )^2}. \end{align}
The random uncertainty of the mean varied from 0.8 % at Re = 60 000 to 0.2 % at Re = 130 000. The flow velocity fields were captured using 2-D-2C particle image velocimetry (PIV). The laser plane is aligned along the streamwise direction (XY plane), passing through the centre of the sphere. The flow was seeded with polydisperse aerosol by atomising di-ethyl-hexyl-sebacat (DEHS) solution into particles using a LaVision Aerosol Generator. DEHS particles have a mean size of 1 µm and a density of 0.91 g cm−3. The particles were illuminated with an Evergreen 200 dual-pulsed laser with a pulse energy of 200 mJ and frame rate of 15 Hz. The PIV images were captured with a LaVision Imager CX-5 camera with a resolution of 2440 × 2040 pixels. The camera was equipped with a 60 mm Nikon lens to give a field of view of 113 × 95 mm. DaVis 11 software was used to cross-correlate the acquired particle image pairs. The particle displacement between images in a pair was 10 pixels. The flow fields were calculated with an interrogation window size of 64 × 64 pixels with a total of 4 passes and a 75 % overlap, providing a spatial resolution of 0.03d. The images were captured for 60 s at a rate of 15 Hz, totalling 900 image pairs. The data are time-averaged over t * = tU ∞/d ≈ 8100 for Re = 90 000, corresponding to at least 1000 vortex shedding cycles.
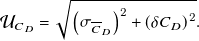
The matrix of characteristic parameters followed in this study are presented in table 1. Experiments were conducted for a Reynolds number varying in the range of Re = DU
∞/ν = 60 000 − 130 000, where U
∞ is the free stream velocity, ν is the kinematic viscosity and d is the sphere diameter. Two types of spheres are considered in this study. The first one consists of a sphere with rigid dimples for validation purposes (d = 0.08 m). The second one consists of a morphable sphere of diameter d = 0.1 m. The normalised diameter of the dimple (d
d
/d) and the area coverage ratio $\varPhi$
= 55.6 % is kept constant across all the cases considered. The normalised dimple depth (k/d) is varied in fine resolutions from 0 (smooth configuration) to 0.02 (dimple depth = 2 mm).
$\varPhi$
= 55.6 % is kept constant across all the cases considered. The normalised dimple depth (k/d) is varied in fine resolutions from 0 (smooth configuration) to 0.02 (dimple depth = 2 mm).
Table showing matrix of characteristic parameters followed in the present study. Here, U ∞ is the free stream velocity, d is sphere diameter, ν is kinematic viscosity of air, k is the dimple depth, d d is the dimple diameter and N d is the total number of dimples
3. Results and discussion
This section discusses the results obtained in this experimental study. First, we start by validating the experimental set-up and the morphing strategy with previous studies using spheres with rigid dimples. Next, we investigate the effect of systematically varying the dimple depth ratio or roughness parameter (k/d) using the morphing strategy, and compare the evolution of drag coefficient (C D ) across a range of Reynolds number (Re) values. Finally, we discuss the forces results and correlate them with PIV measurements.
3.1. Validation
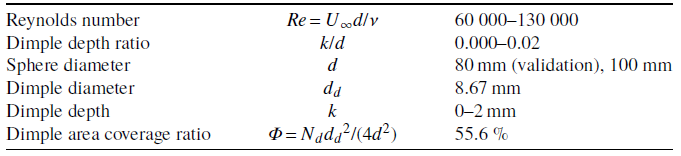
For the validation, we compare the drag force on a smooth and rigid dimpled sphere with prior benchmark studies. Figure 4 depicts the evolution of C D for various Re values, comparing a smooth sphere (k/d = 0.000) with a sphere featuring fixed dimples at k/d = 0.004. Our findings are juxtaposed with previous studies with similar characteristics (Achenbach Reference Achenbach1972; Choi et al. Reference Choi, Jeon and Choi2006). For the smooth configuration, we observe a constant C D ≈ 0.5 for Re < 100 000, aligning with prior seminal research work of Achenbach (Reference Achenbach1972). Introducing dimples triggers laminar to turbulent boundary layer transition leading to delay in the flow separation over the sphere surface (Choi et al. Reference Choi, Jeon and Choi2006). This leads to an earlier onset of drag crisis with a notable reduction in C D for Re values after the drag crisis. This effect is evident in the drag characteristics of the sphere with fixed k/d = 0.004 dimples. Consistent with Choi et al. (Reference Choi, Jeon and Choi2006), we observe a C D crisis starting at Re = 70 000, and reaching a minimum C D of 0.23 at Re = 100 000. While our minimum C D value is slightly higher than that reported by Choi et al. (Reference Choi, Jeon and Choi2006), our results exhibit a comparable trend.
C D against Re evolution of rigid and morphable sphere compared with previous studies (Achenbach Reference Achenbach1972; Choi et al. Reference Choi, Jeon and Choi2006).
To ensure that the morphing strategy can generate and maintain a fixed dimple depth that compares well with its rigid counterpart for the Reynolds numbers tested in the study, we also compare the drag force on a dimpled sphere with rigid dimples to a dimpled sphere actuated using the morphable approach. In figure 4, we compare the C D values between a sphere with rigid dimples and fixed dimples obtained via the morphable approach at k/d = 0.004. We find good agreement, particularly at Re < 100 000, both in overall drag values and in the trend of the drag crisis. However, at higher Re, the morphable sphere exhibits a slightly higher C D , possibly attributed to differences in the number of dimples present on the surface, since the area coverage ratio, or the total area of the surface covered by rough elements, has been previously noted to influence the sphere’s C D performance (Aoki et al. Reference Aoki, Ohike, Yamaguchi and Nakayama2003). Nonetheless, the similarities in the drag crisis trend validate the morphing approach, confirming the morphing system’s ability to achieve the expected k/d with high precision.
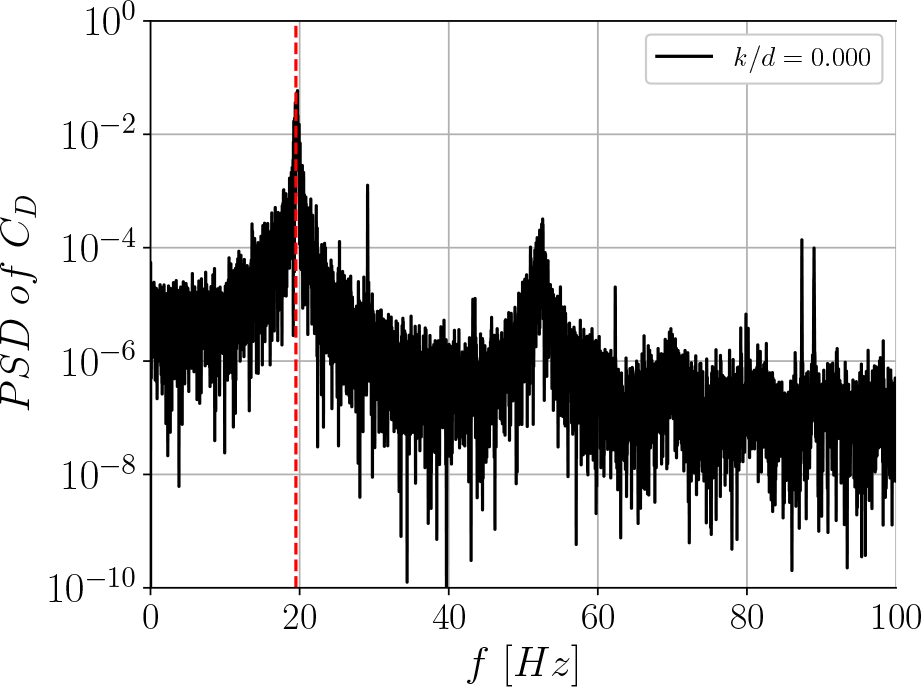
Figure 5 shows a power spectra density (PSD) on the raw C D signals for the morphable sphere with smooth configuration at Re = 60 000. As evident from the figure, there is a characteristic peak corresponding to the vortex shedding frequency, highlighted by a red dashed line located at approximately 19 Hz, leading to a Strouhal number (St = fd/U ∞), where d is the sphere diameter and f is the vortex shedding frequency, of St = 0.21, in line with previous studies (Achenbach Reference Achenbach1974a).
In summary, the results discussed in this section provide validation for the current experimental set-up and the morphing strategy. In the following, we discuss the effect of the roughness parameter or the dimple depth ratio on the drag of a sphere for the Reynolds number range Re = 60 000 − 130 000. We will then correlate them with the PIV results. Finally, we will employ the experimental results to develop a model that relates optimal k/d and Re to minimise drag across the entire range of Reynolds numbers tested in the study. This control model will then be used to demonstrate the adaptive morphing capabilities developed in the current study.
PSD analysis of the morphable sphere under smooth configuration at Re = 60 000. The dashed red line denotes the dominant frequency in the drag force signal.
3.2. Drag of a morphing sphere for varying k/d and Re
Figure 6 presents the evolution of the drag coefficient (C D ) against the Reynolds number (Re) for dimple depth ratios (k/d) varying from 0 (corresponding to a smooth configuration) to k/d = 0.02. Overall, two discernible trends emerge with increasing k/d, as shown separately in figures 6(a) and 6(b). In Regime I, as illustrated in figure 6(a), as k/d increases in the range of 0.002 ≤ k/d ≤ 0.006, the critical Reynolds number Re c decreases. The critical Reynolds number at which the drag rapidly drops reduces with increasing k/d, reaching values of Re = 70 000 for k/d = 0.006. This behaviour has also been reported previously for other surface modifications, such as roughness and surface trips (Choi et al. Reference Choi, Jeon and Choi2006; Chae et al. Reference Chae, Lee, Kim and Lee2019).
(a) C D against Re evolution for all the k/d considered in this study. (b) Results in an auxiliary 3-D view. Blue colours indicate shallower dimples and red colours note deeper dimples.
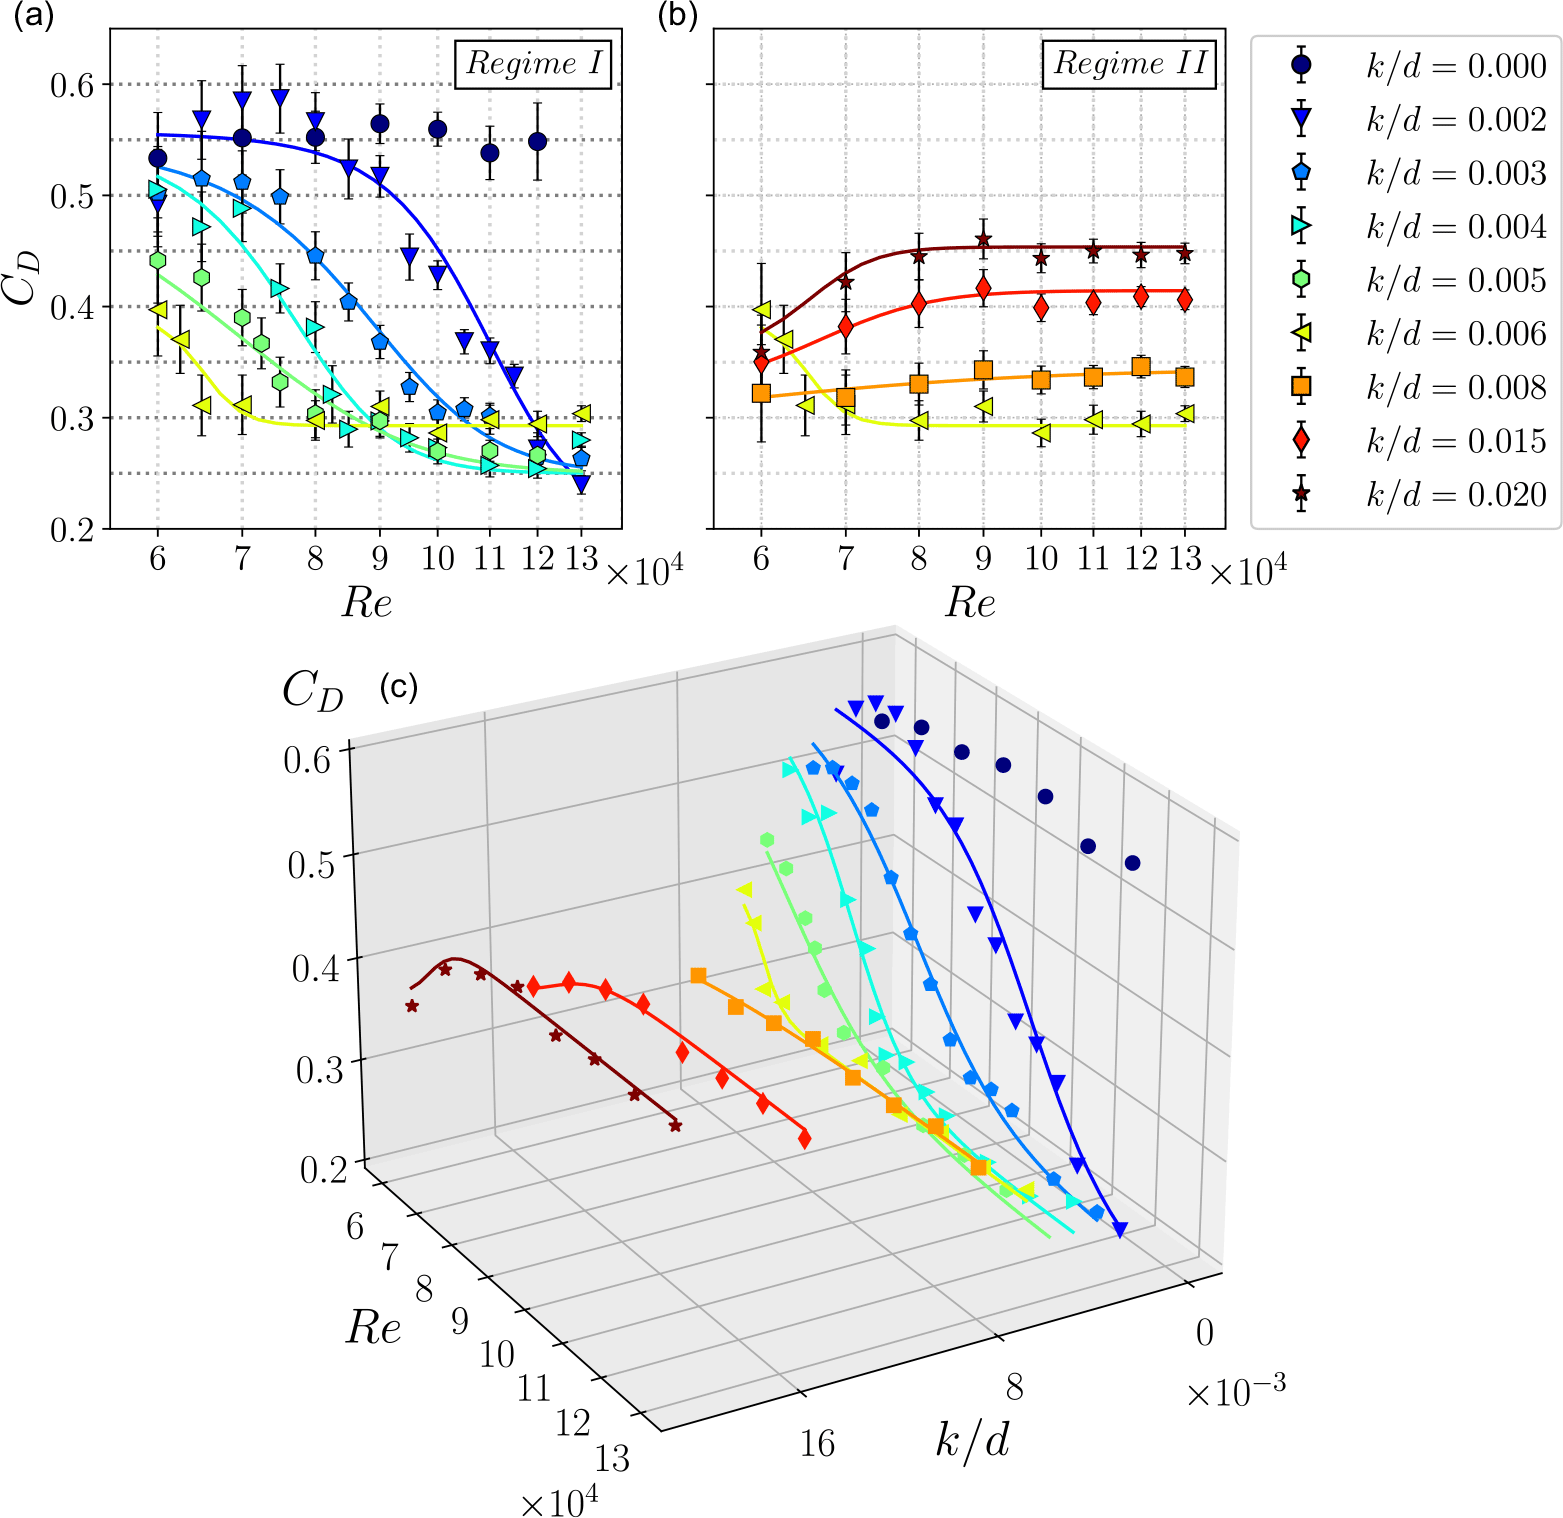
Following the attainment of lowest C D , further increase in Re at constant k/d appears to exert limited influence, as the evolution of C D stabilises across all the dimple depth ratios studied, which is presumably due to constant flow separation angle on the sphere surface in the post-critical Re range, as also reported by Choi et al. (Reference Choi, Jeon and Choi2006). It is also noticeable how the minimum C D that can be achieved with the addition of dimples decreases as k/d is increased in this regime. The sphere with shallowest surface modifications, k/d = 0.002, leads to a minimum drag of C D = 0.25 at Re = 130 000, resulting in 50 % drag reduction when compared with its smooth counterpart.
As evident from figure 6(a), there is no one optimal k/d that minimises drag for the entire range of Reynolds numbers tested. For lower Reynolds number, deeper dimples are more effective in reducing drag, however, as Re is increased, shallower dimple depth are required to minimise the drag. Thus, if our goal is to minimise drag for the entire range of Reynolds numbers, we need a strategy whereby we can adapt dimple depth with the flow condition. By doing so, it will be possible to reduce the C D of a sphere by at least 40 % across a Re range spanning from 60 000 to 130 000.
In Regime II, shown in figure 6(b), when k/d is further increased from 0.006 < k/d ≤ 0.02, a reversal in this trend is observed, whereby the drag starts increasing. While for k/d = 0.006, the minimum C D of 0.3 is observed at Re = 65 000, higher k/d preclude the drag crisis within the range of Re considered. Overall, we observe that C D reductions decrease as k/d is augmented more than k/d = 0.006, with the trend in drag against Re shifting up, back towards that of a smooth sphere. The deepest dimple depth analysed in this study, k/d = 0.02 reports C D values around 0.46, which constitutes a mere 9 % drag reduction when compared with the smooth configuration. We also note that the effects described at figure 6(b) highlight the importance of controlling k/d under specific flow conditions, as adjustments in this parameter can swiftly negate any potential performance advantages.
(a) C D against k/d evolution at Re = 90 000 and Re = 120 000. (b) Root-mean-square of the instantaneous C D at Re = 90 000 and Re = 120 000.
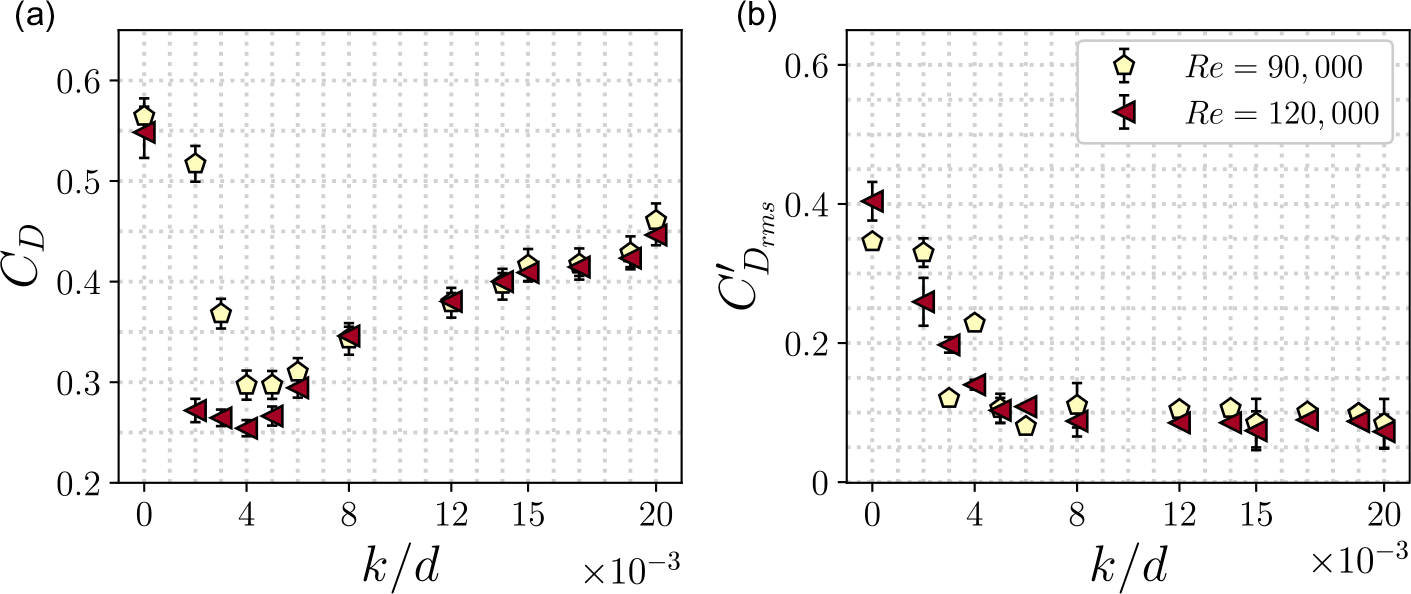
The effects explained in figure 6 can be further highlighted by analysing the C D evolution against k/d at fixed Re number, as shown in figure 7(a). Here, we report the drag of the morphable sphere with varying k/d at Re = 90 000 and Re = 120 000. As k/d increases from 0 to 0.005, the drag rapidly drops reaching maximum reduction of up to almost 50 %. A further increase in k/d beyond this optimal value leads to a rapid increase in drag eventually approaching that of a smooth sphere. This effect can be seen for both Re. This corroborates that there is an optimal k/d for each Reynolds number that maximises the drag reduction. Previous research (and our own observations discussed in the wake measurement section) has established that the drag crisis of a dimpled sphere occurs when the boundary layer transitions from laminar to turbulent. This transition delays the flow separation, thereby reducing drag. However, when the roughness parameter (in this case, the dimple depth ratio) exceeds a critical threshold, drag begins to increase, indicating that the location of flow separation moves upstream. This phenomenon is analogous to the behaviour observed in smooth spheres in the post-critical regime where the drag begins to increase as flow separation location shifts upstream. Our current research demonstrates a similar trend with increasing roughness parameters, representing a novel discovery that suggests the potential for manipulating wake deflection around a sphere solely through roughness.
We also report the root-mean-square (r.m.s.) values of the drag fluctuations in figure 7(b). As evident from the figure, C ′ Drms rapidly drops with increasing k/d reaching almost 50 % lower C ′ Drms compared with that of a smooth sphere. Interestingly, it seems that, after reaching the k/d for minimum C ′ Drms , the values remain stable for both Re at higher k/d although the time-averaged drag coefficient starts increasing. This finding points towards potential capabilities of dimples to not only reduce the drag of a sphere, but also to significantly limit force fluctuations, with r.m.s. values of less than 70 % of those produced by a smooth configuration.
3.3. Near-wake measurements using particle image velocimetry
After describing and analysing the drag reduction capabilities of the morphable sphere actuated with various fixed dimple depths, we aim to further explain the reasons behind any performance augmentation by drawing relations between forces and wake characteristics measured with 2-D-2C PIV. The PIV is performed in an equatorial plane passing through the centre of the sphere. The details of the PIV set-up are given in § 2.
Dimensionless vorticity $\omega^{*}_{Z}$
= ωd/U
∞ flow fields and time-averaged streamlines for several k/d at Re = 90 000.
$\omega^{*}_{Z}$
= ωd/U
∞ flow fields and time-averaged streamlines for several k/d at Re = 90 000.
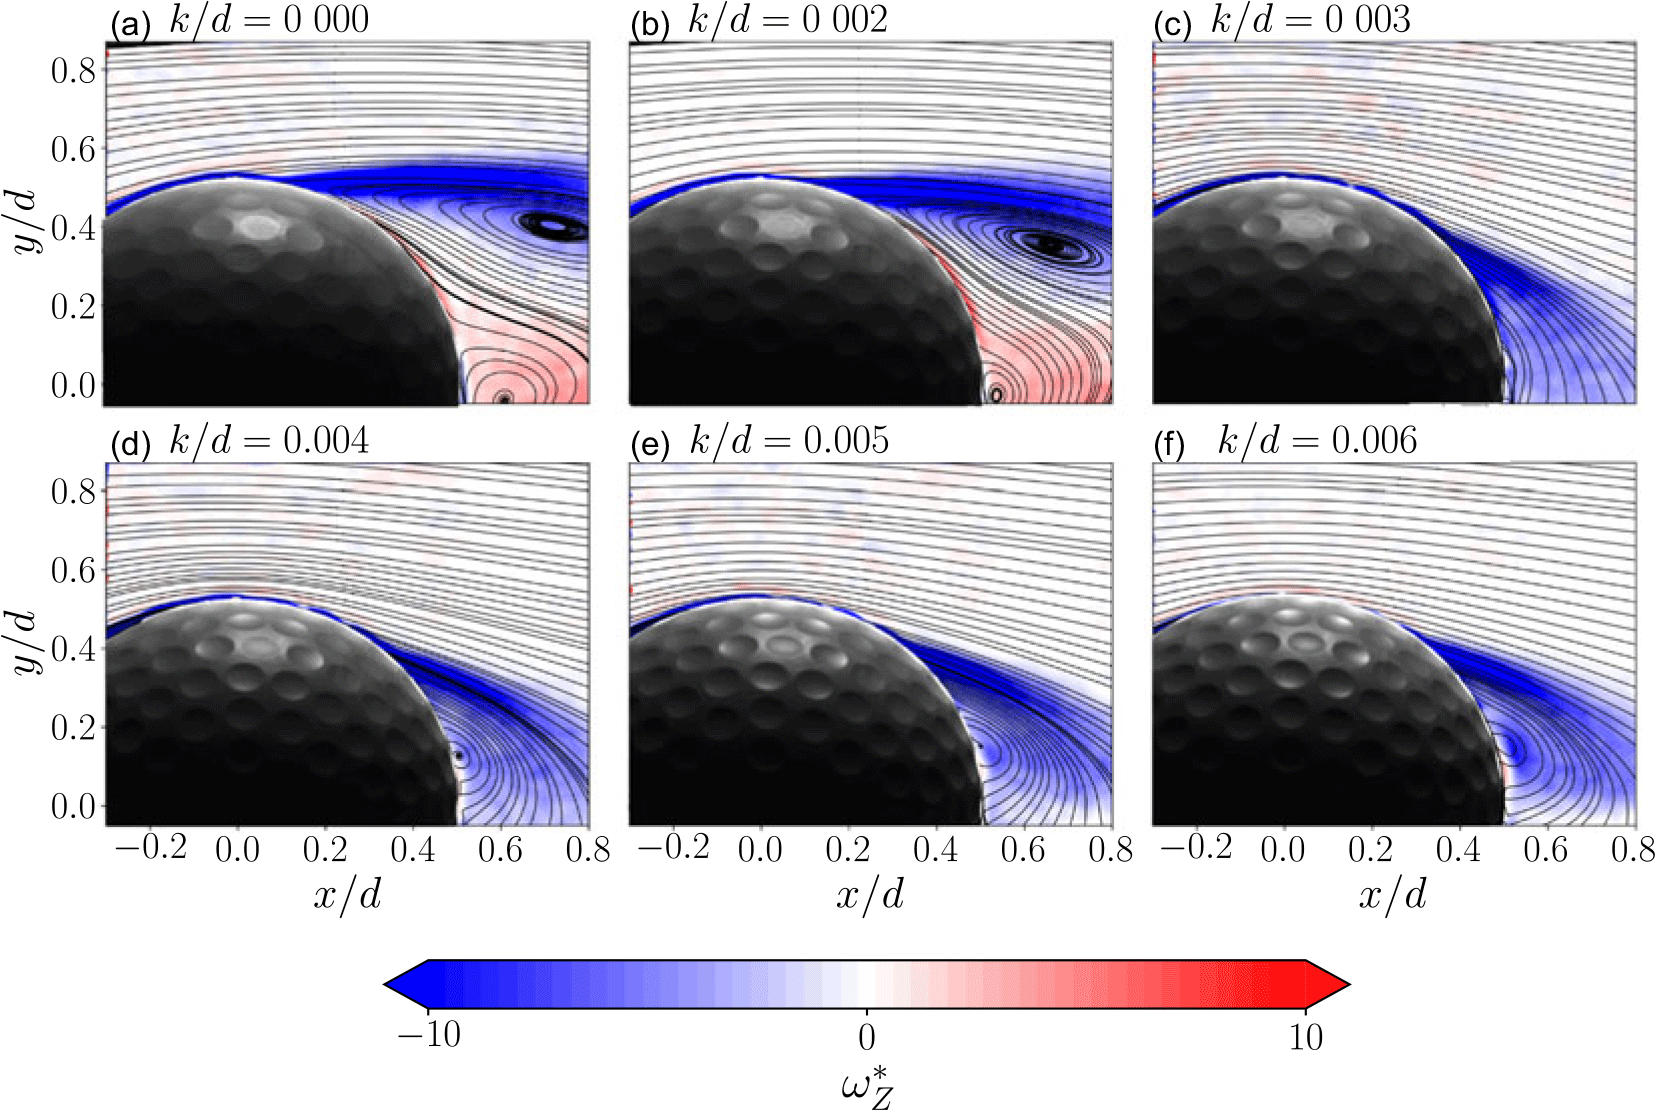
Figure 8 displays the dimensionless vorticity fields calculated as $\omega^{*}_{Z}$
= ωd/U
∞ overlaid with time-averaged streamlines for dimple depth ratios of k/d = 0 − 0.006 at a Reynolds number of Re = 90 000. The correlated drag coefficient and flow separation location is shown in figure 9. As evident from the figure, when thedimple depth ratio increases from k/d = 0 to k/d = 0.002, the near-wake characteristics and the flow separation location remains largely unchanged. This is consistent with the force data shown in figure 6. However, for k/d = 0.003, notable narrowing of the wake region is clearly evident associated with significant delay in the flow separation location. This is correlated with the substantial C
D
reduction ( ≈ 30 %) noted earlier. This is associated with a delay in flow separation location from 110∘ to 140∘, as shown in figure 9.
$\omega^{*}_{Z}$
= ωd/U
∞ overlaid with time-averaged streamlines for dimple depth ratios of k/d = 0 − 0.006 at a Reynolds number of Re = 90 000. The correlated drag coefficient and flow separation location is shown in figure 9. As evident from the figure, when thedimple depth ratio increases from k/d = 0 to k/d = 0.002, the near-wake characteristics and the flow separation location remains largely unchanged. This is consistent with the force data shown in figure 6. However, for k/d = 0.003, notable narrowing of the wake region is clearly evident associated with significant delay in the flow separation location. This is correlated with the substantial C
D
reduction ( ≈ 30 %) noted earlier. This is associated with a delay in flow separation location from 110∘ to 140∘, as shown in figure 9.
Increasing the roughness parameter to k/d = 0.004 − 0.006 results in negligible changes in the wake topology and the flow separation location, with the drag coefficient (C D ) reaching a plateau within this range. However, as noted in figure 8, further increasing the dimple depth ratio to k/d = 0.008 − 0.02 causes the drag coefficient to rise again. This increase in C D in the post-critical regime is linked to an upstream shift in the flow separation location, as reported in the recent study by Sudarsana et al. (Reference Sudarsana, Vilumbrales-Garcia and Sareen2024).
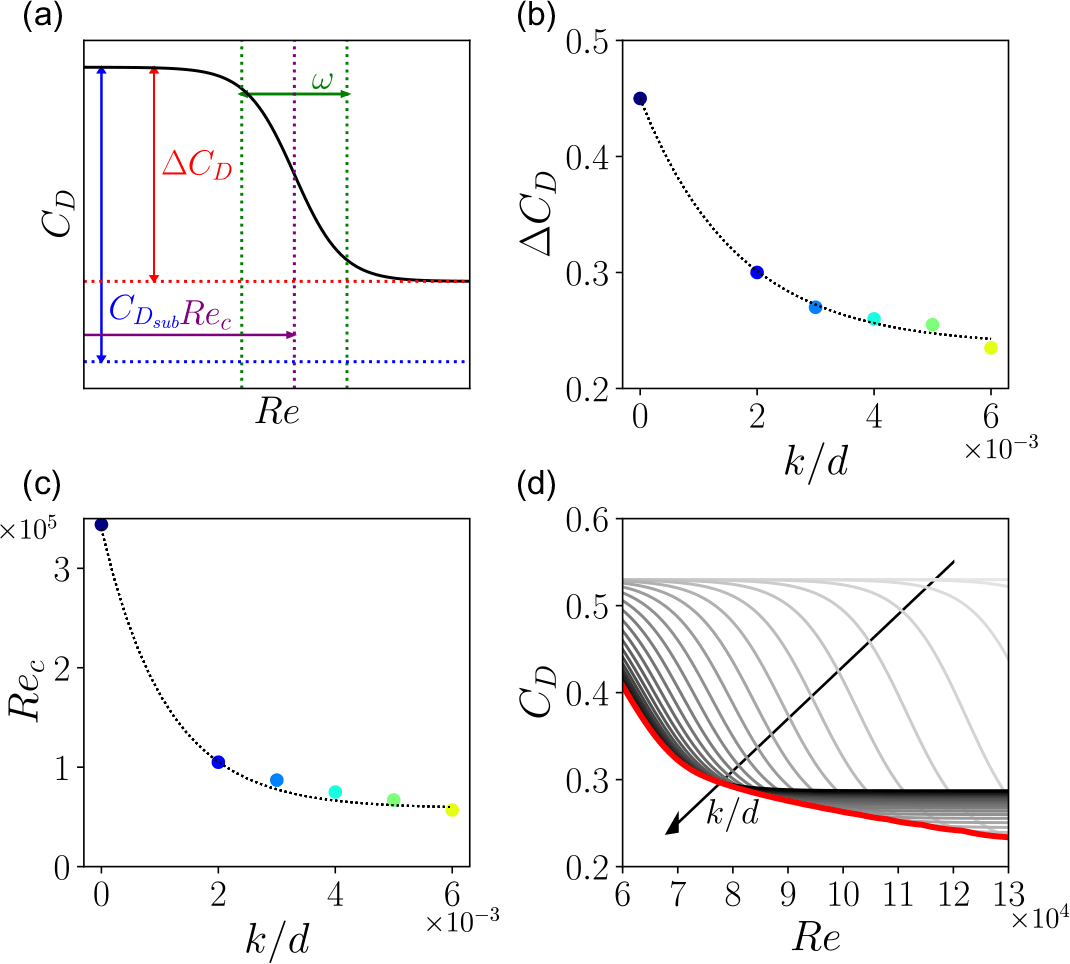
(a) Schematics of the main parameters used to fit the C D versus Re model for different k/d (reproduced from Chae et al. (Reference Chae, Lee, Kim and Lee2019)). (b) ΔC D against k/d, and exponential fit used to obtain the curves in panel (d) with (3.1). (c) Re c against k/d, and exponential fit used to obtain the curves in panel (d) with (3.4). (d) C D against Re estimation for 30 dimple depth ratios in equally spaced increments from k/d = 0 to k/d = 0.006. The red line denotes the optimal curve of minimum C D.
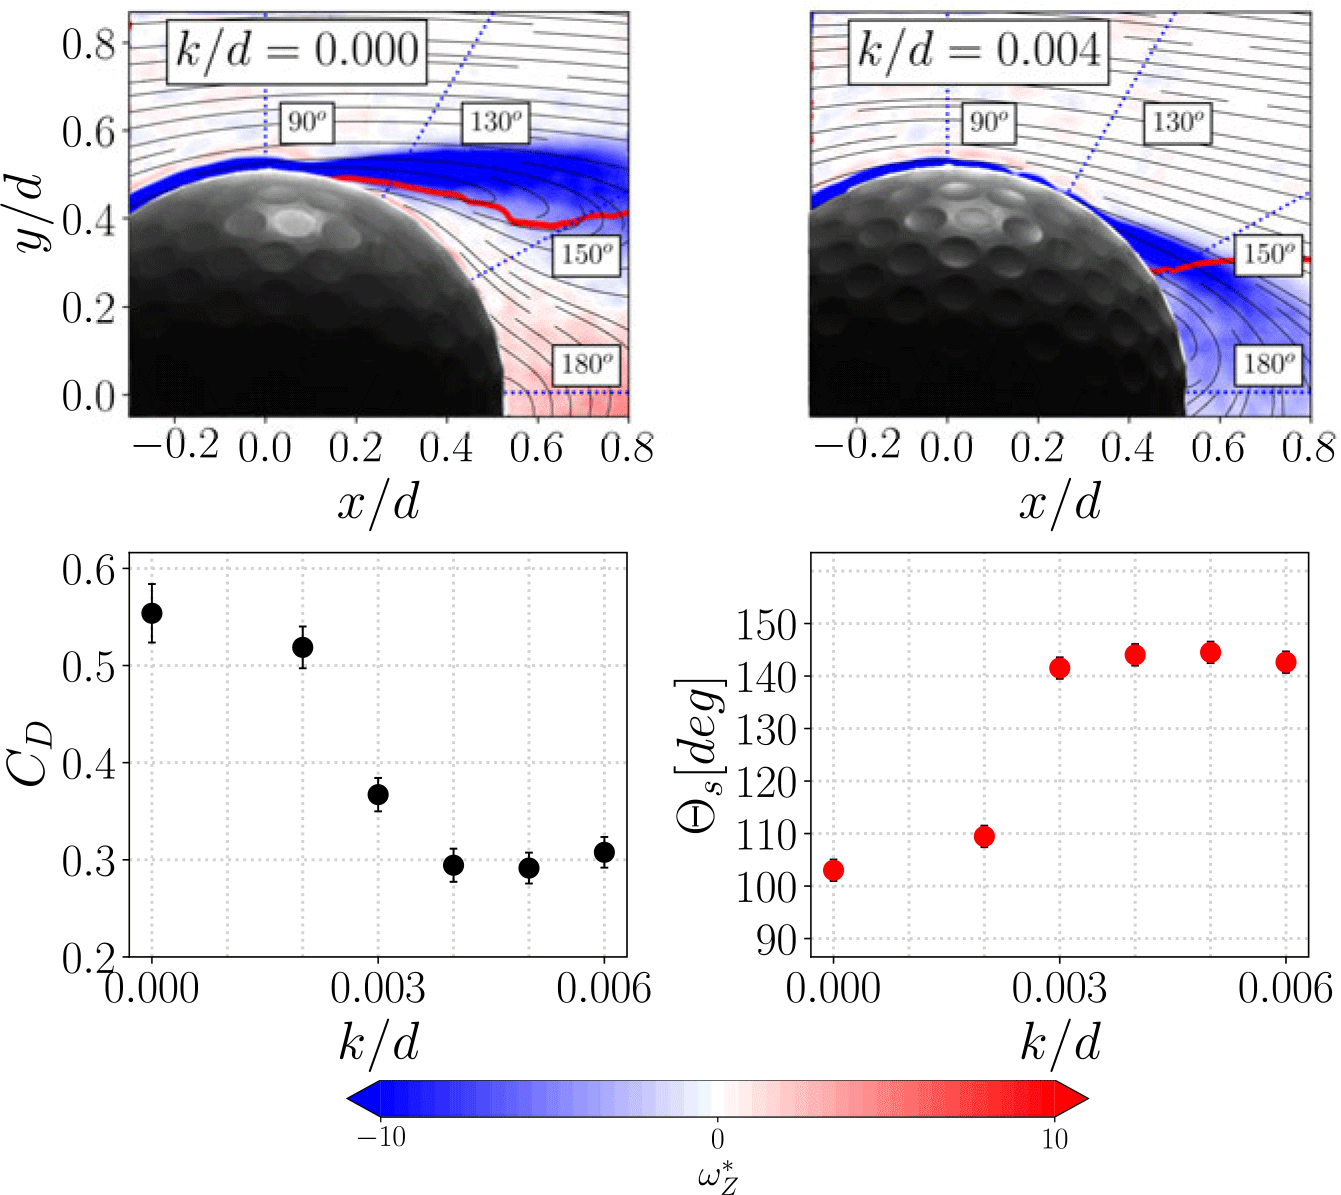
To further examine the wake characteristic for various k/d ratios, we illustrate in figure 10 a comparison between C D and the global flow separation angle θ s (measured from the leading stagnation point) of the flow on the surface of the sphere. We determine θ s by identifying the point on the body’s surface where U θ = 0, referencing it to the stagnation point on the sphere (y/d = 0, x/d = − 0.5) (Moore Reference Moore1958; Kim et al. Reference Kim, Choi, Park and Yoo2014). The uncertainty in θ s is obtained by calculating the angle given by the window size considered in the PIV processing. Figure 10 presents the averaged normalised vorticity ω Z * overlaid with time-averaged flow streamlines. A contour line where U θ = 0 is also highlighted in red colour. The resulting θ s and C D values are also displayed at the bottom row of figure 10. As previously discussed, for a given Reynolds number (Re), there exists an optimal k/d ratio for maximising drag reduction. Deviating from this optimal ratio, either by decreasing or increasing k/d, rapidly diminishes performance benefits. At Re = 90 000, k/d = 0.004 yields the minimum C D = 0.3, corresponding to a separation angle of θ s = 147∘. This reduction in C D compared with its smooth counterpart amounts to 40 %. Correspondingly, the separation angle is delayed by 50∘. Although our measured θ s differs from previous data (with θ s = 104∘ for smooth surfaces and θ s = 147∘ for k/d = 0.004, while Choi et al. (Reference Choi, Jeon and Choi2006) reported θ s = 82∘ and θ s = 110∘ for similar k/d), the strong correlation between C D and θ s suggests that any disparities may stem from variations in sphere dimple arrangements (Aoki et al. Reference Aoki, Ohike, Yamaguchi and Nakayama2003). Notably, our k/d = 0.004 features a lower dimple coverage ratio compared with that of Choi et al. (Reference Choi, Jeon and Choi2006), while the k/d = 0.000 configuration for the morphable sphere exhibits shallow dimples due to pre-stretching of the flexible membrane. As k/d is further increased, θ s begins to converge back towards the value observed in the smooth configuration, remarking the trend reversal found during the forces analysis. Overall, figure 10 establishes that changes in drag are correlated with changes in the global flow separation location in the subcritical Reynolds number regime tested in this study.
3.4. Model relating optimal k/d and Re for minimising drag
In this section, we use the data presented in § 3.2 to develop an empirical control model relating optimal k/d and Re for minimising drag. To do so, we follow the approach presented by Chae et al. (Reference Chae, Lee, Kim and Lee2019). The authors provide an empirical model relating the C D evolution with Re as follows:
 \begin{align} C_D(Re)=C_{D,sub}-\mid \Delta C_D \mid \left (1+\exp\left [\frac {-2ln(1/s-1)}{\omega }(Re-Re_c)\right ]\right )^{-1} ,\end{align}
where C D, sub is the C D value in the subcritical Reynolds numbers before the drag crisis, ω is the change in Re between the pre- and post-crisis, Re c is the critical Reynolds number at which drag crisis occurs and s denotes the steepness of the drag crisis curve, as shown in figure 9. Due to limitations in the Re range of this study, we use the same values as Chae et al. (Reference Chae, Lee, Kim and Lee2019) for the smooth curve. In line with Chae et al. (Reference Chae, Lee, Kim and Lee2019), s is kept constant as 0.1, since it provides a good fitting for all the curves considered. Also, the duration of the drag crisis is set as ω = 25 000. The previous equation assumes the existence of a subcritical and post-critical Re, which limits its applicability in our study to k/d < 0.006. Nevertheless, k/d > 0.008 are not providing any C D reduction for the Re considered, making their consideration irrelevant for a drag reduction model. The data acquired during the experimental campaign are used to find the parameters that produce an optimum fit between C D and Re. In figure 9, we introduce the main parameters used to produce C D versus Re trends for all the spheres, with all the curves fitting the data with an r 2 value higher than 0.9. Once the main parameters are found, we can produce relations between ΔC D and Re c with k/d (see (3.2) and (3.3)). By doing so, we can project the C D evolution against Re for any k/d, leading to the curves presented at figure 9. Finally, we can use the new projections to delineate a relation between k/d and Re for minimum drag production, as depicted by a red line in figure 9,
 \begin{align} Re_c(k/d)=280\,000 \times e^{(-897\times k/d )}+62\,600, \end{align}
 \begin{align} \Delta C_D(k/d)=0.21 \times e^{(-597\times k/d )}+0.236, \end{align}
 \begin{align} k/d_{opt}(Re)=0.022 \times e^{(-2.05\times 10^{-5} Re)}+4.06\times 10^{-4}. \end{align}
This model not only provides a useful relationship between optimal roughness parameter and Reynolds numbers for minimising drag, but can also serve as the basis for a real-time closed-loop control implementation that is able to deploy optimum dimple depths adaptively with changing Re conditions. In the following section, we use this model to showcase real-time close loop implementation, whereby the morphable sphere detects flow velocity and adjusts dimple depth automatically in real-time to minimise the drag.
Normalised vorticity $\omega^{*}_{Z}$
flow fields and time-averaged streamlines for k/d = 0.000 and k/d = 0.004 at Re = 90 000 (top row). C
D and θ s for several k/d (bottom row). The red line in the top row represents the contour at which U
θ = 0.
$\omega^{*}_{Z}$
flow fields and time-averaged streamlines for k/d = 0.000 and k/d = 0.004 at Re = 90 000 (top row). C
D and θ s for several k/d (bottom row). The red line in the top row represents the contour at which U
θ = 0.
3.5. Closed-loop control of optimal dimple depth for drag minimisation at varying flow velocities
As previously discussed, the key advantage of our smart morphable approach lies in its ability to dynamically adjust surface topography to minimise drag for varying incoming flow velocity or Reynolds number (Re). In this section, we introduce a proof-of-concept of closed-loop control strategy designed to minimise drag across a varying range of flow conditions.
In this closed-loop control approach, the only required parameter is the incoming flow velocity, or Re. Once Re is determined, the smart morphable sphere (SMS) can calculate the optimal dimple depth for drag reduction using the model in (3.4). However, this typically requires an additional sensor to measure flow velocity, which increases system complexity and cost. To address this challenge, we developed an alternative method. In the subcritical regime, the drag coefficient of a smooth sphere remains constant (C D ≈ 0.55). Leveraging this property, we estimate Re directly from instantaneous force sensor data. With this estimate, the SMS adjusts the dimple depth to the optimal k/d using its closed-loop pneumatic actuation system.
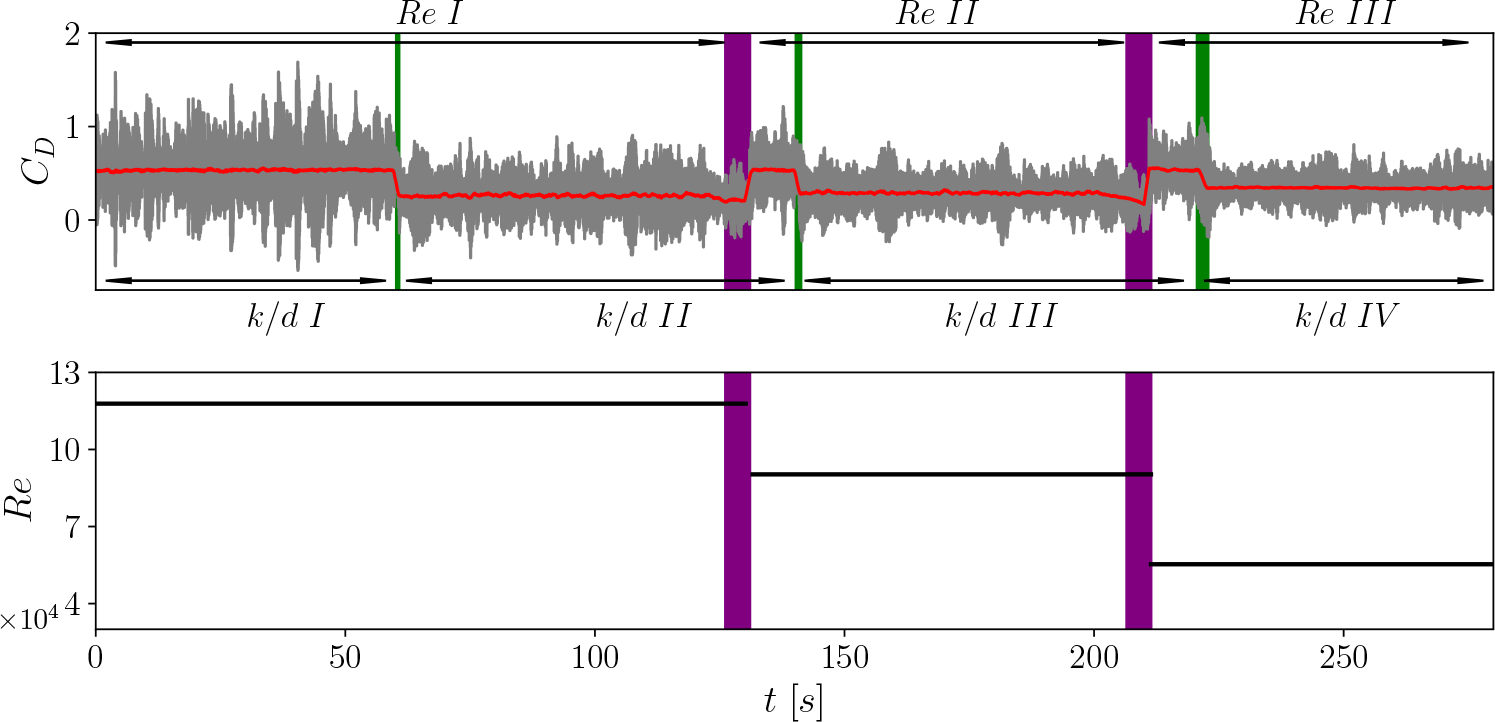
For the proof-of-concept demonstration shown in figure 11, we begin with the SMS in a smooth configuration (k/d I = 0) at Re I = 120 000. The protocol starts by collecting force data for 60 s, during which the model estimates the incoming flow velocity and Re by assuming C
D
= 0.55, using the relation $U_\infty =\sqrt {2 F_D/(\rho C_D A)}$
.
$U_\infty =\sqrt {2 F_D/(\rho C_D A)}$
.
Based on this estimate, the model calculates the optimal k/d II = 0.0023 using (3.4) and the dimples are deployed (indicated by the first green shaded area). This adjustment reduces the overall C D by 50 % compared with the smooth counterpart.
After 60 s in this state, the flow velocity in the wind tunnel test section is manually altered. The control model evaluates force data at 5-second intervals and detects a 10 % change in F D compared with the previous state (indicated by the purple shaded area), signalling a velocity change. The sphere is returned to its smooth configuration and the velocity estimation and optimal k/d determination process are repeated. For an input Re II = 90 000, the control model identifies an optimal k/d III = 0.0038, reducing C D by 50 % in real-time.
The process is repeated a third time with the input velocity adjusted to achieve Re III = 60 000. The model determines an optimal k/d IV = 0.0075. In this case, the drag reduction is less pronounced, with C D reduced to 0.35, a performance improvement of over 36 %.
This demonstration illustrates that the morphable approach effectively minimises drag at specific Reynolds numbers and dynamically adapts to sudden changes in flow conditions, optimising performance across a wide range of Re values. In summary, this section presents a proof-of-concept for a closed-loop control implementation, where the smart morphable sphere automatically detects changes in flow velocity and dynamically adjusts dimple depth to its optimal value, minimising drag efficiently.
C D evolution in time demonstrating closed-loop implementation for drag reduction purposes. Top figure: grey line indicates instantaneous C D and red line presents a moving average with a window of 1 s. Bottom figure: Re recognised by the controller during the closed-loop implementation. Purple areas indicate velocity changes and green areas denote dimple deployement by the smart morphable sphere. Here, Re I = 120 000, Re II = 90 000, Re III = 60 000, k/d I = 0 (smooth configuration), k/d II = 0.0023, k/d III = 0.0038 and k/d IV = 0.0075.
4. Summary and conclusions
In this study, we devised a novel smart morphing strategy that allows precise control of the surface topography with changing flow conditions. We first use this strategy to conduct a comprehensive series of systematic experiments for Reynolds numbers varying in the range of 6 × 10⁴ ≤ Re ≤ 1.3 × 10⁵ and dimple depth ratios of 0 ≤ k/d ≤ 2 × 10⁻² employing simultaneous force and flow field measurements. It was found that the dimple depth ratio plays a key role in affecting the onset of drag crisis as well as the minimum drag that could be achieved. While the baseline case (k/d = 0.000) resulted in a constant C D ≈ 0.55, introducing dimples led to C D reductions of up to 50 % across all Re considered. We observed that shallower dimples were more effective in reducing drag at high Re, with k/d = 0.002 triggering a drag crisis at Re = 130 000, resulting in a drastic 50 % reduction in C D compared with a smooth surface. As k/d increased, the critical Re value shifted to lower Reynolds numbers of Re = 70 000 at k/d = 0.006, while drag reduction was capped at 40 %. Further increases in k/d led to a reversal in the drag reduction trend, with performance benefits for k/d = 0.02 limited to 9 %.
The 2-D-2C PIV was conducted to correlate force evolution with wake characteristics, revealing that drag reductions were associated with a delay in the global flow separation location over the sphere’s surface. For instance, k/d = 0.004 exhibited a separation angle of θ s = 147∘ at Re = 90 000, contrasting with θ s = 104∘ for k/d = 0.000 under the same conditions. Finally, the experimental data was used to develop a predictive model linking Re to optimal k/d for minimising drag. To prove the real-time implementation capabilities of the smart morphable sphere, we conducted a proof-of-concept closed-loop implementation able to deploy optimum dimple depths for a given incoming flow condition for minimising drag, showing an almost instant drastic C D reduction of 50 %.
This study not only advances our fundamental understanding of how changes in surface topography influence drag reduction around a sphere but also establishes the groundwork for implementing adaptive flow control strategies. These strategies can be directly applied to unmanned marine and aerial vehicles. Future research should extend the range of incoming flow conditions for which this smart morphing strategy can offer drag benefits and focus on investigating the time evolution of the three-dimensional periodic structures in the wake. One potential limitation of this study is the influence of the support rod on force measurements in the supercritical regime. While prior studies (Sareen et al. Reference Sareen, Zhao, Sheridan, Hourigan and Thompson2018, Reference Sareen, Hourigan and Thompson2024a,b) indicate that the current support rod diameter ratio has minimal impact on the forces and wake in the subcritical and critical regimes, its effect in the supercritical regime remains uncertain. This is because flow separation occurs downstream of the support rod, potentially altering the loads acting on the sphere. Although rear support was not feasible due to experimental constraints, future studies on supercritical effects should explore alternative mounting strategies to further isolate aerodynamic forces.
Acknowledgements
The authors acknowledge the start-up funds provided by the Department of Naval Architecture and Marine Engineering and College of Engineering, University of Michigan, Ann Arbor. Sudarsana acknowledges financial support from the Indonesia Endowment Fund for Education (LPDP) under the Ministry of Finance, Republic of Indonesia. The authors also acknowledge Aditya Madhukar who helped in designing the preliminary pneumatic actuation system in the initial stages. The authors are grateful to the Department of Aerospace Engineering at U-M for providing the wind tunnel access. We thank LaVision for access to their PIV equipment.
Data availability
Raw data are available on request.
Author contributions
The first and second authors built the experimental set-up, performed the experiments, conducted data collection and analysis, and wrote the initial draft of the manuscript. The third author secured funding, conceptualised the idea and framework of the study, supervised the project, provided critical feedback, reviewed and revised the manuscript.
Funding
This work was supported by the start-up funds provided by the College of Engineering, University of Michigan, Ann Arbor.
Competing interests
The authors declare no conflict of interest.
Ethical standards
The research meets all ethical guidelines, including adherence to the legal requirements of the study country.


 Open access