

INTRODUCTION
Mycobacterium tuberculosis remains a leading infectious cause of morbidity and mortality despite the availability of inexpensive and effective antibiotic treatment. The most recent global estimates indicate that 9·3 million new cases of disease and 1·8 million deaths are attributable to tuberculosis (TB) each year [1]. The widespread emergence of multidrug-resistant tuberculosis (MDR TB; resistance to at least isoniazid and rifampin, the two most important antibiotics used against TB) is an additional challenge for global TB control efforts. The World Health Organization estimated there were 489 000 incident cases (4·8% of all incident cases) of MDR TB in 2006 [2], increasing from 424 000 (4·3% of all incident cases) in 2004 [Reference Zignol3]. While coordinated surveillance activities have resulted in a more comprehensive assessment of the global burden of drug-resistant TB [2], the dynamics of the appearance and spread of MDR TB in high-burden communities are not well characterized.
Over the last decade, tools for the collection and analysis of geospatial data have become increasingly accessible, affordable, and easy to use [Reference Elliott and Wartenberg4]. Spatial scan statistics have been used to identify hot spots of TB incidence [Reference Haase5–Reference Munch10] and one recent study used geographic data to investigate the spatial patterns of drug-resistant TB in a small group of refugees in Thailand [Reference Oeltmann11]. These studies demonstrate that geographic information can improve our understanding of the spatial and temporal spread of TB and can help to document outbreaks of MDR disease.
The collection of geographic data also permits new approaches for investigating the mechanisms that lead to the appearance and spread of drug resistance in communities. In particular, we hypothesize that the pattern of spatial aggregation differs between TB cases with MDR and non-MDR phenotypes. To test this hypothesis, we analysed the clinical, microbiological, and spatial data from over 11 000 cases of incident TB in Lima, Peru between 2005 and 2007.
METHODS
Study population and data collection
Our study population included all TB cases registered in the Peruvian National Tuberculosis Programme from two of Lima's four health districts, Lima Ciudad and contiguous health centre catchment areas of Lima Este between 1 January 2005 and 31 December 2007. We collected clinical information from TB registration records that are maintained in each health centre and laboratory information from a web-based laboratory information system (e-Chasqui) [Reference Blaya12]. The TB registration records provided patient-level information including basic demographics and history of anti-TB treatment. Laboratory records included the results of each sputum smear and culture and the drug-resistance profile if drug susceptibility test (DST) was performed. Based on the home addresses, study nurses identified the precise location of homes on high-resolution Google Earth maps generated for each health centre catchment area (for additional details see online Supplementary material). IRB approval was obtained from the National Institute of Health in Peru and the Partners HealthCare System in the USA.
Information on drug-resistant status
In Peru, only a subset of TB cases receive sputum culture and DST. Peruvian guidelines indicate that sputum culture and DST should be performed for patients at increased risk of MDR TB (e.g. history of anti-TB treatment and known household contact with MDR cases) or when first-line treatment fails [13]. DSTs were performed in the district reference laboratories of Lima Ciudad and Lima Este and in the national reference laboratory (Instituto Nacional de Salud). The district laboratories performed DST for first-line drugs using the direct Griess method for smear-positive samples from patients at high risk of MDR TB [Reference Asencios14, Reference Solis15], and the indirect proportion method on Löwenstein–Jensen media for all other samples. The national reference laboratory used the indirect proportion method on MB7H10 agar plates [Reference Kent and Kubica16]. Smear-negative and paucibacillary sputa from high-risk patients, including healthcare workers, HIV-positive patients, and children, were sent directly to the national reference laboratory for culture and indirect DST using BACTEC460TB (Becton-Dickinson, USA) [Reference Heifets17]. Those who did not receive DST or were not MDR after DST were classified as non-MDR for the baseline analysis. This classification approach underestimates resistance (since many of the non-tested cases may actually have had MDR); in our sensitivity analysis we address potential biases associated with incomplete and non-random testing (for additional details see online Supplementary material).
Data analysis
Main analysis
In the exploratory data analysis, kernel smoothing was first used to map the spatial point pattern for all TB cases and then for the subset of cases with detected MDR TB. The quartic kernel function was used, with the kernel width parameter selected to minimize the mean square error for each smoothed surface [Reference Berman and Diggle18, Reference Rowlingson and Diggle19]. To compare the spatial distribution of patients with and without MDR TB, we adopted a two-step approach. First, we used Ripley's spatial K function to estimate the degree of aggregation in cases of MDR and non-MDR TB at different spatial scales [Reference Diggle20]. Second, we computed the spatial D function by subtracting the K function of non-MDR TB cases from that of MDR TB cases to measure the difference in spatial aggregation between cases of MDR TB and cases of non-MDR TB. To explore the temporal change of spatial aggregation between MDR and non-MDR cases, we divided our cases into 6-month intervals and computed the spatial K statistic and D statistic within each period. To maximize the statistical power, we also pooled across the period-specific K function (i.e. weighted average of all period-specific K function with the weights determined by the number of cases in each period) to obtain an aggregated K function of MDR and non-MDR cases and, correspondingly, an aggregated D function. We estimated the spatiotemporal K function and D function using a similar approach that incorporated both the space and time dimensions across a range of different space–time scales. The statistical uncertainty of K function and D function was characterized using repeated simulations to generate the 95% simulation envelope (for additional details see online Supplementary material).
Subgroup analysis
We separately compared the spatial distribution of MDR and non-MDR cases in subgroups without previous anti-TB treatment. Assuming that MDR TB patients without a recorded history of previous treatment actually represented cases of primary drug resistance, the analysis from these patients allowed us to investigate differences in the transmission of MDR and non-MDR TB.
Sensitivity analysis
Since only 1187 of the total 11 711 TB cases (10·1%) received DST, it is possible that any observed differences in MDR and non-MDR aggregation may have resulted from geographic variation in the use of DST rather than as a result of true differences in the spatiotemporal distribution of MDR and non-MDR disease. To probe for the presence of such bias, we estimated the probability of receiving DST conditional on TB and that of MDR conditional on DST at the health-centre level. If the prevalence of MDR is similar throughout the study region and differential utilization of DST is responsible for differences in observed patterns of MDR and non-MDR disease, health centres with overtesting (i.e. those with higher estimated probability of DST conditional on TB) will appear to have a lower prevalence of MDR in tested cases. Similarly, we mapped and compared the spatial density of DST conditional on TB and that of MDR conditional on DST to see if peaks in the map of DST conditional on TB (locations with relatively high probabilities of testing) correspond to troughs in that of MDR conditional on DST (locations of relative overtesting). To assess the potential impact of geographically differential DST and underestimation of MDR, we reassigned (imputed) a proportion of the ‘non-MDR’ patients that had not received a DST to the ‘MDR’ category based on the inverse probability of receiving DST at a given location and repeated the analysis. The reconstructed datasets used in this sensitivity analysis were designed to have a total fraction of MDR cases similar to that in a drug-resistance survey conducted in this setting during this time period (for additional details see online Supplementary material).
Data analysis was conducted in R 2.8.1 (R Project for Statistical Computing, http://cran.r-project.org).
RESULTS
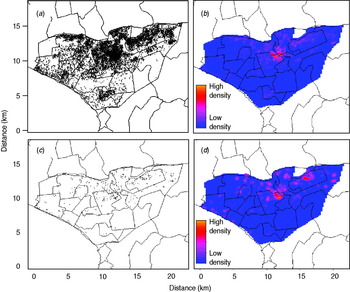
Of the total 12 222 registered TB cases during the study period, 511 (4·2%) were excluded due to incomplete information on home location, leaving a final sample size of 11 711 cases. The number of registered TB cases per health centre ranged from two (Hospital Nacional Dos De Mayo and Centro de Salud Mirones Bajo) to 749 (Centro de Salud San Cosme). Of the 11 711 cases 1187 (10·1%) received DST with the following results: 519 (4·4% of all cases, 43·7% of tested cases) were resistant to isoniazid, 433 (3·7% of all cases, 36·5% of tested cases) were resistant to rifampin, and 376 (3·2% of all cases, 31·7% of tested cases) were resistant to both drugs and classified as MDR. Of these cases 31·2% had previously been treated for TB. The proportion of confirmed MDR TB was 1·5% and 6·9% in those without and with a history of anti-TB treatment. Of those who received DST, the proportion of MDR was 21·4% and 40·2% in those without and with previous anti-TB treatment, respectively. Compared to cases without MDR, those with MDR were more likely to be male, to have positive sputum smear, to have history of TB treatment, and to have had known household contacts with MDR cases (Table 1). The spatial point distribution and smoothed maps of all TB and MDR cases are presented in Figure 1. During the study period, the annual number of TB cases decreased slightly and the proportion of cases with the MDR phenotype increased (Table 2); this pattern is consistent with the trend in Peru as a whole [Reference Dye21].
Spatial point pattern and smoothed maps of all and multidrug-resistant tuberculosis (MDR TB) cases in the study region (highlighted area). (a) Spatial point pattern of all TB cases; (b) kernel smoothed map of all TB cases; (c) spatial point pattern of MDR TB cases; (d) kernel smoothed map of MDR TB cases. (A small random error was added to the spatial coordinates of each individual to protect confidentiality.)
Baseline characteristics of detected multidrug-resistant tuberculosis (MDR TB) cases and those without detected MDR TB registered during 2005–2007 in Lima Ciudad and Lima Este, Peru
Values represent percentages unless otherwise noted.
IQR, Interquartile range.
* Non-MDR TB includes: (1) TB cases receiving drug susceptibility test that did not have rifampin and isoniazid resistance; (2) TB cases that did not have drug sensitivity testing.
Number of detected multidrug-resistant tuberculosis (MDR TB) cases and those without detected multidrug-resistant TB in different periods throughout the study duration
* Non-MDR TB includes: (1) TB cases receiving drug susceptibility test that did not have rifampin and isoniazid resistance; (2) TB cases that did not have drug sensitivity testing.
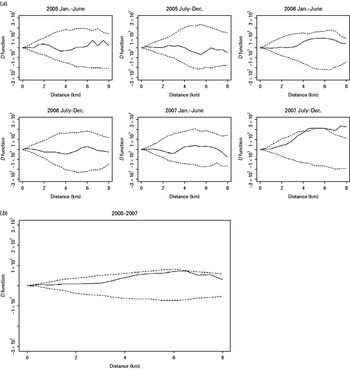
The K function of both MDR and non-MDR cases showed a significant pattern of spatial aggregation in each of the 3 years of the study (Fig. S1, Supplementary material). Because the spatial aggregation of TB cases is, at least in part, due to the heterogeneity of the underlying population density in the study areas, the spatial aggregation of MDR and non-MDR cases was compared using the D statistic. The two groups of TB patients did not show significant difference in spatial aggregation until the second half of 2007 when increased spatial aggregation was observed for MDR cases at a distance >4 km (Fig. 2a). When the period-specific D statistics were aggregated over time, the spatial aggregation between the two groups did not differ significantly (Fig. 2b).
The spatial D function (K DR – K NDR) and 95% simulation envelope of tuberculosis cases. (a) Period-specific D function by 6-month interval; (b) aggregated D function over total study period. Different locations of the observed D function compared to the simulation envelope indicate different relative spatial aggregation of the two types of cases. When the D function is above the simulation envelope, this is consistent with increased aggregation of multidrug-resistant (MDR) cases (relative to non-MDR cases); when it is within the simulation envelope, this is consistent with similar aggregation of the two types of cases; when it is below the simulation envelope, this is consistent with increased aggregation of non-MDR cases.
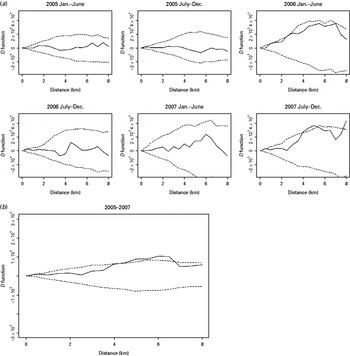
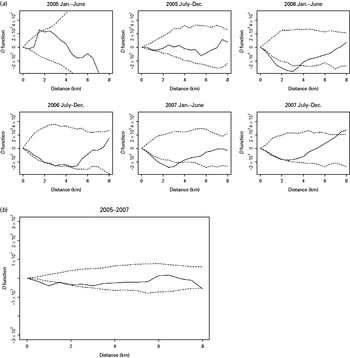
When we inspected the D statistics for cases without previous TB treatment (Fig. 3) and for cases with previous anti-TB treatment (Fig. 4) and compared them with the D statistics for all cases (Fig. 2), we found that the increased spatial aggregation of MDR observed in the entire study population was probably attributable to those without previous TB treatment. Similarly, in the period-specific analysis increased spatial aggregation of MDR in the second half of 2007 was also observed in cases without previous anti-TB treatment but not in those with previous treatment. In the spatiotemporal analysis we did not find significant difference in the spatiotemporal D function comparing MDR and non-MDR cases.
The spatial D function (K DR – K NDR) and 95% simulation envelope of tuberculosis cases without previous anti-tuberculosis treatment. (a) Period-specific D function by 6-month interval; (b) aggregated D function over total study period. Different locations of the observed D function compared to the simulation envelope indicate different relative spatial aggregation of the two types of cases. When the D function is above the simulation envelope, this is consistent with increased aggregation of multidrug-resistant (MDR) cases (relative to non-MDR cases); when it is within the simulation envelope, this is consistent with similar aggregation of the two types of cases; when it is below the simulation envelope, this is consistent with increased aggregation of non-MDR cases.
The spatial D function (K DR – K NDR) and 95% simulation envelope of tuberculosis cases with previous anti-tuberculosis treatment. (a) Period-specific D function by 6-month interval; (b) aggregated D function over total study period. Different locations of the observed D function compared to the simulation envelope indicate different relative spatial aggregation of the two types of cases. When the D function is above the simulation envelope, this is consistent with increased aggregation of multidrug-resistant (MDR) cases (relative to non-MDR cases); when it is within the simulation envelope, this is consistent with similar aggregation of the two types of cases; when it is below the simulation envelope, this is consistent with increased aggregation of non-MDR cases.
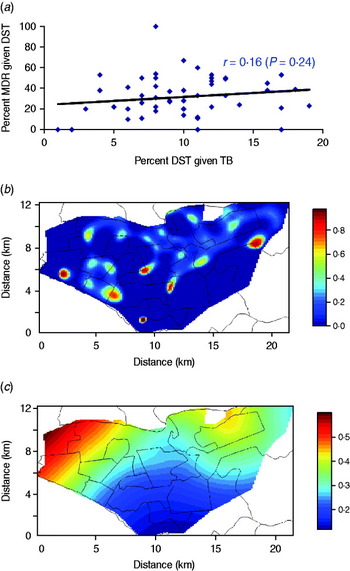
We found that the probability of receiving DST conditional on TB was weakly and positively correlated with that of MDR conditional on DST at the health-centre level (Fig. 5a), inconsistent with differential use of DST. We also mapped the spatial density of DST conditional on all TB with that of MDR conditional on DST (Fig. 5b, c). Although there was substantial spatial heterogeneity in use of DST, the contrast between these two maps does not indicate that differential utilization of DST can alone explain the different aggregation patterns of MDR and non-MDR cases. In a conservative sensitivity analysis (where a fraction of the patients without DST were reassigned as MDR based on the inverse probability of receiving DST), MDR cases were less likely to aggregate spatially than non-MDR cases (Fig. S2, Supplementary material).
Sensitivity analysis on the correlation between the probability of receiving drug susceptibility test (DST) conditional on tuberculosis (TB) and that of multidrug resistance (MDR) conditional on DST. (a) Scatter plot of probability of DST conditional on TB and that of MDR conditional on DST at the health-centre level; (b) mapped spatial density of DST conditional on TB; (c) mapped spatial density of MDR conditional on DST.
DISCUSSION
In this retrospective study of 11 711 TB cases from Lima, Peru, we compared the spatiotemporal distribution of TB patients with different drug-resistance phenotypes, with the aim of exploring the mechanisms driving the appearance of MDR TB. To our knowledge this is the largest spatial analysis of MDR TB in a high-burden urban setting. We found that spatial aggregation of patients with confirmed MDR disease was similar to that of other patients in 2005 and 2006; towards the end of 2007 cases with confirmed MDR disease were more tightly grouped. Our subgroup analysis suggests that this observed increased aggregation of MDR was probably due to increased aggregation of MDR in TB patients without a previous history of TB treatment; this would be consistent with relatively increasing transmission of MDR disease.
Previous geographic analyses of TB used spatial or space–time scan statistics to identify clusters of TB cases (hot spots) that could not be explained by chance alone [Reference Haase5–Reference Oeltmann11]. One study from a refugee camp in Thailand examined 24 cases with MDR TB and did not find any significant spatial clusters [Reference Oeltmann11]. In contrast to previous spatial analyses that attempt to locate clusters of disease, our study examines the overall pattern of spatial aggregation in cases with and without MDR TB and provides estimates of the relative degree of aggregation of these two phenotypic categories of disease. In order to address the influence of the underlying population density, previous spatial studies have aggregated data by administrative blocks (e.g. census tract or ZIP code) since information on population density is often available only at these gross administrative levels. However, such aggregated analyses will result in a lower sensitivity for detecting TB outbreaks than analyses using individual-level data [Reference Ozonoff22, Reference Higgs23]. Since our approach used comparisons of MDR and non-MDR cases arising from the same base population, our analysis is not compromised by non-uniform population density and thus we were able to utilize the highest possible level of resolution (i.e. individual-level spatial information).
Throughout the study period, we found that cases of MDR TB were at least as likely to be found in spatial aggregation as cases without MDR TB; furthermore, in the last year of the study, MDR cases were more likely to aggregate than non-MDR cases. Although the number of MDR cases also increased throughout the study period, the increased density of MDR TB cases alone could not explain the increased spatial aggregation since Ripley's K function (and therefore the D function) adjusted for the density of cases in the study region (see Supplementary online material). We note that differences in the spatial distribution of MDR and non-MDR cases could have arisen through numerous mechanisms related to either changes in (a) risk of acquired and/or (b) primary (transmitted) drug resistance. For example, risk factors for acquired resistance related to individual behaviour (e.g. greater non-adherence due to social risk factors) or programmatic performance (e.g. more rigorous directly observed therapy and/or case holding in certain health centres) may be spatially clustered. In contrast, the emergence of relatively transmissible, drug-resistant strains or environmental or programmatic factors favouring transmission of MDR strains may contribute to increasing aggregation of MDR. Consistent with this latter mechanism, our subgroup analysis of those without previous TB treatment suggests that the increased aggregation of MDR cases near the end of the study period may be due to relatively increased transmission of MDR disease compared to non-MDR disease.
We note that the spatiotemporal analysis itself does not provide information regarding the underlying mechanism responsible for the relatively increased transmission of MDR TB in 2007. Transmitted resistance has been shown to contribute substantially to the burden of MDR and extensively drug-resistant TB in both high and low HIV settings [Reference Zhao24–Reference Andrews26]. Therefore our finding should trigger further investigation to verify this interpretation and to explore the factors that may underlie our observation of relatively increased transmission of MDR in this community. For example, genotyping of TB isolates would allow for investigation of whether the proportion of clustered isolates increased more for MDR cases than other TB cases in 2007, interview of MDR and non-MDR cases may reveal changing contact patterns, and examination of the performance of TB control programmes for MDR and non-MDR cases may reveal improving relative control of non-MDR cases near the end of the study period.
A minority of our study population (10·1%) received DST; accordingly, substantial misclassification exists in this crude dataset since a fraction of TB cases that were never tested were actually MDR. Although we note that Ripley's K statistic is insensitive to random thinning (sampling) of the true underlying spatial density [Reference Diggle20], our results would still be biased if (and only if) the observed spatial aggregation of detected MDR was due to geographically differential use of DST. Fortunately, our sensitivity analysis revealed that while there was substantial spatial heterogeneity in DST in our study region, this did not simply reflect differential utilization of DST in the presence of geographically similar prevalence of MDR. We also used data from a local drug-resistance survey to ‘reassign’ untested cases to MDR status in order to generate a dataset that fit the total proportion of TB cases that were MDR in the study region. In this sensitivity analysis increased relative aggregation of non-MDR cases was found. We note that this was a highly conservative sensitivity analysis since by design it decreased spatial aggregation of MDR cases and made it more difficult to observe relatively increased spatial aggregation in MDR cases.
In summary, we used information on the time of diagnosis and location of TB patients to compare the spatiotemporal distribution of drug-sensitive and drug-resistant TB cases. The results from this type of analytical approach can provide practical insights into the potential mechanisms responsible for the appearance and spread of MDR TB and should facilitate further investigation into the forces driving such spatiotemporal evolution. The low cost of georeferencing instruments and freely available software (Google Earth) make our approach particularly appealing for resource-constrained settings in which routine molecular typing of TB isolates is prohibitively expensive. The incorporation of spatial information into standard TB data-collection instruments promises to enhance efforts to implement early, targeted strategies to initiate timely treatment of drug-resistant cases and reduce ongoing transmission of MDR TB.
NOTE
Supplementary material accompanies this paper on the Journal's website (http://journals.cambridge.org/hyg).
ACKNOWLEDGEMENTS
We gratefully acknowledge the support of Socios En Salud Sucursal Peru, which was essential for this study. We thank Jeff Blossom for advice on the use of geographic information systems. We also thank the participating health establishments and their personnel for their contribution.
H.L. was supported by a Harvard Catalyst Pilot Grant funded through NIH UL1 RR025758. S.S. was supported by NIAID K23 AI054591-01, Heiser Foundation, and Infectious Diseases Society of America. J.A.B. was supported by an NIH National Research Service Award. T.C. was supported by NIH U19 A1076217 and NIH U54 GM088558.
DECLARATION OF INTEREST
None.


