


1. Introduction
On 11 March 2020, coronavirus disease 2019 (COVID-19) was declared a pandemic by the World Health Organization (WHO) (WHO, 2020). Following this declaration, lockdowns and quarantine measures began around the world, leading to unprecedented worldwide impacts. The cost and disruption of human lives caused by the pandemic are undeniable; as of 14 October, over 38 million cases and 1 million deaths have been confirmed (WHO, 2020) and these numbers are still rising. Additionally to human health disruptions caused by the pandemic, environmental and economic impacts are also severe (Chakraborty & Maity, Reference Chakraborty and Maity2020).
The COVID-19 pandemic pointed out the vitality of the energy system and the necessity of reliable access for individuals and industries, not to mention hospitals and other essential services (European Commission, 2020). It also highlighted the importance of the dynamics of energy systems and the challenges associated with both energy supply and energy demand. The changes in our lifestyles (e.g. working from home, less commuting) led to changes in our energy demand, which temporarily dampened global CO2 emissions (Le Quéré et al., Reference Le Quéré, Jackson, Jones, Smith, Abernethy, Andrew and Peters2020). According to the International Energy Agency (IEA), the shock to energy demand due to this pandemic is set to be the largest in the last 70 years, illustrated in Figure 1, and a 6% reduction in the global energy demand for 2020 is estimated, seven times the decline after the 2008 global financial crisis (International Energy Agency (IEA), 2020). Global crises are known to lead to overall reductions in greenhouse gas (GHG) emissions, however, these are often temporary, suggesting that COVID-19 might not have significant positive impacts on climate change in the long run, but rather detrimental impacts on the environment due to negative secondary effects (Zambrano-Monserrate et al., Reference Zambrano-Monserrate, Ruano and Sanchez-Alcalde2020). Both climate change and COVID-19 are global issues having impacts of unprecedented and largely uncertain magnitude (Rosenbloom & Markard, Reference Rosenbloom and Markard2020). Misinformation due to political purposes in several countries increases this uncertainty (Hensher et al., Reference Hensher, Kish, Farley, Quilley and Zywert2020).
Global energy demand between 1900 and 2020 (International Energy Agency (IEA), 2020).

The discussed decline in energy demand was accompanied by patterns of energy use on weekdays similar to pre-crisis Sundays. Moreover, the security of energy supply has turned to be an even more serious concern for the policymakers and governments during the pandemic period (Tahir & Batool, Reference Tahir and Batool2020), which has been identified as an opportunity to reconsider the high dependency on non-renewable alternatives. As highlighted in newspapers from Australia (Morgan, Reference Morgan2020) and India (PTI, 2020); COVID-19 may act as a push for a more sustainable future (Muhammad et al., Reference Muhammad, Long and Salman2020; Wang & Su, Reference Wang and Su2020). Previous literature has shown that the transition from a fossil fuel-based economy to one that is sustainable and reliable in times of economic and social crises is necessary (Le Quéré et al., Reference Le Quéré, Jackson, Jones, Smith, Abernethy, Andrew and Peters2020; Rosenbloom & Markard, Reference Rosenbloom and Markard2020; Smith, Reference Smith2020). As mentioned by Smith (Reference Smith2020), an electrical crisis and social instability in times of pandemics can be catastrophic for the restriction of further amplification of the crisis. The dependency of various countries on fossil-based energy is increasingly perilous (Palmer, Reference Palmer2019); this is largely due to the decreasing availability of easy-to-access, and consequently cheap, fossil fuels, whilst the price of competing for renewable energy plummets (Kåberger, Reference Kåberger2018). The instability that fossil fuels bring is crucial to combat in times of a social crisis. This is especially true as pandemics, such as COVID-19, are known to have a significant influence on electric and petroleum demand (Norouzi et al., Reference Norouzi, Zarazua de Rubens, Choubanpishehzafar and Enevoldsen2020). By understanding the potential energy impacts of quarantine measures in different countries, it might provide insights into the direction that governments may need to take if humankind is to achieve a sustainable future, one that is not threatened by energy failures that may arise from a dependency on fossil fuels (Smith, Reference Smith2020).
On the same hand, air quality is essential for human health and air pollution is an important environmental risk factor. Air pollutants have proven to have a wide range of adverse impacts on human health, ranging from subtle subclinical effects to premature death (WHO, 2016, 2019). Particulate matter (PM) is considered one of the most dangerous airborne pollutants emitted from biogenic and anthropogenic sources or formed from atmospheric reactions (Khaniabadi et al., Reference Khaniabadi, Sicard, Takdastan, Hopke, Taiwo, Khaniabadi and Daryanoosh2019). PM pollution is characterized in terms of the mass concentration of particle matters with an aerodynamic diameter smaller than 2.5 μm (known as PM2.5) or 10 μm (known as PM10) as well as their number and chemical composition (Amoatey et al., Reference Amoatey, Sicard, De Marco and Khaniabadi2020; WHO, 2016). Due to its nano-scale, PM2.5 can penetrate and get inhaled into the lungs easily and cause chronic obstructive pulmonary disease (COPD) and mortality, particularly in the elderly (Amoatey et al., Reference Amoatey, Sicard, De Marco and Khaniabadi2020). PM10 is also associated with an increased risk of mortality and can lead to cardiovascular diseases, mostly in infants and children (Al-Hemoud et al., Reference Al-Hemoud, Gasana, Al-Dabbous, Al-Shatti and Al-Khayat2018; Khaniabadi et al., Reference Khaniabadi, Sicard, Takdastan, Hopke, Taiwo, Khaniabadi and Daryanoosh2019). Nitrogen dioxide (NO2) is another harmful pollutant that is proved to have adverse impacts on human health and can lead to diseases such as lung cancer (Khaniabadi et al., Reference Khaniabadi, Goudarzi, Daryanoosh, Borgini, Tittarelli and De Marco2017). Additionally, ozone (O3), carbon dioxide (CO2), and sulfur dioxide (SO2) are also considered classic air pollutants that can affect human health and even cause death (Luo et al., Reference Luo, Guan, Lin, Wang, Yang, Tan and Wang2020).
China was the first of many countries to announce a complete lockdown and (as expected) the NO2 emissions plummeted (NASA, 2020). However, the concentration of air pollutants started to increase due to the restart of human activities (e.g. commuting to work), as the lockdown measures were relaxed in different countries.
Different studies have assessed the influence of air pollutants in the death rate of COVID-19, concluding that there is a positive relationship between these pollutants and the death rate due to COVID-19 (Cole et al., Reference Cole, Ozgen and Strobl2020; Ogen, Reference Ogen2020; Zoran et al., Reference Zoran, Savastru, Savastru and Tautan2020). The studies have also shown that the geographic and climatic factors are influential in the transmission of COVID-19 (Abdollahi & Rahbaralam, Reference Abdollahi and Rahbaralam2020). There are air quality guidelines and threshold limits for these pollutants provided by the WHO and other authorities in both developed and emerging countries (Oliveri Conti et al., Reference Oliveri Conti, Heibati, Kloog, Fiore and Ferrante2017). Yet, there is a gap in the literature on studying the health impact of exposure to other air pollutants in urban areas in different geographic, demographic and climate characteristics (Khaniabadi et al., Reference Khaniabadi, Sicard, Takdastan, Hopke, Taiwo, Khaniabadi and Daryanoosh2019). A geographical comparison is a common approach in ecological studies (Coggon et al., Reference Coggon, Barker and Rose2009). (Araújo et al., Reference Araújo, Mestre and Naimi2020) highlighted the importance of ecological studies for investigating COVID-19.
This paper aims to add to the current discussion on how climate change and human health might be impacted by drastic changes in energy consumption/production behaviors as well as lifestyles in different countries. As an ecological approach, this paper integrates two areas of air quality and energy policy and links them with human health to highlight the importance of geographical, climatic, behavioral, and political diversity. In this sense, this study compares the electricity production of different countries, namely Colombia, France, the Netherlands, and Portugal, to evaluate the GHG mitigation impact of COVID-19 lockdown measures on climate change. Moreover, this study assesses the influence of the COVID-19 outbreak on the air quality of the selected countries (using the main cities as references) to evaluate the influence of air pollution reduction on human health.
2. Methodology
Four countries were selected as case studies: Colombia, France, the Netherlands, and Portugal to evaluate the influence of the COVID-19 pandemic on electricity production and air quality. This selection allows for a comparison of countries with different COVID-19 lockdown measures, energy mix, policy measures, spatial characteristics, and population behavior. The study was conducted on a comparative basis for the years 2019 and 2020 for January, February, March, April, and May to assess the impact of the COVID-19 outbreak.
This section is structured as follows: first, the four case studies are introduced with their respective information regarding the lockdown measures, electricity consumption, and total installed capacity (electricity mix). Second, the methodology for determining GHG emissions from the electricity production of the studied cases during the selected period is presented. Finally, the methodology for evaluating the impacts of COVID-19 on human health due to air quality in four main cities of the selected case studies is described.
2.1 Case studies
2.1.1 Colombia
The lockdown in Colombia started on March 25 and it was announced that it would last 19 days. However, it was prolonged through different phases. Despite the attempts of the local authorities to prevent people from going out of their residences, the socio-economic conditions in Colombia do not allow people to stay at home. Therefore, citizens prefer to risk their health to provide food for their households (Reuters, 2020). An overview of electricity consumption during the selected period in Colombia is presented in Figure 2. Electricity consumption increased in the first two months of 2020 with an increment of 5% and 8% in comparison to 2019, respectively. The lockdown in Colombia started at the end of March 2020, while the effect of COVID-19 was evidenced in the electricity consumption of this month. April and May were the months with the highest reduction in electricity consumption accounting for a decrease of 12% and 8%, respectively. Nevertheless, the consumption of electricity increased from April to May because of the lack of control from the Colombian government during the quarantine period.
Electricity consumption in Colombia in the first five months of 2019 and 2020 (XM S.A. E.S.P, 2020).

The total installed capacity of electricity in Colombia is ruled by the use of hydropower, natural gas, and coal, as shown in Figure 3. Hydropower accounts for 67% of the total electricity capacity, while natural gas and coal account for 14% and 9%, respectively. The remaining 10% is distributed among diesel (5%), kerosene (2%), oil-based fuels (2%), and bagasse (1%).
Total installed capacity for electricity generation in Colombia (XM S.A. E.S.P, 2020).

2.1.2 France
France experienced an intense, highly restrictive period of confinement from March 17 until May 11 of 2020. According to the IEA, the electricity demand was reduced by up to 20% after 17 days of lockdown (International Energy Agency (IEA), 2020). This decrease was caused by the closure of all public places and businesses including restaurants, museums, sports locations, and other non-essential businesses, with the industry sector being particularly affected. Overall, the decrease was found to be up to 20% compared to previous years when compared to the equivalent period of the year, as presented in Figure 4 (Commission de Régulation de l’Énergie (CRE), 2020). Following the confinement, electricity consumption progressively increased, likely as a result of the partial recovery of economic activity (LeLynx.fr, 2020).
Electricity consumption in France in the first five months of 2019 and 2020 (Commission de Régulation de l’Énergie (CRE), 2020).

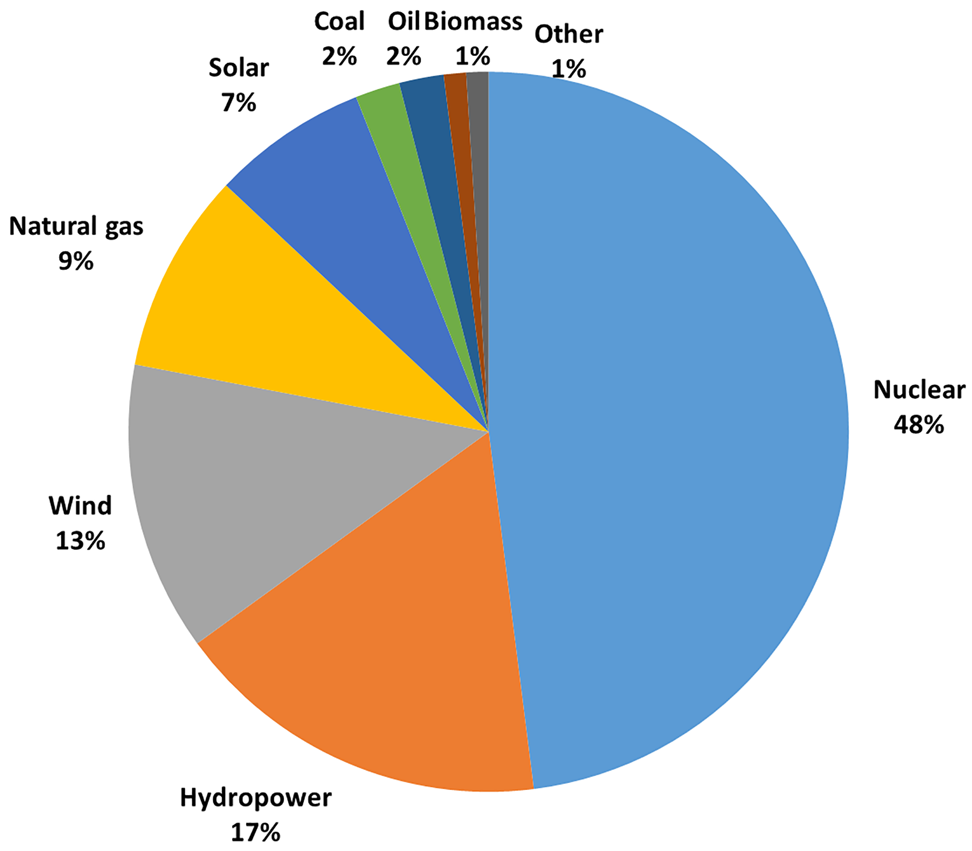
Nuclear and renewable sources (hydropower, wind, solar) account for 86% of the total installed energy capacity in France, as shown in Figure 5. Nuclear is the main energy source (48%) followed by hydropower (17%), wind (13%), natural gas (9%), and solar (7%). The remaining capacity is distributed between coal, oil, and biomass.
Total installed capacity for electricity generation in France (European Network of Transmission System Operators for Electricity (ENTSOE), 2020b).
2.1.3 The Netherlands
In the Netherlands, measures for the tackling of COVID-19 were gradually put in place from beginning to mid-March. In a so-called intelligent lock-down, gatherings were banned, schools were closed, and social distancing was implemented throughout the country. A result of the measures was a decrease of about 50% in the use of public transport and/or commuting, as well as recreation and retail activity. The media predicted a large overall electricity consumption decrease, a likely result of decreased activity in the industrial and commercial sectors (Klaassen, Reference Klaassen2020). On the other hand, residential electricity consumption was not expected to decrease, as individuals were encouraged to stay home and avoid public places. As with many countries around the world, the overall economic impact of COVID-19 was largely experienced through a slowing down and regression in economic growth (CBS, 2020a). The CBS (Statistics Netherlands) identified that the COVID-19 impact on energy was largely felt on petroleum demand (CBS, 2020b). A decline of up to 20% of petrol and kerosene sales was identified between January and March. An overview of the electricity consumption of the Netherlands is presented in Figure 6.

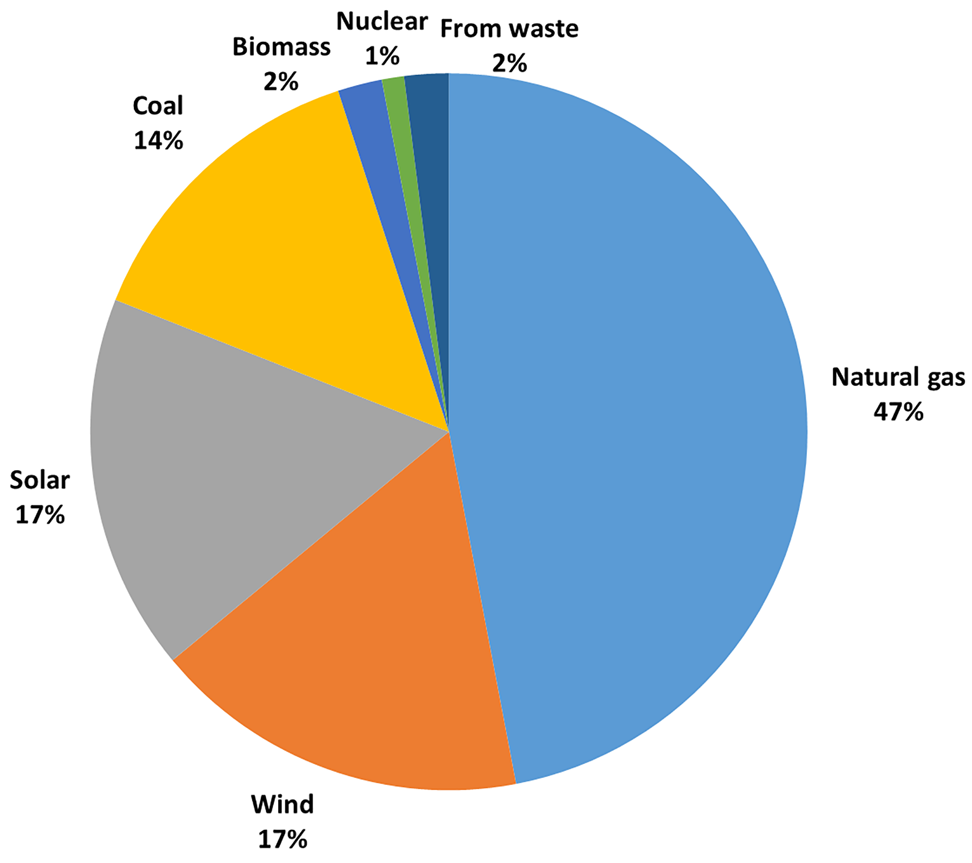
The total installed capacity of the Netherlands in 2020 is summarized in Figure 7. The main energy source in the Netherlands is natural gas, followed by solar, wind, and coal. In 2020, installed capacity to produce electricity from natural gas accounts for 47%, while solar, wind, and coal account for 17%, 17%, and 14%, respectively.
Total installed capacity for electricity generation in the Netherlands (European Network of Transmission System Operators for Electricity (ENTSOE), 2020b).

2.1.4 Portugal
To prevent homes from being cut-off from electricity during COVID-19, the Portuguese government passed exceptional measures under which the providing of electricity to homes was not to be interrupted under any circumstances (ERSE, 2020). The state of emergency was announced on March 18, and it lasted until May 2. After the third death caused by COVID-19 reported on March 20, all events and non-essential events were banned and the borders, schools, and non-essential shops were closed. According to the Redes Energéticas Nacionais (REN), electricity consumption was reduced by 12% and 13.2% in April and May, respectively. However, this reduction was altered to 7.4% in June. Overall, the electricity consumption in the first half of 2020 faced a 5.1% reduction and reached the lowest level since 2004 (REN, 2020). Figure 8 presents the comparison of the electricity consumption in Portugal during the COVID-19 lockdown and the same months in 2019.
Electricity consumption in Portugal in the first five months of 2019 and 2020 (REN, 2020).

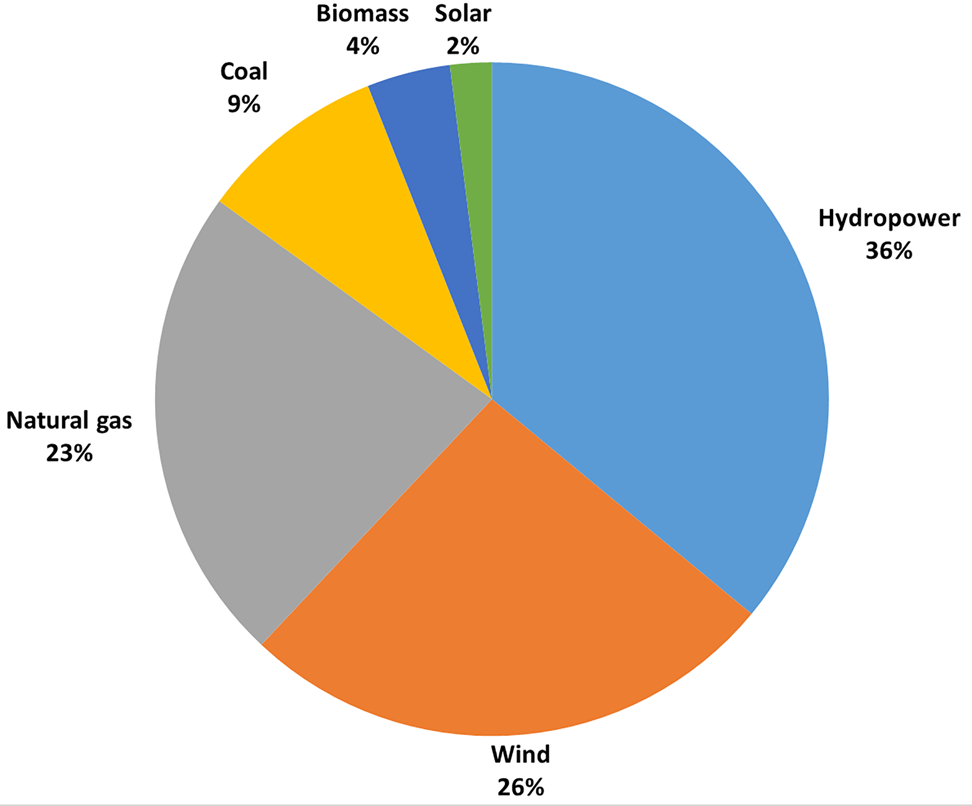
The contribution of renewables to the total installed capacity in Portugal is 68%, as shown in Figure 9. Among renewables, hydropower has the highest contribution (36%) followed by wind (26%). On the other hand, non-renewables account for 32% of the total installed capacity. Natural gas is the main non-renewable source with a contribution of 23%, while coal contributes to 9%.
Total installed capacity for electricity generation in Portugal (European Network of Transmission System Operators for Electricity (ENTSOE), 2020b).

2.2 GHG emissions from electricity production
The calculation of the GHG emissions was divided into two procedures: first, the data for the total installed capacity and electricity generation were collected, and second, the GHG emissions from the generation of electricity during the lockdown period were calculated.
For the European countries, the data were obtained from the European Network of Transmission System Operators for Electricity (ENTSOE) (European Network of Transmission System Operators for Electricity (ENTSOE), 2020a). The Actual Generation per Production Type category was chosen which also provides data points on the total production of electricity. For Colombia, the data were collected from the XM Company Expertos en Mercados S.A. E.S.P that operates Colombia's national SIN grid and administers the local wholesale energy market (XM S.A. E.S.P, 2020). Although both platforms provide up-to-date data on electricity production and consumption as well as many other sectors of the energy information of Europe and Colombia, it is entirely reliant on individual companies and countries that send forth their data.
The GHG emissions from the electricity production in each country were calculated using the data for the selected months in 2019 and 2020, and the software SimaPro (PRé Consultants, the Netherlands). The functional unit was set to production of 1 MJ electricity and IMPACT World + was selected as the impact assessment method to utilize characterization factors at a global scale resolution, which is important when comparing EU countries and Colombia (Bulle et al., Reference Bulle, Margni, Patouillard, Boulay, Bourgault, De Bruille and Jolliet2019). The global warming potential (GWP) was chosen as the impact category to calculate the GHG emissions of different energy systems.
2.3 Air quality indicators
2.3.1 Concentration of air quality indicators
Four cities of Bogotá (Colombia), Lille (France), Lisbon (Portugal), and Utrecht (the Netherlands) were selected to assess the influence of the COVID-19 pandemic on the air quality. The average monthly concentrations of PM2.5, PM10, and NO2 were obtained based on the traffic stations for the studied period, i.e. the months of January, February, March, April, and May of the years 2019 and 2020. For the European cities (Lille, Lisbon, and Utrecht), these data were obtained from the European Environmental Agency (European Environment Agency, 2020) and for Bogotá, the data were collected from the Bogotá Air Quality Monitoring Network (Secretaria Distrital de Ambiente, 2020).
2.3.2 Impact assessment
After evaluating the influence of the COVID-19 pandemic on the aforementioned air quality indicators (AQIs), their impacts on human health were analyzed. Toward that, the long-term effects of the changes in the PM2.5 and NO2 concentrations were evaluated. The health effects from long-term exposure to air pollutants are calculated based on the seasonal or more commonly annual average concentrations. The impact assessment was performed for January, February, March, April, and May of the years 2019 and 2020 by utilizing the AirQ + 2.0 software. AirQ + is a software developed by the WHO for quantifying the health burden associated with exposure to air pollutants. This software has been widely used and suggested as a reliable tool for this purpose (Al-Hemoud et al., Reference Al-Hemoud, Gasana, Al-Dabbous, Al-Shatti and Al-Khayat2018). In addition to health impacts associated with the long-term and short-term exposure to ambient air pollution, it can be used for household air pollution as well as risk analysis (Amoatey et al., Reference Amoatey, Sicard, De Marco and Khaniabadi2020; WHO, 2019). Table 1 lists the details of the studied cities for the impact assessment of the AQIs in this article.
The studied cities for the impact assessment of the AQIs

Relative risk (RR) is an influential factor in evaluating the health effects of air pollutants and principally represents the probability of experiencing negative health impacts that occur due to a higher level of air pollution (Amoatey et al., Reference Amoatey, Sicard, De Marco and Khaniabadi2020; WHO, 2016). In other words, RR is the ratio of the probability of the event when exposed to air pollution to the probability of the event when not exposed to air pollution (Kermani et al., Reference Kermani, Goudarzi, Shahsavani, Dowlati, Asl, Karimzadeh and Tabibi2018). The AirQ + suggests RR values based on defined formulas or ranges of values available from studies and meta-analysis for concentrations below 40 μg/m3 (WHO, 2019). In this study and for the PM2.5, RR was set to 1.062 (with the lower level of 1.04 and upper level of 1.083) and for NO2 to 1.041 (with the lower level of 1.019 and upper level of 1.064) based on the recommended value by the software and meta-analyses of relevant studies.
The cut-off value is another influential factor in the impact assessment of AQIs that represents the value below which the health impacts are not quantified. For the long-term impact assessment, the WHO recommends a cut-off value of 10 μg/m3 for PM2.5 and 20 μg/m3 for NO2, these values were therefore selected in this study (WHO, 2019). A sensitivity analysis using alternative counterfactual values was carried out to assess the impact of cut-off values on the health endpoints. This was performed by considering lower values (7.5 μg/m3 for PM2.5 and 15 μg/m3 for NO2) and higher values (12.5 μg/m3 for PM2.5 and 25 μg/m3 for NO2). Additionally, the reduced number of attributable cases in 2020 compared with 2019 for PM2.5 and NO2 exposures in all of the studied cities were assessed.
Attributable proportion (AP) is the fraction of the health consequences in a public exposed to a specific air pollutant and is calculated using Eq. (1).
 $$AP = \displaystyle{{\sum \lcub {\lsqb {RR\lpar c \rpar -1} \rsqb \;\times p\lpar c \rpar } \rcub } \over {\sum \lsqb {RR\lpar c \rpar \times p\lpar c \rpar } \rsqb }}$$
(WHO, 2019)
where RR (c) is the relative risk of the health outcome in category c of exposure and p(c) is the proportion of the population in that category. By calculating the AP and knowing the baseline frequency of the health endpoint, the number of attributable cases can be estimated as well (WHO, 2019).
In this study and for the health endpoint, the mortality due to all-natural causes affecting the whole population is considered for the NO2 exposure, and the mortality due to all-natural causes affecting the adults aged 30 years and above is considered for the PM2.5 exposure. These values were calculated based on the available national data for the population and death of different age groups provided by the WHO (WHO, 2020). These health endpoints were measured by the estimated AP attributable cases as well as attributable cases per 100,000 population at risk. While the AP reflects the percentage of total all-cause deaths that are attributed to the AQI exposure (for PM2.5 or NO2), the number of attributable cases (total or per 100,000 population) depends on the studied city.
3. Results and discussion
3.1 Electricity production
3.1.1 Colombia
The electricity production in Colombia during the first two months (January and February) of 2020 increased in comparison to 2019; however, the electricity generation reduced, as the lockdown measures were implemented (end of March). The generation of electricity in Colombia between January and May of 2019 and 2020 is summarized in Table 2. Despite the high contribution of renewables in the total installed capacity of Colombia, fossil fuels had a strong influence in May, where the use of hard coal and natural gas almost doubled, whereas hydropower generation reduced up to 30% (see Table 2). Similarly, the contribution of renewables (especially wind) reduced; although, the generation of electricity from solar panels increased compared to the previous year (2019).
Comparison of the electricity generation (GWh) in Colombia in the first five months of 2019 and 2020 (XM S.A. E.S.P, 2020).

There is no evidence that the COVID-19 lockdown measure implemented by Colombia has reduced GHG emissions in comparison to 2019. In contrast, the increasing use of coal and natural gas (instead of hydropower) to produce electricity has increased the GHG emissions up to 40%, as shown in the comparison between April and May of 2019 and 2020 in Figure 10.
GHG emissions of the electricity generation in Colombia in the first five months of 2019 and 2020. Black dots refer to the electricity generation in 2019 and black crosses refer to the electricity generation in 2020.

3.1.2 France
The electricity generation during the lockdown period decreased in comparison to the same period in 2019, as summarized in Table 3. The main sources of electricity were nuclear and hydropower accounting for 85% (on average) of the total generation during the lockdown period.
Comparison of the electricity generation (GWh) in France in the first five months of 2019 and 2020 (European Network of Transmission System Operators for Electricity (ENTSOE), 2020a).

France experienced a big reduction in GHG emissions from electricity production during the COVID-19 lockdown due to the decrease in electricity generation and the high contribution of nuclear power to the total installed capacity, as shown in Figure 11. Even though natural gas only accounts for 9% of the total installed capacity, it contributes on average 70% of the total GHG emissions, except April and May 2020 that account for 42% and 60%, respectively. Overall, there is a strong trend in the decrease of GHG emissions due to lower electricity generation during the lockdown months (April and May), with the largest decrease in electricity generation from natural gas and hydropower. Although France started the lockdown in mid-March, the GHG emissions during this month were higher than the same period in 2019. This is explained by the higher use of natural gas and the reduction of nuclear power during March 2020 in comparison to 2019.
GHG emissions of the electricity generation in France in the first five months of 2019 and 2020. Black dots refer to the electricity generation in 2019 and black crosses refer to the electricity generation in 2020.

3.1.3 The Netherlands
The generation of electricity in the Netherlands relies on fossil-based sources (e.g. natural gas, coal, and other non-renewables), despite the high share of renewables (e.g. solar and wind) in the energy matrix, as summarized in Table 4. Overall, the generation of electricity decreased during the strict lockdown measures (March−April) compared with the previous months (January and February), with the largest decrease in the electricity generation from hard coal.
Comparison of the electricity generation (GWh) in the Netherlands in the first five months of 2019 and 2020 (European Network of Transmission System Operators for Electricity (ENTSOE), 2020a).

The GHG emissions slightly decreased in the selected months of 2020 due to the reduction in electricity generation during the lockdown, as shown in Figure 12. Although, the GHG emissions and the generation of electricity increased in January 2020 due to the use of hard coal and cogeneration to produce extra energy. Since there was no significant reduction in the electricity generation and the contribution of renewables (wind and solar) also decreased, the GHG emissions during the COVID-19 lockdown in the Netherlands did not have a big change in comparison to 2019 due to the high dependency on fossil fuels (e.g. natural gas and hard coal).
GHG emissions of the electricity generation in the Netherlands during the first five months of 2019 and 2020. Black dots refer to the electricity generation in 2019 and black crosses refer to the electricity generation in 2020.

3.1.4 Portugal
In line with other European countries, electricity production during the lockdown decreased in Portugal, as summarized in Table 5. The use of biomass increased in 2020 for all of the five studied months, while coal as an energy source reached zero as part of the EU commitment to phase out coal from the energy matrix of its members.
Comparison of the electricity generation (GWh) in Portugal in the first five months of 2019 and 2020 (European Network of Transmission System Operators for Electricity (ENTSOE), 2020a).

The GHG emissions from the electricity generation in Portugal decreased in April and May, as presented in Figure 13. On the one hand, there is a clear effort from Portugal to phase-out coal in 2020 and this is reflected in the lower GHG emissions per MJ of production in 2020 in comparison with the previous year. On the other hand, the generation of electricity reduced considerably in 2020 when compared with the previous year for the same months.
GHG emissions of the electricity generation in Portugal during the first five months of 2019 and 2020. Black dots refer to the electricity generation in 2019 and black crosses refer to the electricity generation in 2020.

3.2 Air quality indicators
The results of the assessment of the concentrations of different AQIs in the cities Bogotá (Colombia), Lille (France), Lisbon (Portugal), and Utrecht (the Netherlands) are illustrated in Figures 14–17, respectively.
Concentrations of the AQIs in the city of Bogotá (Colombia) in the first five months of 2019 and 2020.

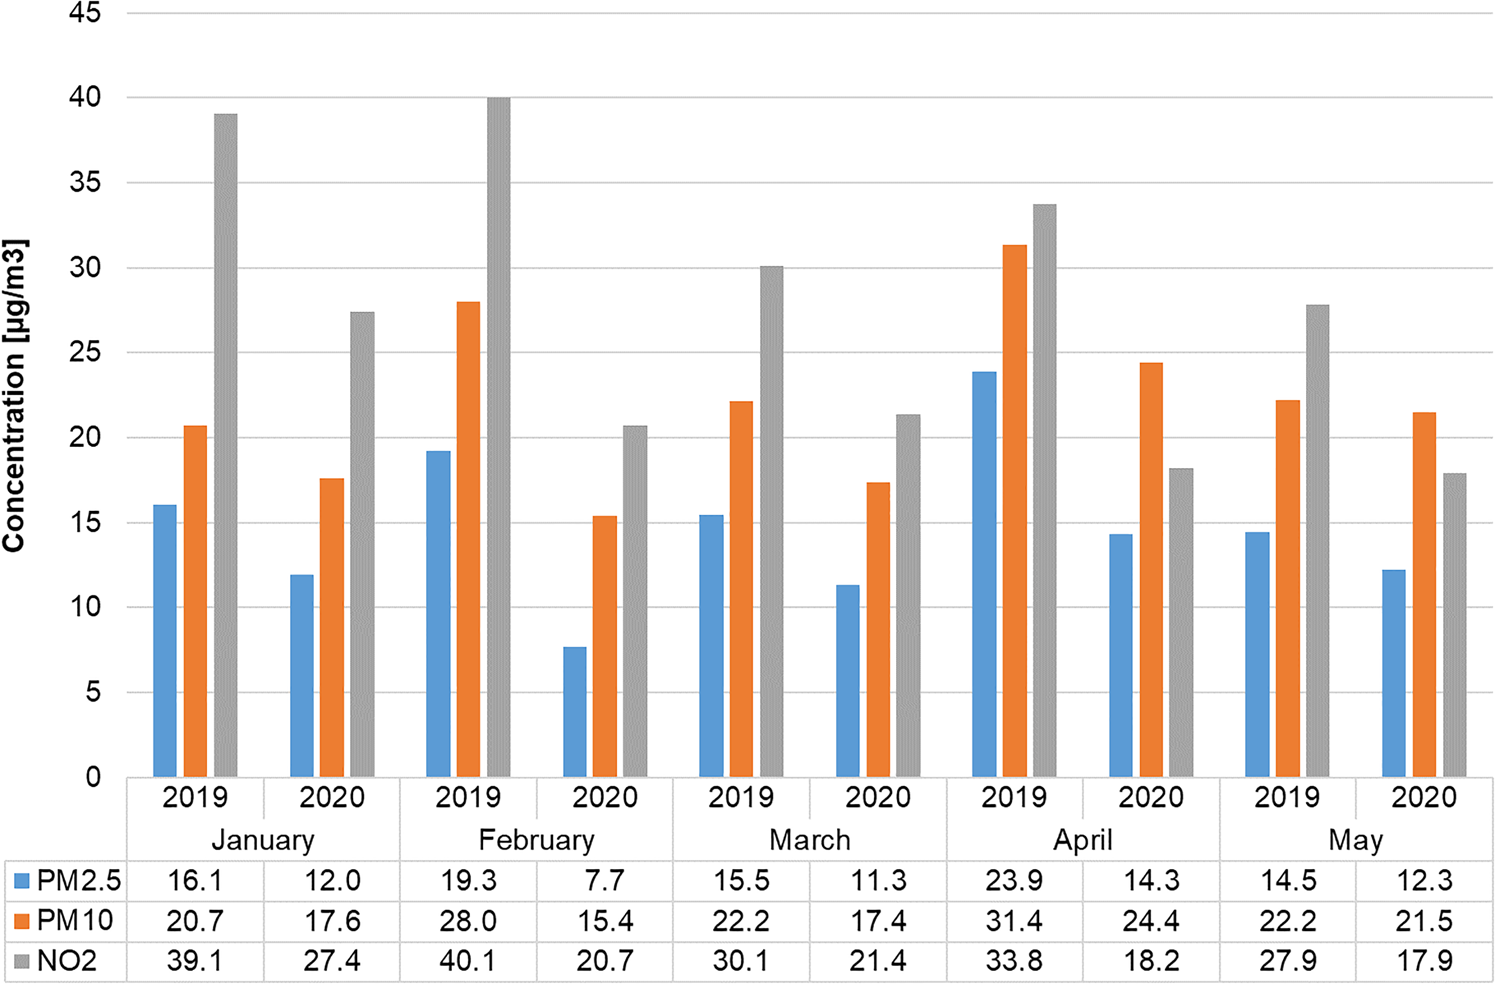
Concentrations of the AQIs in the city of Lille (France) in the first five months of 2019 and 2020.
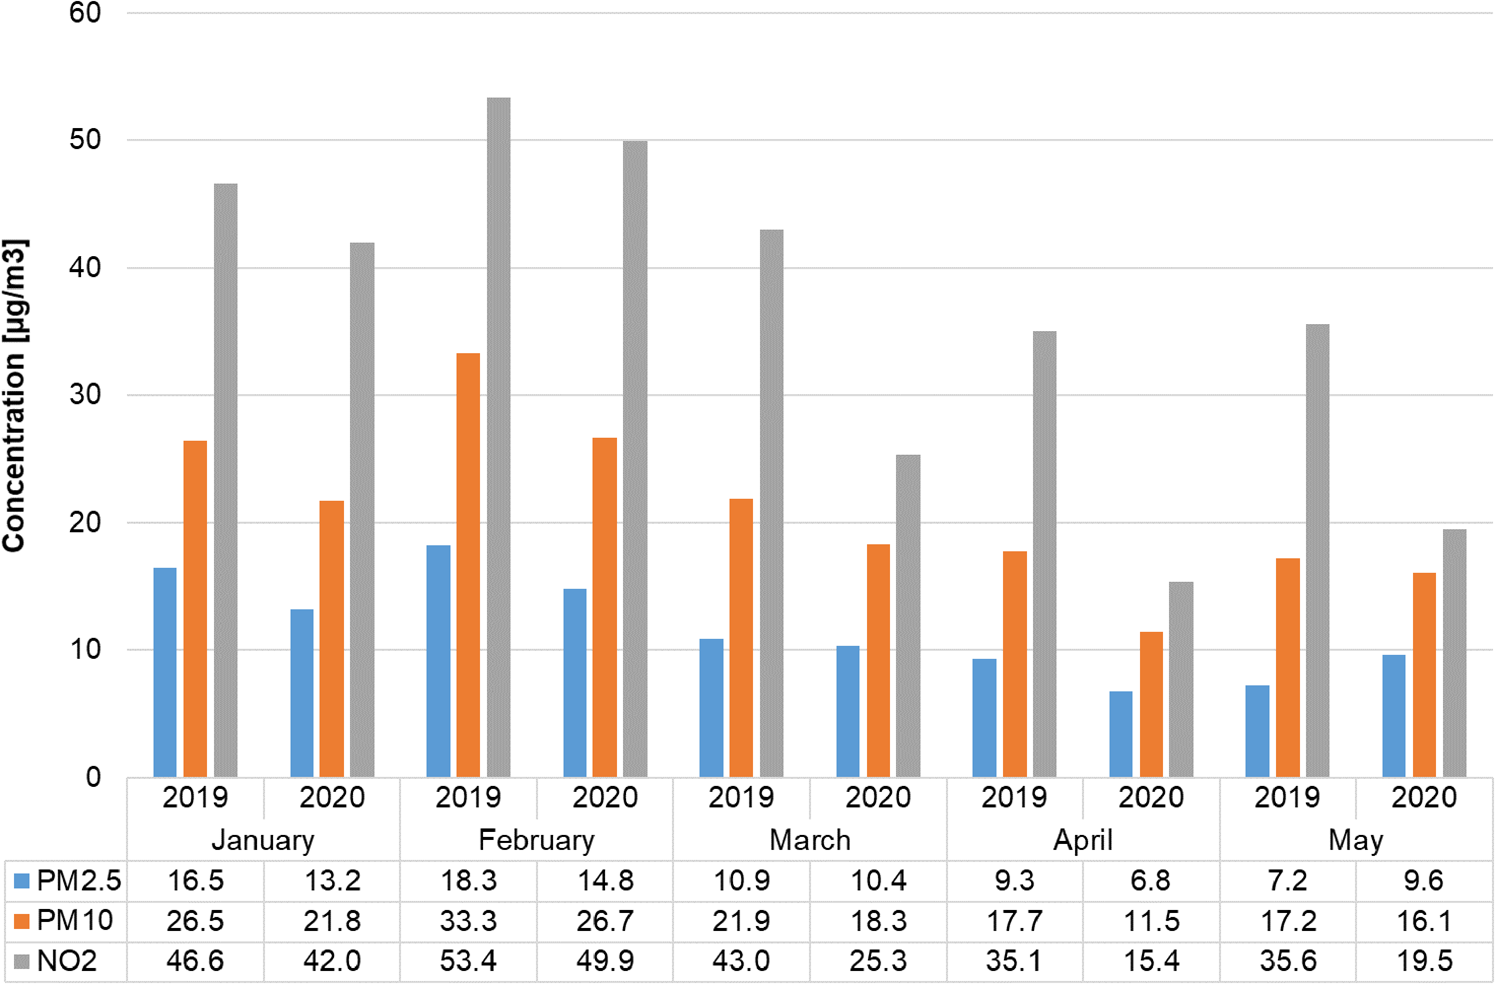
Concentrations of the AQIs in the city of Lisbon (Portugal) in the first five months of 2019 and 2020.

Concentrations of the AQIs in the city of Utrecht (the Netherlands) in the first five months of 2019 and 2020.

The results highlight a reduction in the average concentrations of all measured AQIs during the first 5 months of 2020, compared with the year 2019 for all of the studied cities. However, in the monthly comparison, i.e. comparing the same month in different years, the case studies showed different behaviors. In the case of Lille, all AQIs showed a reduction in all of the studied months in comparison with 2019. There is also a reduction in Utrecht and Lisbon in the first four months for all AQIs, but PM concentrations are slightly increased in May 2020, which can be linked with the termination of lockdown and the relaxation of measures. It should be noted that while there is an increase from April 2020 to May 2020 in PM concentrations of Lisbon, the PM concentrations are still lower than when the lockdown started (March 2020). Similarly, there is an increase in PM concentrations of Utrecht in May 2020 insofar as it exceeds the value in May 2019. Bogotá showed the most drastic reduction in the PM concentrations as the values are halved in April 2020 in comparison with March 2020.
Table 6 shows the results of the impact assessment and the calculated health endpoints for the PM2.5 and NO2 exposures in the studied cities.
Human health endpoints for the PM2.5 and NO2 exposures in the studied cities
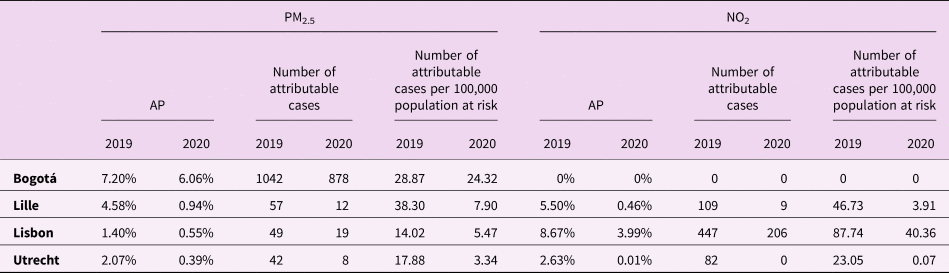
In line with the results of the concentrations of AQIs, there is a reduction in all of the calculated measures in all the studied cities in the year 2020, compared with the year 2019. While the number of attributable cases and the resulting number of attributable cases per 100,000 population at risk depend on the baseline incidence (mortality values), the AP reflects the percentage of total all-cause deaths due to PM2.5 or NO2 exposures and can be assessed between cities. Observing the AP values, the highest reduction is for the city of Lille for both PM2.5 and NO2 exposures.
The results highlight the significance of cut-off values as the measured health endpoints are based on the concentration above 10 μg/m3 for PM2.5 and 20 μg/m3 for NO2. Consequently, the calculated health endpoints are close to zero for some cases, such as the NO2 exposure in Bogotá or PM2.5 exposure in the European cities in the year 2020. It can also be observed that PM2.5 exposure has higher health impacts than NO2 exposure in Bogotá while NO2 exposure is more substantial in the studied European cities.
Figure 18 illustrates the results of the sensitivity analysis assessing the impact of different cut-off values on the reduced number of attributable cases in 2020, compared with 2019 for PM2.5 and NO2 exposures in all of the studied cities. This sensitivity analysis points out that even though alterations in cut-off values affect the health endpoints, the reduced numbers of the calculated health endpoint (the number of attributable cases in this study) are quite compatible unless the cut-off values exceed the concentrations of AQIs. It should be noted that in addition to the cut-off value, the impact assessment of air pollutants is associated with uncertainties due to assumptions and simplifications, dependency on epidemiological studies in developed countries, and exclusion of multiple exposure cases or multipollutant scenarios.
The impact of cut-off values on the reduced number of attributable cases in 2020, compared with 2019.

3.3 Comparison and discussion
3.3.1 Energy production and GHG emissions
In the Netherlands, lockdown measures were alleviated in May 2020 and GHG emissions of the electricity production had a reduction in March and April 2020 (in comparison to 2019) but then they increased in May 2020. In this sense, it could be argued that the GHG emission reduction might go back to previous or higher levels if governments do not see this pandemic as an opportunity to promote the use of renewable energies, which are becoming cheaper than non-renewables (Eckhouse, Reference Eckhouse2020). This offset is addressed as a ‘rebound effect’ in energy economics and refers to the situation where a saving in energy is (over-)compensated by behavioral or systemic responses. Although the original use of this term was for energy efficiency, its application has been extended to other disciplines such as psychology, sociology, and industrial ecology (Ruzzenenti et al., Reference Ruzzenenti, Font Vivanco, Galvin, Sorrell, Wagner and Walnum2019).
It was hypothesized that the reduction of electricity production should not be neglected since fewer resources would be used, especially non-renewable resources such as coal, natural gas, and oil. From our results, it can be concluded that this behavior is evidenced in some countries (France and Portugal) but it is not clear in the case of Colombia and the Netherlands. Portugal is a great example of how sustainable energy policies and COVID-19 could influence GHG emissions from electricity production. Portugal's plan to phase-out coal from its energy production mix (Simon, Reference Simon2020) and the strict lockdown measures due to COVID-19 (Deutsche Welle (DW), 2020a) resulted in relatively low GHG emissions per MJ. On the other hand, it can be observed that COVID-19 had no positive effect on the reduction of GHG emissions from electricity production in Colombia. This shows how the production of electricity of the country is more reliant on non-renewable sources such as coal and natural gas, while hydropower (with a big share of the total installed capacity) is not prioritized (López-Suárez, Reference López-Suárez2020).
3.3.2 Air quality indicators
The evaluation of the AQIs pointed out a positive impact of the COVID-19 pandemic on reducing the air pollutants in all of the case studies while considering the 5-month study period. The monthly comparison pointed out notable reductions of all AQIs in all studied months of 2020 in Lille (France) while Lisbon (Portugal) and Utrecht (the Netherlands) experienced a ‘rebound effect’ in May. In the case of Bogotá (Colombia), the drop in AQIs occurred later (April instead of March), but with a more drastic reduction. The results also showed that the changes in the concentrations of PM2.5 and PM10 between the studied two years are mostly compatible. Following the compatibility of the concentrations of PM2.5 and PM10, there are regional and country-specific conversion factors for converting these concentrations to each other recommended by WHO and provided by AirQ + . On the other hand, the results of this study did not show a correlation between the concentrations of PMs and NO2. This can be explained by the short period of study and having different case studies in different countries.
The health impact assessment of the results also showed the highest reduction in the number of deaths per 100,000 population in Lille (France) with 30.40, followed by Utrecht (the Netherlands) with 14.54, Lisbon (Portugal) with 8.55 and Bogotá (Colombia) with 4.55. It should be noted that the magnitude of the influence does not necessarily represent the effectiveness of the relevant country during the pandemic as the value also depends on the density of the affected population in the studied area. The AQIs are principally measured in several monitoring stations representing a limited area with a certain affected population and cannot be generalized to the whole country as normally evaluated for energy systems. Nevertheless, influential factors such as policy measures and population behavior affect the results as well. The results of the health impact assessment also pointed out the significance of cut-off values especially in cases where the air quality indicators are within the recommended range by WHO such as Bogotá (Colombia). Nevertheless, the sensitivity analysis showed that in a comparative study with the same cut-off values for both years, the value for the reduced number of health endpoints (the number of attributable cases) are less influential while it is within a reasonable range.
3.3.3 Comparison of results
Since the emergence of the COVID-19 pandemic, there have been numerous articles discussing its potential benefits for our planet. While instant reductions in the levels of energy demand, energy production, and air pollutants around the world are beneficial for a sustainable future, understanding the potential long-term effects of this pandemic requires a proper assessment of the influential decisions taken by both governments and citizens. The assessment of the emissions from the energy production together with the air pollutants in this study showed that lower energy demand and less anthropogenic activities by the citizens do not necessarily result in having lower GHG emissions from the energy production of that country. Furthermore, they highlighted a need for revisiting the policies and decisions by both governments and citizens as the temporary reductions in the levels of energy demand and air pollutants can easily be compensated with adverse effects, known as ‘rebound effect.’ The results of a recent study (Wu et al., Reference Wu, Nethery, Sabath, Braun and Dominici2020) at Harvard University showed that an increase of only 1 μg/m3 in PM2.5 is associated with an 8% increase in the COVID-19 death rate. This highlights the importance of evaluating the AQIs and the consequent health impacts, as performed in this study, in implementing policies and measures for controlling such pandemics.
3.3.4 Limitations of this study
Regarding the GHG emissions calculation, one of the limitations was the use of global scale characterization factors included in the IMPACT World + assessment method. Regarding the air quality indicators, the selection of the cities in each country was influenced by the availability of data. Moreover, the health impact assessment in AirQ + software was associated with uncertainties due to assumptions and simplifications, dependency on epidemiological studies in developed countries, and the exclusion of multiple exposure cases or multipollutant scenarios.
4. Conclusions
COVID-19 has been a transitional and geographical pandemic that started in China and then spread across the world. At the beginning of the COVID-19 pandemic, the extreme lockdown announced by China was a catapult of lots of articles in newspapers and scientific journals about the impact of the quarantine in China in the environment, specifically in topics such as climate change (Le Quéré et al., Reference Le Quéré, Jackson, Jones, Smith, Abernethy, Andrew and Peters2020) and air quality (He et al., Reference He, Pan and Tanaka2020). As the time passed and more countries started implementing strong lockdown measures, the focus shifted to (potential) adverse effects of COVID-19 on the environment due to the ‘rebound effect’ when countries started to alleviate the restrictions and industries opened their doors (Deutsche Welle (DW), 2020b; Wright, Reference Wright2020). This behavior is present in the results from the production of electricity where a GHG emission reduction ‘rebound effect’ is observed during the lockdown period. This study adds to the discussion on the influence of COVID-19 on climate change and human health; however, it is too soon to conclude about the real impact of this pandemic on the GHG emissions of the electricity production. Further data collection and calculation of GHG emissions should be conducted for evaluating the impact of second or third waves in future studies. It might be also interesting to include other sectors, such as transportation in these studies.
In our study, the production of electricity in four different countries was analyzed during the first five months of 2020 and compared with values from 2019. The assessment of AQIs and the consequent health impacts also highlighted the highest reduction of 30.4 deaths per 100,000 population in Lille (France) due to the improvements in the air quality. Such assessments can be decisively helpful for governments in implementing policies and measures for controlling the COVID-19 pandemic.
Acknowledgment
The authors thank the reviewers for their constructive feedback.
Author contributions
All authors contributed to the conceptualization, study design, and data collection; Pouya performed the assessment for the AQIs and Carlos for the GHG emissions; Pouya, Carlos and Perine, with the support of Yvonne, conducted the investigation and wrote the original draft; all authors reviewed and edited the article; Yvonne supervised and led the funding acquisition for the project.
Financial support
This research received funding from the EU Horizon 2020 program under the Marie Sklodowska-Curie Grant Agreement No. 764713, ITN Project FibreNet; and from the INTERREG V program Flanders-Netherlands (Puur Natuur: 100% Biobased), the cross-border collaboration program financially supported by the European fund for regional development.
Conflict of interest
The authors declare no conflict of interest.
Ethical standards
This research and article complies with Global Sustainability's publishing ethics guidelines.
Research transparency and reproducibility
The authors comply with Global Sustainability's policy for supporting research transparency and reproducibility.


 Open access