


Introduction
The ability of interest organizations to mobilize different social and economic interests and communicate these to the government through lobbying is an integral part of the policy process (cf. Truman, Reference Truman1951). Routine exchanges between interest groups and policymakers, however, often experience different forms of disruption. Lobby organizations faced with external threats, caused, for example, by a crisis or a more concentrated event like a shock to a specific sector, need to decide whether and how to continue their lobbying effort.
We suggest that, similar to physiological responses to a stress situation (Cannon, Reference Cannon1939), organizational responses to threats in the lobbying context can usefully be understood as fight or flight responses: organizations may scale up their lobbying to counter the threat or try to evade it by pausing or diverting their activities. Aggregate patterns in these organizational threat responses are important because they affect whether and how different interests are politically represented. An emphasis on such dynamic responses to changes in the lobbying context also helps us understand some of the foundational but so far under‐researched, causal relationships in lobbying (Maloney et al., Reference Maloney, Jordan and Andrew1994).
In particular, this article focuses on supply‐side threats that compromise the immediate interests of an interest organization as well as demand‐side threats that restrict its ability to interact with government institutions. We provide novel causal evidence about how these two types of threats potentially trigger or constrain interest group activities. The first mechanism we test relates to ‘disturbances’ to the members, causes or constituents of an organization. External events, such as natural catastrophes and economic downturns, produce disturbances for interest group constituencies that, according to seminal theories, trigger organizations into lobbying (Truman, Reference Truman1951). The second mechanism concerns the consultation practices of political gatekeepers. Situations where policymakers impose barriers to consultation, deny access to certain interest groups or divert legislative energy to more salient policy issues at the expense of less salient ones, are examples of such demand‐side‐driven threats. These can cause interest groups to be marginalized in policy battles and, according to theories that see lobbying as demand‐driven (e.g., Broscheid & Coen, Reference Broscheid and Coen2007; Leech et al., Reference Leech, Baumgartner, La Pira and Semanko2005), they might lead organizations to cease their activities.
In this article, we put these perspectives on the reactions of interest organizations to such changes in the lobbying context to a test, expecting that policy disturbances and access barriers will produce different response patterns in interest group activities. Specifically, we expect disturbances at the supply side to lead groups to fight responses (which entail a scaling up or intensifying of lobbying activities in several venues), whereas we expect access barriers at the demand side to drive groups into flight (indicating a scaling down, pause or shift of lobbying efforts). We use the fight and flight labels as shorthand for these threat responses, because, similar to the physiological processes triggered by the sympathetic nervous system in a stress situation (cf. Cannon, Reference Cannon1939), they reflect the need to balance aims such as (organizational) survival and the efficient use of (lobbying) resources in a situation of urgency and uncertainty. Fight and flight should therefore be understood as modes of action that follow different response logics of defence or withdrawal and transcend the typical dichotomy between inside and outside strategies.
Empirically, we test these mechanisms in a pre‐registered cross‐country survey experiment. We were able to conduct this experiment because the high uncertainty connected to the spread of COVID‐19 in 2020 provided a very realistic setting for different scenarios in which interest organizations suddenly saw their ability to access policymaking undermined as well as their interests severely compromised (cf. Crepaz et al., Reference Crepaz, Junk, Hanegraaff and Berkhout2022; Eady & Rasmussen, Reference Eady and Rasmussen2022; Fraussen et al., Reference Fraussen, Albareda, Braun, Muller and Sullivan2020; Junk et al., Reference Junk, Crepaz, Hanegraaff, Berkhout and Aizenberg2022). We treat the case of COVID‐19 as an extreme case, likely to produce a magnified perception of threats, which allows us to evaluate an organization's intention to respond to them in detail.
In this context, we conducted a large‐scale 2×2 survey experiment with 1,400 politically active interest organizations in 10 polities (Austria, Denmark, France, Germany, Ireland, Italy, the Netherlands, Sweden, United Kingdom, and the EU level). Our treatments were designed to test how lobbying activities are affected when organizations face mild as opposed to extreme access restrictions at the demand side (severity of access barrier in the contacts with policymakers), and when they see their interests threatened for shorter or longer periods at the supply side (level of disturbance to the organization's interests).
In line with our theory, our findings indicate that more severe disturbances drive organizations into fight mode (i.e., using more resources on lobbying efforts, intensifying media strategies, and employing protest strategies). Conversely, our results suggest that interest groups that face extreme access barriers choose flight (suspension of activity) over fight (escalation of lobbying activity). At the same time, our analyses highlight the complexity of decisions about venue shifts and the radicalization of lobbying strategies, given that both treatments resulted in higher levels of reported protest activities.
Our findings are relevant for scholars of interest representation and public policy interested in how organizations adjust to challenges in their external context. Normatively, the findings give both reasons for relief and concern: On the one hand, it is encouraging to see that groups in our survey experiment were willing to invest in lobbying and persist in their advocacy efforts in the scenario which saw their interests severely threatened during the pandemic. On the other hand, it is concerning that extreme access barriers inhibiting contact between interest groups and policymakers triggered a higher reported likelihood for organizations to put their political work on hold. Outside of experimental scenarios, this may suggest that while interest groups are able to adapt to disturbances, in their opinion, there is little they can do if their political work faces a closed door.
Theory: Demand‐ and supply‐driven perspectives on lobbying activities
Important strands of the interest group literature focus on the strategies (e.g., Dür & Mateo, Reference Dür and Mateo2016; Hanegraaff et al., Reference Hanegraaff, Beyers and De Bruycker2016; Kollman, Reference Kollman1998) and potentially resulting access (e.g., Binderkrantz et al., Reference Binderkrantz, Christiansen and Pedersen2015; Eising, Reference Eising2007; Fraussen & Beyers, Reference Fraussen and Beyers2016) of interest organizations in the policy process. Although studies of access often acknowledge that it is a product of the behavior of interest organizations (seeking access) and of gatekeepers (granting access) (cf. Binderkrantz & Pedersen, Reference Binderkrantz and Pedersen2017), we still know too little about how strategy choice and access are causally related, and how groups adapt their strategies based on the lobbying context.
In this article, we argue that interest group activities are responsive to both access opportunities as well as disturbances that impact organizational goals. When external threats arise in these respects, we reason that organizational responses can be understood in terms of a fight or flight mode, depending on whether the threat is located at the supply or demand side of lobbying. In the next section, we outline how these arguments build on seminal interest group theories and present our fight and flight model. Next, we formulate hypotheses about responses to threats at the demand side (access barriers) and supply side (disturbances).
Fight and flight responses by interest organizations
A central discussion in the interest group literature is the question of whether or to what degree interest groups have an active choice regarding strategy selection. Maloney et al. (Reference Maloney, Jordan and Andrew1994, p. 34) argue that strategy ‘is to a large extent determined by the nature of the policy demand’. Similarly, a number of studies at the macro‐level of interest group (sub‐)systems have described the activities of interest organizations as driven by political demand (e.g., Baumgartner et al., Reference Baumgartner, Larsen‐Price, Leech and Rutledge2011; Broscheid & Coen, Reference Broscheid and Coen2007; Leech et al., Reference Leech, Baumgartner, La Pira and Semanko2005), following the ‘energy’ of legislative or bureaucratic activity (e.g., Gray et al., Reference Gray, Lowery, Fellowes and Anderson2005), which can result in ‘bandwagonning’ on some issues (Baumgartner & Leech, Reference Baumgartner and Leech2001; Halpin, Reference Halpin2011). At the micro‐level of individual organizations, this should entail that the activities of interest organizations are responsive to changes in the behavior of gatekeepers (cf. Binderkrantz & Pedersen, Reference Binderkrantz and Pedersen2017): when facing a lack of political demand and access opportunities, organizations would be expected to decrease their activities in order to save resources and/or re‐focus them on more promising causes. We see such situations where access is severely restricted for an interest group as an external threat at the demand side of lobbying and expect responses to follow demand by withdrawing from lobbying activity vis‐à‐vis the gatekeeper.
A potential complement to this demand‐driven view of interest group activities is Truman's (Reference Truman1951) disturbance theory on interest representation, which takes a supply‐side perspective on interest group activities. Specifically, this perspective stresses disturbances to organizations’ interests as a vital driver of mobilization. Group mobilization should here depend on the size and nature of a ‘disturbance’ to a group's interests (Truman, Reference Truman1951), say the severity of a political problem that affects an organization's goals or its members. We see these disturbances as external threats at the supply side of lobbying. As also formulated in the political economy literature (Drutman, Reference Drutman2015; Hansen, Reference Hansen1985), we expect organizations to push back in response to such situations threatening their interests. Potential explanations for such behavior are threefold. First, a concrete disturbance to an organization's interests may make the benefits of mobilizing more salient and imminent and might thereby help to overcome collective action problems (cf. Olson, Reference Olson1965). Second, when organizations face an immediate threat to their core interests, they are more likely to engage in ‘risk‐seeking’ behavior (Hansen, Reference Hansen1985, p. 81). Lastly, loss aversion (Tversky & Kahneman, Reference Tversky and Kahneman1991) makes it plausible that lobbying activities might largely be reactive to threats to organizations’ interests (expected losses).
We summarize both these strands of arguments about the drivers of lobbying activities in what we call a fight or flight model of lobbying responses to arising threats in the lobbying context. We use these terms as shorthand for the strategic choices interest groups make when faced with external threats: they can intensify their activity in defence of the threat or withdraw from the threat by decreasing and/or diverting lobbying activities. The fight and flight dichotomy, therefore, does not overlap neatly with the typical inside/outside dichotomy. Organizations can fight by increasing lobbying activities in both inside and outside venues. Moreover, flight can entail either a full decrease of all lobbying activity or a diversion of resources, for instance from inside to outside venues. Essentially, the two modes of threat responses hence reflect how organizations cope with the trade‐offs between organizational goals and resource investments in urgent situations. While the fight response entails an increase in the use of resources (in several venues), the flight response entails a decrease and potential shift of resources between venues.
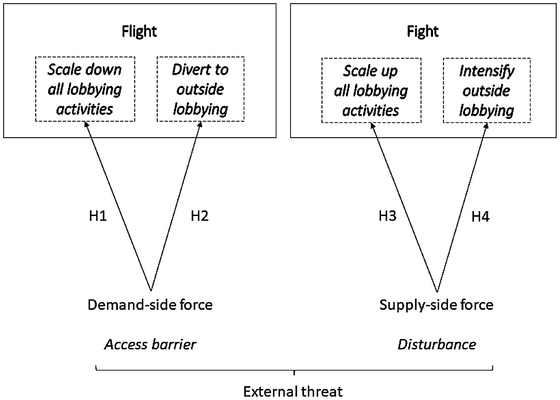
Figure 1 summarizes our fight or flight model. It shows that, based on the seminal theories summarized above, we expect disturbances (i.e., supply‐side challenges) to lead to fight responses, whereas access barriers (i.e., demand‐side challenges) trigger flight responses. As Figure 1 displays, we expect these threat responses to translate to different patterns in interest group activities, reflecting decisions to invest more resources in inside and outside lobbying activities (scaling up) or putting political work on hold (scaling down).
Expected effects of supply‐ and demand‐side forces on interest group activities.

Given, the potential role of outside strategies as alternative activities when organizations lack inside access or want to raise the salience of their concerns (Kollman, Reference Kollman1998), we also include the response in the outside venue separately (divert to/intensify outside lobbying). This means that we see the specific use of outside lobbying, such as media strategies or protest, as compatible with both a fight and flight response. Their status as a ‘fight’ or ‘flight’ response depends on whether media campaigns are used to intensify activity, that is, expanding lobbying activity in another venue (a fight response), or whether an interest group walks away from direct lobbying in exchange with policymakers and diverts its attention to the media venue or protest action (a flight response). In the next sections, we explain a set of hypotheses (H1–H4) formulated based on this framework.
Demand‐driven lobbying: ‘Flight’ in response to access barriers
First, we argue that access barriers trigger a scaling down of lobbying. Following the discussion by Maloney et al. (Reference Maloney, Jordan and Andrew1994), we expect the strategies of interest organizations to follow access provision by gatekeepers: Facing a closed door, interest organizations would not waste resources but wait for demand to arise again. This expectation goes hand‐in‐hand with a view of lobbying as ‘legislative subsidy’ (Hall & Deardorff, Reference Hall and Deardorff2006), where organizations lobby their friends and those with open arms, rather than going against resistance. Our first ‘flight’ hypothesis captures this reasoning, that barriers to access will trigger a decrease in lobbying activity, for example, through a decrease of resource investments in all lobbying activities or through the pausing of political work.
H.1 (Flight, scale down): Higher access barriers negatively affect the level of lobbying activity, entailing (i) lower investments of resources in lobbying and (ii) a higher propensity to pause lobbying efforts.
Second, interest organizations might try to compensate for their lack of inside access by shifting their activities to outside venues to draw public and media attention to their cause. We see this as a flight response in the form of a venue shift (cf. Holyoke, Reference Holyoke2003; Jourdain et al., Reference Jourdain, Hug and Varone2017) away from the demand‐side threat. Marshall and Bernhagen (Reference Marshall and Bernhagen2017), for instance, show that when their relationship with national authorities is under strain, firms shift their lobbying efforts to alternative (transnational) venues. We expect a similar reaction from interest organizations diverting to outside venues when facing access barriers to interactions with policymakers. This argument also relates to important discussions about whether outside lobbying, such as (social) media campaigns, can compensate as ‘weapons of the weak’ (cf. Thrall, Reference Thrall2006; Van der Graaf et al., Reference Van der Graaf, Otjes and Rasmussen2016). While now commonly seen as a ‘myth’ (Thrall, Reference Thrall2006), there is a lack of causal evidence on how the closing of an inside venue affects outside strategies. Our second ‘flight’ hypothesis tests this directly by focusing on how inside access barriers affect the choice of employing outside lobbying strategies, such as media strategies or protest. Based on our fight or flight model (Figure 1), we expect interest organizations to adjust their strategies by diverting to alternative venues when facing a demand‐side threat.
H.2 (Flight, venue‐divert): Higher access barriers positively affect the use of outside strategies entailing higher engagement in (i) media lobbying and (ii) protest activities.
Supply‐driven lobbying: ‘Fight’ in response to disturbances
To test the second part of our model, we focus on levels of disturbances (Truman, Reference Truman1951) to organizations’ interests. In line with previous literature, we see disturbances as the fuel of interest mobilization. As Lowery and Gray (Reference Lowery and Gray1995, p. 9) put it, increased numbers of polluters (here the disturbance) ‘may actually help the environmental group survive by convincing its members that work remains undone’. We see this logic as applicable to both ‘first‐’ and ‘second‐order’ mobilization, that is, group formation and the activities of interest groups once formed (Rasmussen & Gross, Reference Rasmussen and Gross2015).
Interest organizations facing a disturbance should see lobbying as worthwhile because it is backed up by a membership, whose interests are threatened by an external situation (Drutman, Reference Drutman2015; Hansen, Reference Hansen1985). The benefit of lobbying should here exceed its costs (cf. Olson, Reference Olson1965) since even if unsuccessful, interest organizations can signal to their membership that their worries were expressed (cf. Berkhout, Reference Berkhout2013). Put differently, interest groups should be more likely to engage in ‘risk‐seeking’ behavior in response to supply‐side threats (Hansen, Reference Hansen1985, p. 81) and invest additional resources. In our theoretical framework, this corresponds to a fight response, in the form of a scaling up of lobbying activity or intensification of political work. This logic is expected to apply proportionally to the size of the disturbance. When the risks of losses are great, for example, in circumstances of austerity after a financial and economic crash, then the fight response is expected to be more pronounced than in circumstances of weaker disturbances. Hypothesis 3 summarizes this expectation that more severe disturbances trigger an increase in all lobbying activity.
H.3 (Fight, scale up): More severe disturbances positively affect the level of lobbying activity entailing (i) higher investments of resources in lobbying and (ii) a lower propensity to pause lobbying efforts.
Second, we expect this general scaling up of lobbying activity to spill over to specific venues. This can take the form of intensifying media strategies especially, as these can help to draw attention to the organization's grievances, as well as signal activity to members (Kollman, Reference Kollman1998). Assessing this potential effect separately is relevant because some suggest that organizations face legitimacy risks when using outside strategies (Aizenberg & Müller, Reference Aizenberg and Müller2021; Hart, Reference Hart2004). These risks might especially be severe when organizations choose to radicalize by opting for more confrontational strategies, such as protests, strikes or boycotts (Tresch & Fischer, Reference Tresch and Fischer2015).
Both protest and media engagement, as two forms of outside strategies that vary in their level of radicalization, may here be used to try to signal salience of the group's position to policymakers and constituencies (Kollman, Reference Kollman1998). We see them both as fight responses when they intensify and potentially escalate the organization's other activities in outside venues. As summarized in Hypothesis 4, we expect this pattern in response to more severe disturbances.
H.4 (Fight, intensify): More severe disturbances positively affect the use of outside strategies entailing higher engagement in (i) media lobbying and (ii) protest activities.
These four hypotheses qualify our fight and flight model sketched in Figure 1. The next section presents the research design we employed to test these hypotheses empirically with a pre‐registered survey experiment conducted in the context of the global COVID‐19 crisis.Footnote 1
Research design: A cross‐country survey experiment in the context of the COVID‐19 pandemic
To disentangle the causal relationship between inside access barriers, disturbances and the choice of fight and flight responses, experimental research has clear advantages. Experimental settings are well‐suited to isolate causal effects by randomly assigning key variable(s) of interest.Footnote 2 Nevertheless, given the challenges involved in developing experimental designs to address key research questions in studies of interest groups, they are relatively rare in research on lobbying (exceptions are Aizenberg, Reference Aizenberg2023; Dür, Reference Dür2019; Junk & Rasmussen, Reference Junk and Rasmussen2023; Kalla & Broockman, Reference Kalla and Broockman2016; La Pira, Reference La Pira2008; Leeper, Reference Leeper2013; McEntire et al., Reference McEntire, Leiby and Krain2015; Miller, Reference Miller2022; Weber et al., Reference Weber, Dunaway and Johnson2012). It is especially rare that an experiment is employed to understand the behavior of interest organizations (but see Miller, Reference Miller2022; Aizenberg, Reference Aizenberg2023), rather than legislators (e.g., Kalla & Broockman, Reference Kalla and Broockman2016; La Pira, Reference La Pira2008) or the public (Dür, Reference Dür2019; Hartman & Weber, Reference Hartman and Weber2009; Junk & Rasmussen, Reference Junk and Rasmussen2023; Leeper, Reference Leeper2013; McEntire et al., Reference McEntire, Leiby and Krain2015). To our knowledge, our experiment is, in fact, the first survey experiment conducted across a large, cross‐country sample of interest organizations.
A potential weakness of survey experiments might, however, be that the chosen scenarios are unrealistic or far removed from the respondents’ real experiences (McDonald, Reference McDonald2019). This can result in low ecological validity (cf. Cicourel, Reference Cicourel1982) and imply that responses might only partially be able to capture trends outside the survey setting. Arguably, this danger is especially pronounced when designing a survey experiment for the interest group population, given this will include considerable diversity in terms of types of organizations and sectors. Designing survey scenarios that are credible and applicable to all of them is, therefore, very difficult but paramount.
In this regard, our research design has the advantage of being conducted during the first wave of the global COVID‐19 crisis (June/July 2020), where a number of extraordinary circumstances were in place, which affected participating organizations homogenously in at least two ways. First, given the extraordinary global salience of this pandemic, few to no organizations can be expected to have been unaffected by the pandemic, and most organizations will actively have addressed potential action plans to deal with the pandemic. Second, a high and widespread level of uncertainty was connected to the unfolding of the pandemic. In June/July 2020, when our survey was in the field, infection numbers were stabilizing in many European countries, but it was seen as likely that a second wave of the pandemic would break out in the fall. The precise form and consequences of the potential second wave, were, however, very uncertain. In this context, we argue that the scenarios presented in our survey experiment of an (at that point) hypothetical second wave of COVID‐19 in the fall of 2020 were credible and very close to the actual experiences and concerns of respondents at the time (McDonald, Reference McDonald2019). More specifically, organizations faced uncertainty about (at least) two types of ‘threats’ in different scenarios of a second wave, which we leverage in our survey experiment.
First, the duration of the next wave of lockdown measures was uncertain. We see longer (compared to shorter) lockdown policies and COVID‐related restrictions as a general threat to the core interests and activities of organizations and individuals. The global health crisis, including government restrictions introduced to stop the spread of the virus, has posed new and serious threats to the interests of various types of organizations (cf. Fraussen et al., Reference Fraussen, Albareda, Braun, Muller and Sullivan2020). The temporary suspension of business activities, schools and other public services, for instance, has negatively affected firms and members of business groups and professional associations (cf. Rasmussen, Reference Rasmussen2020). Restrictions to personal movement and the development of health and safety protocols have had major impacts on (the members of) professional associations and labor unions. Moreover, lockdown policies have made it harder to address the causes represented by NGOs and charities, such as homelessness or mental health. In addition, government restrictions have forced all organizations to adapt political advocacy and member relations to the lockdown situation (Crepaz et al., Reference Crepaz, Junk, Hanegraaff and Berkhout2022; Junk et al., Reference Junk, Berkhout, Crepaz and Hanegraaff2023). With this in mind, we focus on how the duration of COVID‐related restrictions affects the activities of interest groups. A longer duration of lockdown and restriction measures in the second wave of COVID‐19 should intensify the ‘disturbances’ to all kinds of interests since longer restrictions will be limiting and economically and/or socially damaging for basically all politically active organizations, their day‐to‐day work, their constituents or operations.Footnote 3
Second, there was uncertainty about the level of access organizations would be able to secure to policymakers in these circumstances. During the first wave of the COVID‐19 pandemic, high levels of uncertainty, social distancing rules and a state of emergency meant that normal consultation practices were disrupted, and it was harder for groups to predict what levels of access they would enjoy in the coming months (Junk et al., Reference Junk, Crepaz, Hanegraaff, Berkhout and Aizenberg2022). Because of the crisis, decision‐making powers over, for example, emergency policy were concentrated in the hands of executives (Bolleyer & Salát, Reference Bolleyer and Salát2021), reducing the number of possible access points for interest groups seeking to influence policy outputs. In this context, many interest groups faced, or feared to face, barriers when it comes to inside access to policymakers because gatekeepers were unable to facilitate access as usual in this emergency situation. With this in mind, we look at how very severe (compared to lower) access barriers affect the lobbying activities of interest groups in the survey experiment. We present our different treatment conditions in detail below after sketching the general research design.
Data and sample
Our survey experiment occurred at the end of a survey addressing interest representation during the Coronavirus crisis (InterCov project). We took a behavioral approach to the identification of interest groups (Baroni et al., Reference Baroni, Carroll, Chalmers, Marquez and Rasmussen2014) and distributed the survey to stratified samples of the interest organization population as well as large companies in 10 polities in Europe (Austria, Denmark, France, Germany, Ireland, Italy, the Netherlands, Sweden, United Kingdom, and the EU level). This set of polities was selected based on the availability of lists of interest group populations but also represents a mix of types of welfare states, interest mediation and electoral systems.
To select the interest group samples, existing lists of organizations, such as lobby registers and scholarly lists of interest group populations, were employed, as described in detail in the online Appendix A. The sample was stratified to ensure that we included comparable samples of different types of organized interests as well as in the different polities. For an overview of the sample in each polity, as well as response rates, see online Appendix B.
In total ca. 7,000 representatives from organized interests received the survey. An effort was made to target respondents who were responsible for public affairs, communication and interest representation within their respective organization. The survey was in the field from June to mid‐July in 2020 and over 1,400 organizations completed the survey to the end (response rate: 20.4 per cent). Response rates varied markedly between countries (see online Appendix B, Table B1).
In the pooled sample, we do not see considerable response bias regarding group type, as Table B2 in online Appendix B summarizes. While we cannot rule out non‐response bias, Tables B3 and B4 in the online Appendix further address the distribution of responses across (1) lobbying staff resources and (2) perceived affectedness by this crisis, both of which could impact non‐response. This means that we can test the average effect of our treatment in the sample, which includes different group types, levels of resources and affectedness by the pandemic (cf. Druckman et al., Reference Druckman, Green, Kuklinski and Lupia2011; Morton & Williams, Reference Morton and Williams2010). If we find significant average effects in this diverse set of organizations, this is strong evidence for a causal effect of our treatments on the reported behavior of interest organizations.
Attrition (drop out in the post‐treatment questions) is extremely low: under 1 per cent of those who started the survey dropped out in the questions pertaining to the experiment. Table D2 in the online Appendix gives an overview of the observations in each treatment group. To make sure randomization was successful, we check balance in our four treatment groups in Tables D2 and D3 in the online Appendix. Table D2 shows that we have similar numbers of observations (between 337 and 357) in each of the treatment conditions. The table also summarizes mean values for different relevant background characteristics. Differences between treatment categories are small, and Table D3 only finds two weakly significant effects (p < 0.1) on assignment to the treatment conditions: one for medium age and one for NGOs. These imbalances are likely to have arisen due to chance and are addressed with robustness checks, which run the analysis including covariates (online Appendix E, Tables E2 and E4). Based on the results, we do not have reason to believe that our analysis suffers from covariate imbalance and conclude that randomization was successful (Hansen & Bowers, Reference Hansen and Bowers2008).
Experimental design and stimulus material
Our survey experiment was designed to test whether difficulties in gaining insider access (access barriers) and the duration of government restrictions (level of disturbance) have an effect on the level of lobbying activity (H1, H3) and the use of outside strategies specifically (H2, H4). The study was pre‐registered at AsPredicted, and the terms and conditions for our online survey were approved by the Ethics board of Trinity College Dublin.
We used vignettes that describe different scenarios during an (at that point) hypothetical second wave of COVID‐19. These scenarios followed a 2×2 between‐subjects design, manipulating two characteristics in the situation: the level of access barriers the organization faces (access: very difficult and easy) and the duration of government restrictions during the second wave (disturbance: long and short). Participants were exposed to the same scenario but were randomly assigned to one of each of these conditions describing access barriers and the duration of the restrictions.
Specifically, respondents were instructed that a hypothetical scenario was about to be presented, and they were asked to carefully read through it and to imagine the situation as if they were actually experiencing it. The scenario described a second wave of COVID‐19 that occurred in the polity in which the organization was sampled. The vignette then continued to describe that the national government (or EU) announces to reimpose the same restrictions as were implemented nationally during the first wave of the pandemic.Footnote 4 Subsequently, the scenario presented the duration conditions by indicating either that restrictions are imposed for a period of two months (short duration of restrictions) or one year (long duration of restrictions). Moreover, the vignette described how hard it is for the organization in this situation to come into contact with politicians to express the organization's interest. Participants were either exposed to a situation where it is not particularly hard for the organization to come into contact with politicians (easy access) or where it is extremely hard (very difficult access).Footnote 5 Note that the high levels of these treatment conditions (long restrictions, very difficult access) represent severe external threats and are therefore formulated in strong terms (one‐year restrictions, extreme access barriers).
The stimulus material was pre‐tested by means of a pilot to assess it in terms of comprehensibility and credibility.Footnote 6 All surveys were conducted in the respective national language and English in the EU sample (see online Appendix C for wording). Given the baseline for the experimental setting varies somewhat between polities, we run our main analyses with fixed effects for polity.
Credibility and pre‐treatment effects
Despite being hypothetical at the time, we see these treatments as credible and very close to the actual experiences of respondents at the time (McDonald, Reference McDonald2019). In Spain, for instance, scholars report that one of the major umbrella organizations representing the elderly was surprisingly not invited to parliamentary consultations to discuss crisis measures (Fraussen et al., Reference Fraussen, Albareda, Braun, Muller and Sullivan2020). This illustrates that, even the ‘usual suspects’ that normally have a seat at the negotiation table, faced uncertainty about their future level of access during the pandemic. With respect to disturbances caused by the length of restrictions, data on the strictness of lockdown regulations show that relatively strict (but of course declining) rules were in place until almost January 2022 (Hale et al., Reference Hale, Angrist, Goldszmidt, Kira, Petherick, Phillips, Webster, Cameron‐Blake, Hallas, Majumdar and Tatlow2021). This indicates that the actual length of restrictions falls in between our two duration scenarios, which we see as ex post support for their credibility.
With this in mind, we see both treatments as applicable to interest groups operating in all nine countries under investigation. We also included the EU in our study, which did not have lockdown policies in place comparable to national ones. Respondents in this polity were asked to think of ‘restrictions as were implemented by national governments in high‐risk countries’ in the first wave. We expected EU‐level interest groups to know what severe national restrictions meant (e.g., through news consumption) and see them as threatening if introduced in a concerted effort by EU countries in a (long) second wave. Given the relatively similar trends in lockdown policies observed in European countries (Crepaz et al., Reference Crepaz, Junk, Hanegraaff and Berkhout2022; Hale et al., Reference Hale, Angrist, Goldszmidt, Kira, Petherick, Phillips, Webster, Cameron‐Blake, Hallas, Majumdar and Tatlow2021; Jahn, Reference Jahn2022) and the robustness checks in online Appendix I (in sets of countries, excluding the EU), we are confident that the inclusion of EU‐level lobbying does not distort our findings but increases the power and generalizability of the analyses.
A potential problem in our design could, however, be related to real‐world contamination: Survey participants’ responses to our treatments may have been influenced by their experiences during the pandemic, for instance, their access and level of affectedness by government restrictions. This is likely considering high salience increases the likelihood of pre‐treatment effects (Druckman & Leeper, Reference Druckman and Leeper2012). We therefore control for pre‐treatment conditions to disentangle possible dynamics related to the real‐world environment. Specifically, we reason that organizations’ pre‐treatment ability to access insider venues and the perceived disruption caused by the crisis influenced their reaction to our manipulations. To take this into account, we run additional analyses within two sub‐sets of respondents.
To account for demand‐side pre‐treatment effects, we compare organizations that self‐reported no or rare access to insider venues during COVID‐19 to those that reported frequent access to insider venues before the treatment (for details about variable construction, see Online Appendix C). To account for supply‐side pre‐treatment effects, we compare organizations that, relative to other organizations, self‐identified as more affected by the pandemic to those that identified as less or equally affected. These subsamples are constructed based on survey questions asked before the treatment was introduced. We conduct our analyses in the respective subsamples for the two treatments in addition to the full sample.
Dependent variables
After reading the vignette, respondents were asked a series of post‐treatment questions. Questions instructed respondents to indicate how likely it was for their organization in the given scenario to employ different strategies. In particular, seven questions were asked after the vignette, four of which we use as dependent variables to indicate fight or flight responses, as formulated in our pre‐registered hypotheses.
To operationalize fight and flight strategies regarding the scale of all lobbying activity (H1, H3), we use the rating of the likelihood that the organization (1) invests additional resources in political work and (2) puts its political work on hold. To operationalize fight and flight strategies in terms of outside lobbying specifically (H2, H4), we use the likelihood that the respondent's organization is rated to (3) run public and/or media campaigns, and (4) engage in protest activities. All these were assessed on a scale from 0 (not likely at all) to 10 (almost certain to happen) (see online Appendix C for full question wording). Table D1 in online Appendix D shows descriptive overviews of these dependent variables. It gives evidence for skewedness. Therefore, we conduct additional robustness tests in online Appendix G.
Results
In this section, we test the effects of our different treatments on our four dependent variables, which speak to the fight and flight responses of organizations to access barriers and disturbances. Our 2×2 factorial between‐subjects design randomly varies both independent variables, which are therefore not correlated. This allows us to look at the average effect of each characteristic individually using the low access barriers and low policy disturbances as baselines (Gerber & Green, Reference Gerber and Green2000; Brader et al., Reference Brader, Valentino and Suhay2008).Footnote 7
The next sections present the effects of access barriers and disturbances, respectively, in an ITT analysis, as well as different subset analyses. We use Ordinary Least Squares (OLS) regressions with fixed effects for polity in all models. Online Appendix H displays the results using analysis of variance (ANOVA).
Testing hypotheses 1 and 2: ‘Flight’ in response to access barriers
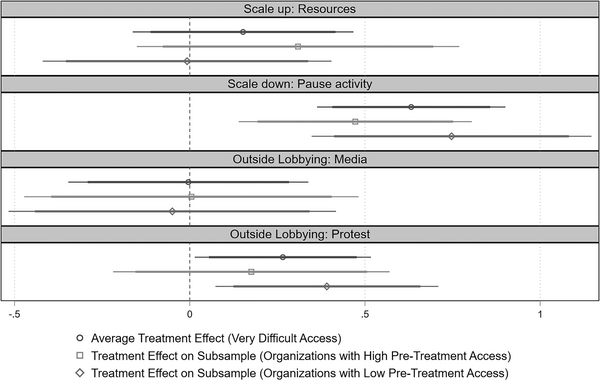
To test hypotheses H1 and H2, Figure 2 plots the coefficients comparing the scenario where it is extremely hard for the respondent's organization to come into contact with politicians to the baseline situation in which this is not particularly hard. In addition to the average treatment effect, Figure 2 plots estimations for subsets of organizations that declared to have had ‘frequent access’ (high pre‐treatment access) to inside venues since the start of the COVID‐19 pandemic, as well as organizations that declared ‘rare or no access’ (low pre‐treatment access). These subset analyses are included to account for potential pre‐treatment effects, given it is conceivable that the treatment worked differently for organizations that were already experiencing different levels of post‐pandemic access. Conversely, similar treatment effects in these sub‐samples would indicate that the scenarios were relatable for both subsets of (high/low access) organizations and had similar effects.
Coefficient plots based on analyses of the access treatment (baseline easy) on four dependent variables, fixed effects for polity included. Three sets of analyses are displayed: (1) The average treatment effect in the full sample (N = 1379, 1340, 1350, 1312), (2) subset analysis for organizations with high pre‐treatment access (N = 653, 636, 646, 630) and (3) subset analysis for organizations with low pre‐treatment access (N = 712, 691, 694; 672). Robust standard errors for pause activity, due to evidence for heteroscedasticity. Showing 95 and 90 per cent confidence intervals. Full models are displayed in Table E1 in the online Appendix

The results displayed in Figure 2 give evidence for a flight response triggered by demand‐side challenges in the lobbying environment based on two of our four outcome variables. First, the results do not suggest that higher access barriers affect the overall level of resources organizations invest in lobbying: based on this measure, organizations neither scale up nor down on their lobbying, when facing extreme access barriers. However, there is clear evidence that they are significantly more likely to scale down by putting their political work on hold (p < 0.000). This supports the flight hypothesis H1. One reason for the difference between these two measures could be that organizations divert some of the resources previously used on inside lobbying to other venues.
Hypothesis 2 speaks to this potential effect. Interestingly, we see that organizations facing extreme inside access barriers (i.e., difficulties in coming into contact with politicians) are not more likely to divert lobbying to media strategies; they are, however, more likely to use protest strategies (p = 0.038). H2 is therefore partially supported, with the qualification that flight (diversion) to outside lobbying holds only for more radical strategies. A potential explanation for this might be the strong gatekeeping role of the (mainstream) media, where organizations expect similar access barriers to apply as they face with politicians. This means that a venue shift to the media as an option for organizations that face a closed door to policymakers does not seem readily available, but that radicalization as a response to extreme access barriers seems like a more likely outcome.
Our subset analyses support and nuance these findings. When it comes to support for H1 (scaling down by putting work on hold), this holds in both subsets, with similar effect sizes and levels of significance. Regarding radicalization through protest, however, we see that this effect is significant only among organizations that have ‘actually’ been outsiders during the crisis (have low pre‐treatment access). This may indicate that existing ties to policymakers make radicalization less likely, whereas organizations that are relative outsiders in the policy process already are more likely to react to extreme access barriers with more radical forms of political activity.
Notably, the sizes of these effects in our experiment are not very large. In absolute terms, those treated with the scenario of extremely difficult access (full sample) score 0.63 points higher (on the 0–10 point scale) than organizations with easy access, which means the two groups differ by 0.25 standard deviations. The effects of extremely difficult access on the likelihood of using protest strategies lie at 0.27 (the two groups differ by 0.12 standard deviations, respectively).Footnote 8
Although the effects we find in our survey experiment are not large in size, they indicate that facing very high access restrictions has significant effects on advocacy strategies. Importantly, our findings provide novel support for the expectation that the strategies of interest organizations are responsive to access provision by gatekeepers (Maloney et al., Reference Maloney, Jordan and Andrew1994). When doors suddenly close, organizations prefer to pause activity and wait rather than investing more resources in advocacy trying to break through a closed door. Moreover, extreme access barriers make it likely that organizations use available resources to divert to more radical strategies like protest. Both responses fit with the flight responses we sketched in our theoretical framework: When facing extreme barriers to inside access, organizations scale down their lobbying and divert to radical outside strategies.Footnote 9
Testing hypotheses 3 and 4: ‘Fight’ in response to longer disturbances
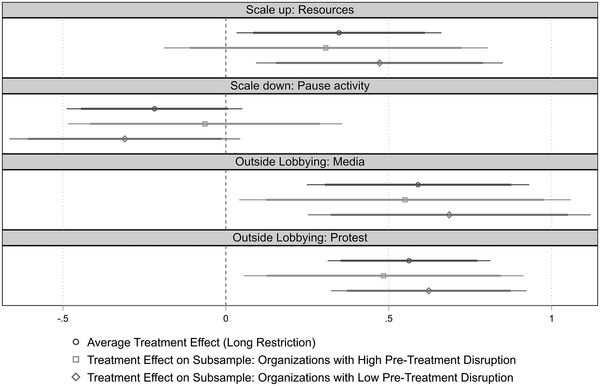
To test the effects of the severity of the ‘disturbance’, which we operationalize as shorter as opposed to longer COVID‐related restrictions, Figure 3 plots the coefficients for the long (twelve months) wave, compared to the scenario where restrictions last for a shorter period (two months). Also here, we take pre‐treatment effects into account, replicating the analysis for the subsets of respondents who perceived themselves as ‘highly affected’ (high pre‐treatment disruption) by the pandemic and those who perceived themselves as ‘less or equally affected’ (low pre‐treatment disruption).
Coefficient plots in analyses of the restriction duration treatment (baseline short) on four dependent variables, fixed effects for polity included. Three sets of analyses are displayed: (1) The average treatment effect in the full sample (N = 1379, 1340, 1350, 1312), (2) sub‐set analysis for organizations with high pre‐treatment disruption (N = 539, 521, 529, 509) and (3) subset analysis for organizations with low pre‐treatment disruption (N = 824, 804, 809, 792). Robust standard errors for protest, due to evidence for heteroscedasticity. Showing 95 and 90 per cent confidence intervals. Full models are displayed in Table E3 in the online Appendix

It is clear from Figure 3 that these disruptions to organizations’ interests at the supply side of lobbying have significant effects on lobbying activities and that these effects partly go in the opposite direction from those of access barriers (demand‐side challenges).
In support of the first fight hypothesis (H3), Figure 3 shows that longer restrictions increase the likelihood, according to the respondents’ ratings, of scaling up lobbying activities by investing additional resources (p = 0.03). In addition, it looks like respondents in the scenario where restrictions last for a year judge it as less likely to scale down by putting political work on hold, but this effect is not significant at the aggregate level (p = 0.112). It is, however, weakly significant in the subset analysis for low pre‐treatment disruption levels (p = 0.086). Together, these patterns provide strong support for Hypothesis 3 that more severe disturbances lead to an increase in the level of lobbying activities.
Furthermore, our findings strongly suggest that the longer disturbance leads to a fight reaction in terms of intensifying political activities through outside lobbying (fight hypothesis H4). Figure 3 shows that the likelihood of using both media and protest strategies increases (p = 0.001 and p < 0.000, respectively) in the scenario where respondents face the longer (compared to shorter) government restrictions.
These effects also hold in the subset analyses for organizations with high and low pre‐treatment disturbance: Hypothesis 4 is supported in both operationalizations of outside lobbying (media lobbying and protest) in these subsets. When it comes to Hypothesis 3 on the intensity of all lobbying, the significant effect on scaling up lobbying resources only holds in one of the subsets (organizations with lower pre‐treatment disruption) because the confidence interval becomes very large for the other subsample (high pre‐treatment disruption). Still, the point estimates are quite similar in all three analyses, which indicates that pre‐treatment effects are not considerable.
In terms of effect sizes, the findings in Figure 3 are comparable to the effects of the access barriers treatment. In the scenario where restrictions last longer, groups are 0.35 points more likely to invest additional resources in political work, compared to the shorter scenario (difference of 0.11 standard deviations). At the same time, the likelihood of using media and protest strategies is rated 0.59 and 0.56 points higher in the longer scenario (0.18 and 0.23 standard deviations difference, respectively).Footnote 10
Combined, these effects of longer disturbances in relation to H3 and H4 suggest that organizations are triggered into an overall higher level of political mobilization. This is different from the pattern we observed in relation to access barriers, where interest groups’ higher use of protest strategies was combined with a higher likelihood of pausing political work. We hence show that activities covered by the umbrella term of ‘outside lobbying’ plausibly follow different logics of fight and flight, depending on the type of external threat that organizations face.Footnote 11
Conclusion
Studies of interest groups and public policy have made major leaps by explaining how organizations use different (inside and outside) strategies and gain access to different political venues (e.g., Binderkrantz et al., Reference Binderkrantz, Christiansen and Pedersen2015; Eising, Reference Eising2007; Fouirnaies & Hall, Reference Fouirnaies and Hall2018; Fraussen & Beyers, Reference Fraussen and Beyers2016; Dür & Mateo, Reference Dür and Mateo2016; Powell & Grimmer, Reference Powell and Grimmer2016). In doing so, however, the mechanisms that link levels of access and other contextual factors to the choice of lobbying strategies have remained causally underexplored (cf. Maloney et al., Reference Maloney, Jordan and Andrew1994).
This article, therefore, set out to test how organizations react to external threats in the form of extreme access barriers and severe disturbances to their interests. We presented a fight or flight model of lobbying responses, where fight strategies are political activities that scale up and intensify political activity in different venues, whereas flight denotes responses of disengagement in the form of pausing, scaling down or diverting lobbying activity. Moreover, we theorized that demand‐side threats in the form of access barriers are likely to trigger flight strategies, while we associate fight responses to supply‐side threats such as disturbances. When putting these expectations to a test in a cross‐country survey experiment during the global COVID‐19 pandemic, we found consistent support for these expectations.
First, our findings suggest that, when facing very high access barriers, organizations prefer to employ flight strategies: They see themselves as more likely than organizations facing low access barriers to put their advocacy activities on hold, rather than insistently knocking at a closed door. This indicates that there is a risk that groups that are (or suddenly become) outsiders to the policy process stop their political work, which can lead to biases in interest representation. We did not find evidence that such organizations divert their efforts to the media venue, which might further indicate that barriers to inside access have exclusionary effects that cannot easily be compensated for in other venues. Instead, we found evidence that extreme access barriers make diversion to more radical strategies such as protests more likely.
Second, our results indicate that organizations that face severe disturbances (in our case, longer lockdown restrictions) are determined to fight by investing more resources into political activities and intensifying their outside lobbying both in the media and through protest activities.
Our findings based on the (at the time) hypothetical scenario of a second COVID wave provide strong evidence that access barriers and disturbances matter for interest group strategy choice. In the highly unusual case of the COVID‐19 pandemic, where extreme ‘threats’ were realistic and credible for a diverse set of groups, we found very consistent treatment effects across involved respondents, also when taking potential pre‐treatment effects into account. Of course, generalization from a set of treatments in one, quite unprecedented, situation is not straightforward and external validity is a recognized limit of experiments in social science. However, we believe our results are relevant to interest groups outside our experimental setting for several reasons.
First, when we designed the experiment's treatments, we drew a hypothetical future scenario about the pandemic that only a few months later proved to be very close to reality. It is, therefore, plausible that our experimental setting strikes a rare balance between reality and testable experimental conditions. Second, a trait of our experiment is that it did not need to specify why exactly a specific interest organization faced access barriers and disturbances in this situation, as a number of barriers were reality for organizations at the time. We therefore expect the findings to reflect the average effect of different potential hindrances at several points in the policy process. We tentatively expect individual organizations facing more targeted access barriers to have similar responses, but hope that future studies can probe whether this is the case for different forms of inside access, such as parliamentary hearings and advisory bodies. Regarding the effects of disturbances, we reason that similar mechanisms might occur when organized interests are faced with disturbances of a different nature, such as diffuse ones like financial and energy crises, climate change or war and/or more sector‐specific ones, such as farm animal diseases, corporate scandals and terrorist attacks. Future studies could address the exact mechanisms at play for such different types of disturbances to organizations’ specific policy goals, which our experiment was not designed to take into account. Instead, it helped test organization‐level responses to population‐level disturbances.
Our results here point to important variation when it comes to the forms of outside lobbying (media strategies or protest) interest organizations resort to when facing system‐level disturbances and access barriers. We also see this choice to radicalize in the face of adversity as an important avenue for future studies. Such studies could also address more complex bundles of choices involved in venue shift, such as formal and informal consultations, strategies on social media and in personal contacts, to name but a few.
Other than pointing to these areas of future research, our results entail clear practical and normative implications. Lobbying is a couple dance that needs to involve both interest groups and policymakers. Our study suggests that for interest groups to thrive and an interest group system to be stable and functional, policymaking needs to be open to participation. When facing firmly closed doors, a likely organizational response is pausing the group's advocacy or go into protest. This finding might be of interest to advocacy groups and researchers who support the empowerment of instruments of participatory democracy and open government to ensure that no voices are systematically excluded from consultation processes. At the same time, our results suggest that interest groups fulfil their part of the bargain: they fight when societal or economic challenges arise and invest resources in expressing them politically in different venues. This sheds a positive light on the ability of interest group systems to adapt their activities based on external challenges.
Acknowledgements
The authors would like to thank the other team members on the InterCov project, Marcel Hanegraaff and Joost Berkhout, for their excellent collaboration in data collection. They also thank Anne Binderkrantz, Daniel Naurin and Andrea Pritoni, who made this cross‐county project possible by sharing lists of interest group populations. Moreover, they are grateful for comments received on earlier versions of this article, for instance by Gregory Eady, Zoltan Fazekas and the anonymous reviewers. Finally, they would like to thank their excellent research groups at the University of Copenhagen, Queen's University Belfast and Leiden University as well as the Danish Society for Education and Business for supporting this project.
Online Appendix
Additional supporting information may be found in the Online Appendix section at the end of the article:
Online Appendix
Dataset for replication


 Open access