Section 1. Forecast overview and policy recommendations
What is striking about political and economic developments in the UK over the past few months is the disconnect between the two. Negotiations with the European Union (EU) on the Withdrawal Agreement and the Political Declaration appear to have reached a roadblock on the Irish border issue even though the government appears ready to make concessions on its White Paper proposal.Footnote 1 At the same time, the ruling Conservative party, Parliament and the country, more generally, remain divided on the future relationship with the EU.
No one can be certain that a deal will be struck and as such a no-deal scenario remains a possibility. As it happens, this uncertainty will persist into the first quarter of next year even if there is a resolution on the negotiation one way or another. To start with, there are question marks around the influence that Parliament has on a deal if there is one and the influence that the Parliament will have on the government if negotiations fail or if that deal is rejected by Parliament (House of Commons, 2018). There is a question about the notification to exit itself. For example, can it be withdrawn? The uncertainty goes further – no one can say with any confidence that the current government will be in place in March 2019 when the UK is set to exit the EU.
And yet the economy has gained momentum with quarterly GDP growth expected at 0.7 per cent in the third quarter, employment and unemployment are at record high and low levels respectively, and wages appear to be recovering. The exchange rate has appreciated and, as discussed in the financial markets section below, other financial markets do not point to any significant stress.
Our central forecast is built on that base and, as before, we assume a soft Brexit where the UK maintains a high level of market access to the EU for goods and services and where financial markets function normally (Box A). Under that scenario, GDP growth is set to rise 1.9 per cent next year after growth of 1.4 per cent this year.
Figure 1 shows the relative GDP performance against the G7 countries and the big-picture message is clear – the UK has underperformed compared against its peers since the EU referendum in 2016 but, looking forward, the UK matches up favourably against its peers under our central soft Brexit scenario.
UK GDP growth against G7 growth

We have also updated our orderly hard Brexit scenario (see Box A) and according to that case, UK economic growth will slow sharply in 2019 and inflation will rise if, as we would expect, the currency depreciates. The UK would then continue to underperform compared with other G7 economies.
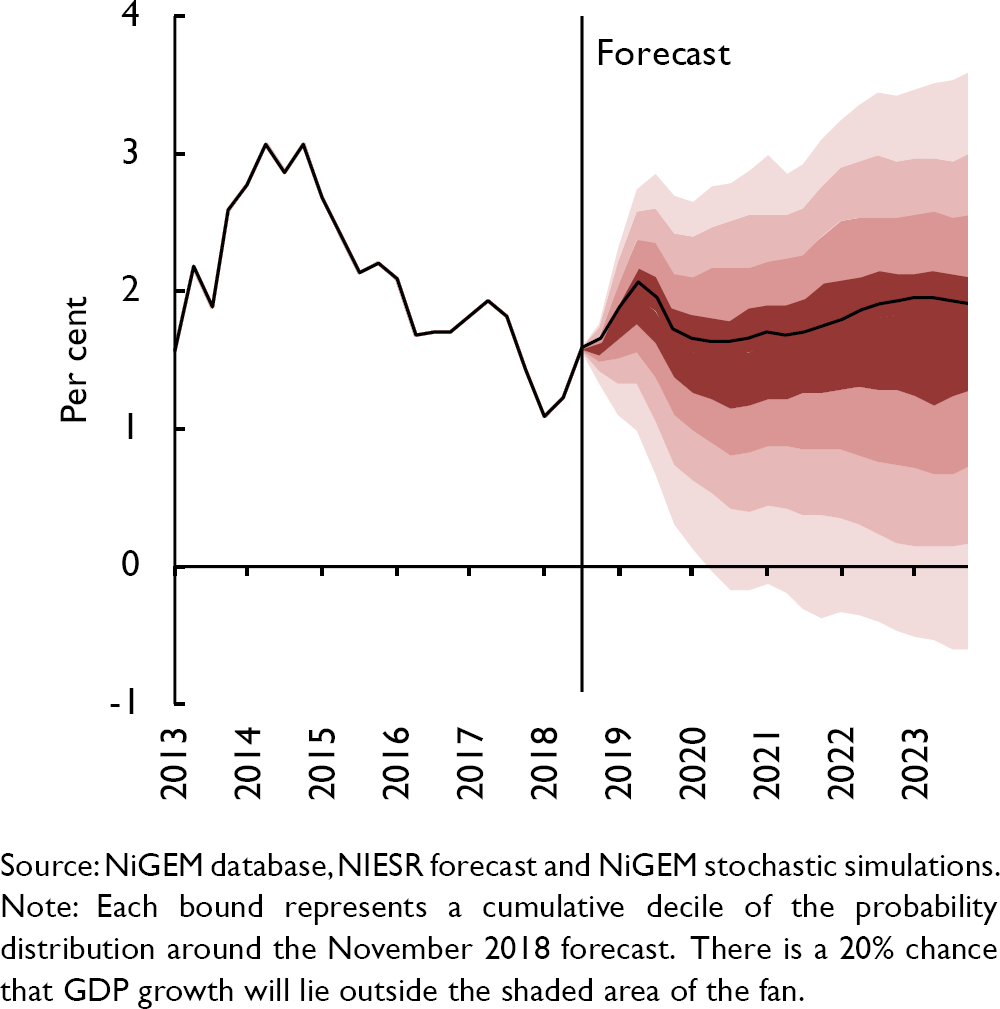
Taken together, we judge the risk to our central GDP growth forecast, which assumes a soft Brexit, to be skewed to the downside. Figure 2 is generated from our structural model, NiGEM, that allows the forecaster to apply an expert judgement and convey a complete narrative. The fan illustrates the uncertainty around the forward path of the variables based on the historical distribution of forecast errors. The skew is primarily driven by our judgement on the impact of a no-deal Brexit.
GDP growth fan chart (per cent per annum)
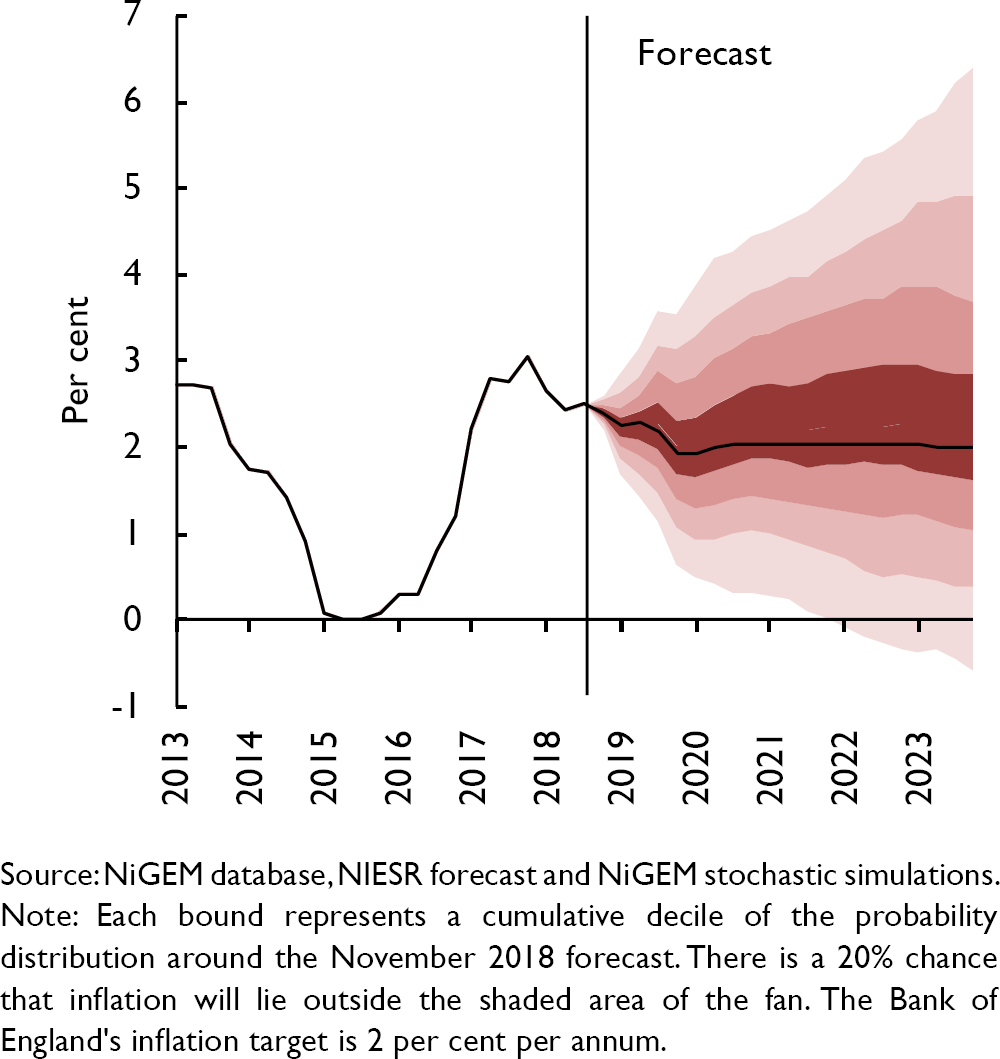
Inflation is set to continue falling from an average of 2.7 per cent in 2017 to 2.5 per cent in 2018 and to 2.1 per cent next year, before settling at or around the Bank of England's target rate of 2 per cent thereafter. The forecast for 2018 was revised slightly higher because of the recent spike in commodity prices. The main risk that dominates our short-term inflation forecast is Brexit. Under our orderly hard Brexit scenario, sterling depreciates and that in turn lifts inflation higher. The risk to the inflation forecast is therefore, skewed to the upside (figure 3).
Inflation fan chart (per cent per annum)
Public finances
It is against this uncertain backdrop that the Chancellor will have announced the 2018 Budget to Parliament on 29 October, after this Review went to press. While recent fiscal outturns have been welcome, with the current budget balance in surplus and the fiscal deficit ratio at its lowest level since 2001–2, this is by no means the ideal time to set out long-term fiscal plans, including the ‘envelope’ for the 2019 Spending Review. Conditional on a soft Brexit, there is room within the government's near-term debt and deficit targets to raise expenditure in areas where pressures are particularly high. By contrast, a no-deal Brexit would eliminate any fiscal space and require the government to stabilise the economy in the short term.
Surprises to public finance outturns
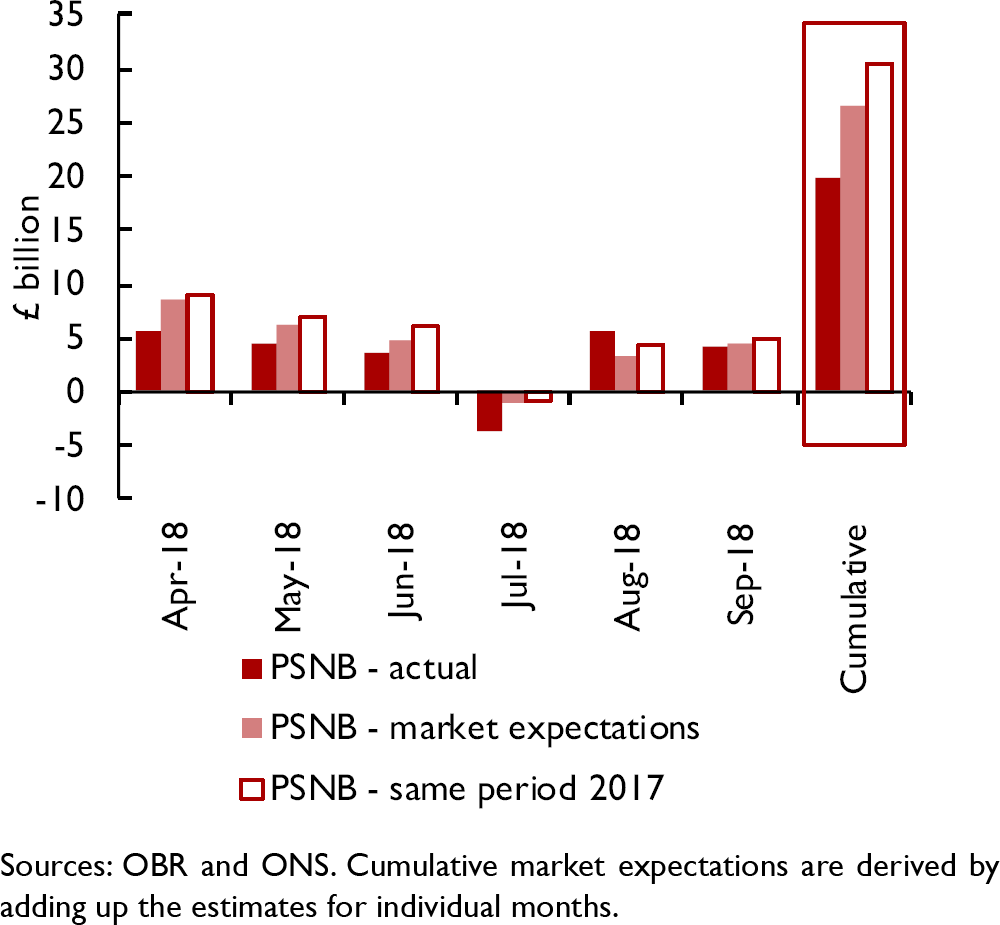
The latest outturn for public sector net borrowing in 2017–18 of £39.8 billion was £5.4 billion below corresponding estimates provided by the Office for Budget Responsibility (OBR) in March 2018, mainly driven by lower central government spending and less net borrowing by local authorities. At 1.9 per cent of GDP, this was the lowest level of borrowing since 2001–2. Similarly, provisional borrowing data surprised to the downside during the first six months of the current fiscal year. Public sector net borrowing remained £10.7 billion below its level over the same period in 2017 and stood below market expectations (figure 4). The main driver of these surprises was central government spending, which on current estimates grew at a slower pace than implied by OBR forecasts from March 2018, while receipts were also stronger than expected.
Surprises to public sector net borrowing in 2018–19 to date
The more favourable state of public finances can in part be explained by better-than-expected employment and unemployment outturns, which increase the tax base and reduce social security payments. Figure 5 illustrates that lower-than-expected unemployment outturns have historically often allowed policymakers to curb expenditure plans. In fact, the unemployment rate has turned out to be 0.2–0.4 percentage point lower since March 2018 compared to the OBR's forecast. Reference Chadha, Hantzsche, Lazarowicz, Pabst and YoungChadha et al. (2018) analyse the relationship between spending plans and revisions to the GDP growth outlook (which, apart from recent years, exhibits a strong co-movement with unemployment). They find that spending forecasts tend to be revised downwards if the economy surprises to the upside. This is partly driven by automatic stabilisers outside the control of government departments (annually managed expenditure) acting as buffers against adverse shocks to the economy.
Relationship between unemployment surprises and government spending revisions

Soft Brexit central public finance forecast
We have highlighted before that public expenditure will have to increase in a number of areas to accommodate the needs of an ageing population and maintain the quality of public services (Reference Hantzsche and YoungHantzsche and Young, 2018). Prior to the Budget, the government had already announced several spending measures, including a real-term increase in NHS spending of £20.5 billion per year by 2023–24, £1.25 billion in the next two years to alleviate pension pressures, additional funding to local authorities for the construction of council houses, a freeze in fuel duties, an end to the public sector pay cap, and more generally to ‘end austerity’.
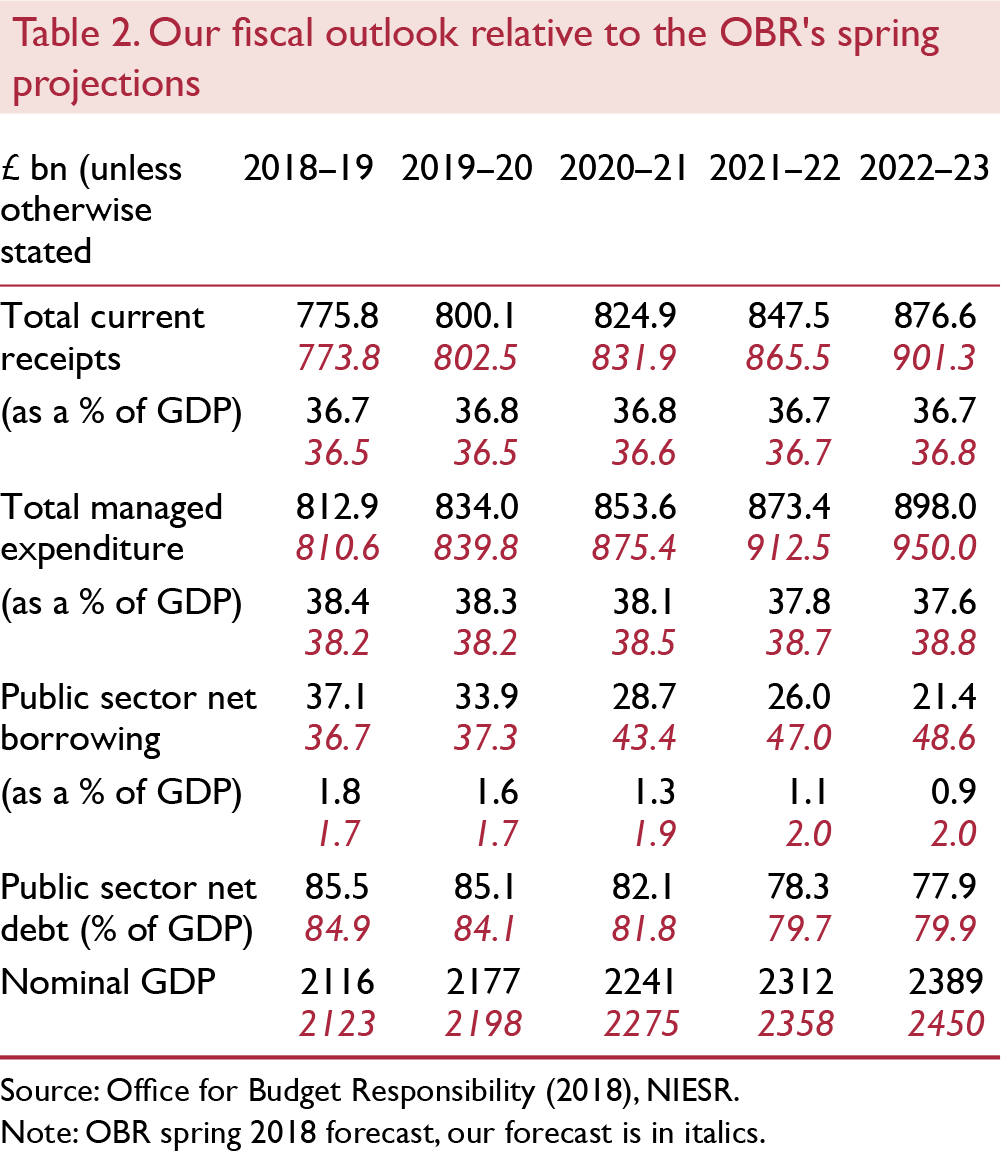
In our central forecast, which is based on a soft Brexit scenario, we assume that total managed expenditure as a share of GDP will remain between 38 and 39 per cent over the forecast horizon. This aligns it closely with its long-run average of 39 per cent but is higher than the OBR's spring forecast, which had it fall to 37.6 per cent in 2022–23 (table 2). Stabilising the spending-to-GDP ratio can come about as a result of measures to be announced in the 2018 Budget, and possible additional expenditure adjustments thereafter as uncertainty about the Brexit outcome is lifted. Our assumption implies that, on average, over 2019–20 to 2022–23, the government would have an additional £30 billion per year at hand to meet rising spending needs, relative to the OBR spring projection. Maintaining current spending levels relative to GDP also means that the public deficit will remain elevated for longer. As a result, annual public sector net borrowing would increase by an average of around £16 billion compared to the OBR spring forecast for the same period. Yet given that, recent better-than-expected outturns and our soft Brexit assumptions imply that GDP growth will be stronger than projected by the OBR, adding £70 billion to nominal GDP by 2022–23, and revenue will be higher by around £13 billion on average over 2019–20 to 2022–23, net borrowing as a share of GDP settles at 2 per cent (figure 6, solid black line). Public sector net debt as a share of GDP starts to fall from 2018–19 onwards, albeit at a slower pace than projected by the OBR in spring, reaching 80 per cent within the next three years (figure 7).
Public sector net borrowing and no-deal Brexit variant

Public sector net debt and no-deal Brexit variant

How does this outlook compare to the government's fiscal targets? Conditional on a soft Brexit and with economic growth probably remaining close to potential, our assumed additional spending measures can be achieved within near-term targets of reaching a structural deficit below 2 per cent of GDP by 2020–21 and a fall in the net debt-to-GDP ratio by 2020–21. By contrast, we do not believe that the government will be able to meet its longer-term fiscal objective of reaching a balanced budget “at the earliest date in the next Parliament”, i.e. 2022–23 or 2025–26 depending on the exact definition, without raising taxes or significant improvements to public sector efficiency. To reach budget balance by the middle of the next decade, a comprehensive review of the tax system will be necessary once the final Brexit deal is known.
Alternative no-deal Brexit forecast
The Chancellor will announce the Budget at a time of considerable uncertainty about the future trading relationship between the UK and EU which also complicates the fiscal outlook (Reference ChadhaChadha, 2018). To illustrate, we estimate the immediate fiscal implications of a no-deal Brexit scenario based on our judgement about the economic impact of such a scenario in the short run (see Box A for details). A no-deal Brexit will lead to a currency depreciation, lower GDP in the short and long run and higher temporary inflation. Under our orderly hard Brexit scenario, the government is in a position to comply with the near-term fiscal targets only if spending remains in line with the OBR's March forecast.
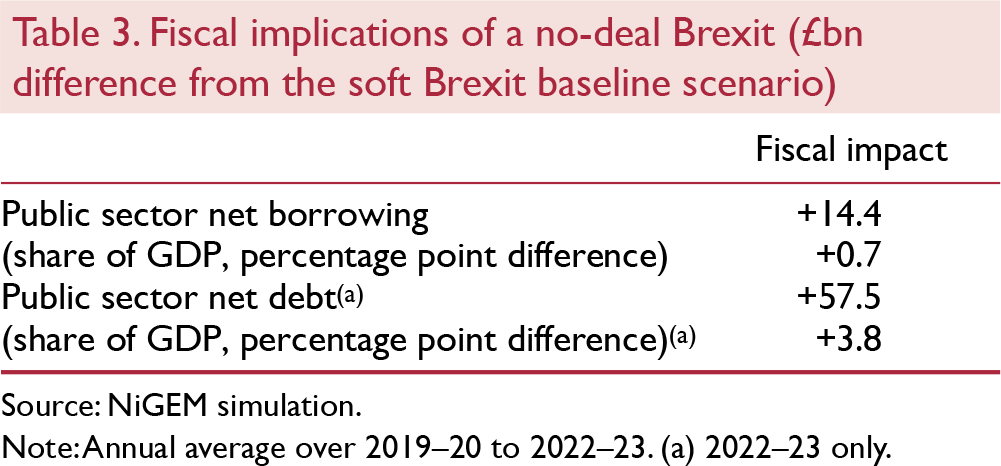
Table 3 shows that borrowing would be higher by £14 billion per year, or 0.7 per cent of GDP, over the next four years, relative to the soft Brexit case. This is because of a drop in government revenue and an increase in annually managed expenditure. As a result, we would expect public sector net debt to be £58 billion higher than under a soft Brexit scenario by 2022–23, corresponding to 3.8 per cent of GDP.
Figures 6 and 7 show the evolution of net borrowing and net debt for the no-deal case (dashed red lines). The charts also illustrate what drives the divergence between the no-deal fiscal outlook and the soft Brexit baseline. Our orderly hard Brexit scenario is driven by a combination of distinct shocks to trade barriers (tariff and non-tariff), foreign direct investment, and contributions to the EU budget, migration and productivity. We find that reductions in UK–EU trade and changes to the productivity forecast as a result of Brexit pose the largest risks to the fiscal outlook (grey and light red bars, respectively).
The negative impact of trade barriers on the economy increases unemployment and thus, social benefit payments by more than 2 per cent as Brexit materialises. This lifts total managed expenditure by around £10 billion per year. The revenue side is hit hardest by a decline in productivity.
By assumption, the windfall of £5 billion per year from repatriated EU budgetary contributions is recycled into domestic spending and is therefore fiscally neutral. To the extent that a reduction in the size of the population reduces both revenue and spending, and assuming no substantial demographic differences between migrants and natives, the net fiscal effect of changes in net migration is negligible. For given levels of risk premia, the reduction in foreign direct investment puts downward pressure on the cost of capital, thereby reducing government interest payments somewhat and thus, offsetting some of the fiscal deficit (white bars).
What will the Chancellor do?
These two cases represent two extremes of possible economic outcomes (to be clear, there are more extreme scenarios at either end that embody a disorderly Brexit and a Remain scenario that we have not explicitly modelled). The Chancellor is likely to present a forecast that will be conditioned on an ‘in-between’ scenario that represents a version of the White Paper or Chequers scenario (see the August Review) and one that allows for an implementation or withdrawal period (Office for Budget Responsibility, 2018b). Under that scenario, the government will have some fiscal room, but not as much as in our central soft Brexit scenario.
A comprehensive tax review?
There is a broader question that relates to the size of government in the longer term. The UK has preferred to spend and tax less (as a proportion of GDP) compared with other G7 economies (figures 8 and 9). On our central forecast, where relaxed austerity is represented by a constant TME to GDP ratio, the fiscal deficit also remains constant at 2 per cent of GDP in 2022 and beyond. If the medium-term objective is to balance the budget, the government will have to plug the gap with additional tax revenue. In our view, this 2 per cent deficit is a significant sum to raise with any single tax measure such as an increase in the income or corporation tax rate or say, higher VAT. Instead, we recommend that the government undertakes a comprehensive review of taxation and how it charges for public services, such as adult social care, with the aim of raising revenue more efficiently and equitably than it does at present.
Government spending as a % of GDP

Tax revenue as a % of GDP

Additional fiscal risks
Independent of Brexit, our fiscal forecast faces a number of additional risks. A faster-than-expected ageing of the population would require more spending while external shocks to the economy, for instance as a result of global trade tensions, could hit both the spending and revenue side and increase borrowing costs if risk premia were to rise. The IMF highlights that the UK's public sector balance sheet has become more vulnerable since the financial crisis as a result of banking sector bailouts and public pension liabilities. A faster-than-expected pick-up in productivity, on the other hand, poses an upside risk to the long-term fiscal outlook.
Monetary policy
We maintain our recommendation that the Bank of England Monetary Policy Committee (MPC) continues on a gradual and limited path of policy normalisation. Under our central forecast, which is conditioned on a soft Brexit scenario and a forecast for government spending that overshoots the OBR's projections, the MPC should take the next 25 basis point step in February, six months after the August rate increase. Thereafter, and subject to the economy evolving broadly as in our central forecast, we recommend that Bank Rate rises by 25 basis points every six months so that the rate reaches 1.5 per cent by mid-2020.
The MPC has long stated that it will continue to reinvest the proceeds from maturing bonds bought under its Asset Purchase Facility until the policy rate reaches the threshold of 2 per cent. That guidance changed in June and the MPC has decided to lower that threshold by 50 basis points to 1.5 per cent (Reference CarneyBank of England, 2018). We would therefore, expect the Bank's balance sheet to start to shrink from mid-2020 as bonds mature, given that on our central forecast the threshold is reached at that point.
At the time of writing, the financial markets were pricing in a more gradual path of interest rate normalisation. The difference between our central forecast and the implied market path is likely to be due to the markets placing weight on downside risks that are not contained in our central forecast. Notwithstanding these differences, figure 10 shows that market expectations of Bank Rate have converged towards our view over the past three months.
Market-implied paths for short-term interest rates and NIESR forecast

News since the August forecast
The main reason for that convergence is better-than-expected news from the economy since our last Review. The most striking of these is the most recent ONS estimate of GDP. The official data shows that the economy expanded by 0.7 per cent for the three months to August and building on that, NIESR's monthly GDP indicator suggests that growth will average a similar 0.7 per cent in the third quarter before slipping to 0.5 per cent in the fourth quarter. If this forecast proves to be correct, there is clear evidence that the economy gained momentum over the course of the year and also that the economy is expanding at a speed that is slightly faster than our estimate of potential which is growing at around 1.75 per cent per annum.
The economy has gathered strength at a time when most conventional measures suggest that there is little spare capacity. The employment rate and the unemployment rate are at multi-decade highs and lows, respectively, and there is little sign in the official data of a recovery in output per worker.
It is against that backdrop that the news on prices since our August forecast also surprised to the upside. For example, CPI inflation jumped to 2.7 per cent in August from 2.5 per cent in July before easing to 2.4 per cent in September, and wages, as measured by average weekly earnings (excluding the volatile bonus component), rose by 3.1 per cent in the three months to August from 2.1 per cent a year ago. Official data show that both private and public sector wage inflation increased over this period.
Risks to our monetary policy assumption
1) Brexit and the supply side
As stressed earlier, Brexit remains a material risk to our monetary policy forecast. The central forecast here is conditioned on a soft Brexit, but if negotiations fail and the UK ends up trading on WTO terms, we expect sterling to depreciate and inflation to rise well above the target rate of 2 per cent in the short run.
Whereas in 2016 the MPC had room to stimulate the economy with a comprehensive package, including further asset purchases and reduction in Bank Rate, the case for stimulus is less clear now because the economy has less spare capacity and CPI inflation is above the target level.
Monetary policy will be set based on a judgement on the balance between the supply capacity of the economy and aggregate demand (Reference CarneyCarney, 2018). The forecast path for productivity, and the supply potential of the economy more generally, is highly speculative even before adding Brexit-related uncertainty to the mix. How should the MPC set monetary policy when the outlook for supply is so uncertain?
Productivity depends on the amount and type of capital and labour in the economy and the efficiency with which these inputs are combined. In general, monetary policy tends to have a large and significant short-term impact on the economy that fades away after 2–3 years. The empirical literature that quantifies the impact of trade policy on productivity mostly provides a long-term impact rather than a path to that eventual equilibrium (see Supply section below).
The near-term supply potential of the economy is driven by investment spending and labour inputs and total factor productivity (TFP). The shock to investment spending and labour inputs will be known with a short lag, but the impact on TFP will only reveal itself after a considerable period of time. The appropriate short-term response of monetary policy will, therefore, depend on the perceptions of the size and timing of the shock to aggregate demand relative to the unknown supply capacity of the economy.
For a given shock to total factor productivity, if aggregate demand drops because of household spending or exports and over this period investment spending holds up and, therefore, the supply capacity of the economy is relatively unaffected, the MPC may have room to inject stimulus into the economy provided, of course, inflation expectations remain anchored. If instead, supply capacity is damaged because investment falls and at the same time household consumption and exports remain unaffected, the MPC may be forced to hold policy unchanged. The MPC will also have to take account of any changes to fiscal policy.
This is a challenging scenario and in this scenario the Bank of England must maintain a careful communication strategy especially in the event of a no-deal Brexit, not least because the response of the economy to that scenario and the reaction function of the central bank are so uncertain. Analysis of MPC minutes with the help of text mining techniques shows that the use of specific words can steer market expectations about policy (see Box C).
2) Other risks
Another long-standing risk to our monetary policy view relates to the evolution of whole-economy productivity that is independent of Brexit. After ten years of disappointing productivity performance and persistent downside surprises, we revised lower our forecast for hourly productivity growth in November last year to just under 1.5 per cent per annum. All things equal, a quicker return of productivity growth to the pre-crisis average would require a lower policy rate in the short term to lift growth to its potential and a higher policy rate in the long run.
An additional key domestic risk relates to wage growth. Unemployment is at its lowest level since the early 1970s, yet wage growth remains subdued. The 1 per cent cap on public sector pay that had been in place since 2010 has now been lifted with 1 million NHS workers receiving a one-year pay settlement of at least 3 per cent in 2018–19. Teachers, police and the armed forces have been awarded pay settlements well in excess of the 1 per cent cap. A rapid convergence to private sector levels that is not accompanied by gains in productivity will raise inflationary pressures (Reference HantzscheHantzsche, 2017). Separately, the National Living Wage is rising faster than productivity growth. Any material spillover from this into the next rung of wages, or wages more broadly, could lead to further inflationary pressure. Our central forecast allows for higher wage growth and a gradually rising equilibrium rate of unemployment.
Wage growth could surprise to the downside as well. Reference Bell and BlanchflowerBell and Blanchflower (2018) argue that we are underestimating the amount of supply capacity in the labour market because the standard measure of unemployment fails to adjust for workers, part-time and full-time, that would prefer to work longer hours. In their view the Phillips curve has flattened and ‘the NAIRU in the UK may well be nearer to 3 per cent, and even below it, than around 5 per cent, which other commentators including the MPC and the OBR believe.’ Under that view the Bank of England should maintain Bank Rate at current levels (or even lower).
Reference HantzscheHantzsche (2018) highlights other structural factors that help explain the wage undershoot. These include the downtrend in labour unionisation and employment protection legislation. A continuation of these trends will exert downward pressure on wages in future.
At its October meeting, the Financial Policy Committee (FPC) held the countercyclical capital buffer (CCyb) rate unchanged at 1 per cent. Brexit remains a key risk for the FPC and in its judgement the UK banking system has the resilience to continue supporting the economy even through a disorderly Brexit. The committee's confidence is based on the results of the 2017 stress test that tested the banks on a scenario that could materialise in the event of a hard Brexit. That scenario had a sharp currency depreciation, higher Bank Rate and a very large fall in UK property prices, both residential and commercial. The 2017 exercise also tested the banks for a synchronised global downturn and the FPC judged that the Bank's system had the necessary buffers in place. The FPC will review the results of the 2018 stress test which also includes a synchronised global downturn at its next meeting in November.
Different shades of Brexit and assumptions underpinning our forecast
As this Review goes to press, the form of the final agreement under which the UK will leave the European Union on 29 March 2019 remains unclear, as is the timetable of Brexit. An additional layer of uncertainty stems from the fact that even if the final agreement was known, its implications for our forecast are not, given that the UK is the first country to exit. We therefore provide two distinct forecasts for the UK economy, one based on a ‘soft’ Brexit assumption and one based on a scenario in which the UK reverts to trade under WTO rules after the end of the Article 50 period. In this box, we lay out the assumptions that underlie each of these two cases and illustrate potential implications for our forecast of various intermediate shades Brexit could take.
Soft Brexit
Our central forecast rests on the assumption that trade in goods and services between the EU and UK after Brexit will take place without substantial tariff and non-tariff barriers. This implies that agreements equivalent to membership of the European Economic Area, and thus the four freedoms, and the EU customs union will be drawn up, potentially during a transition period in which the UK remains a full EU member. Existing trade arrangements suggest that in return for trade access, the British government will continue to make contributions to the EU budget and allow free movement of workers. Once the cloud of uncertainty has been lifted, we would expect there to be no significant Brexit-related impact on investment and productivity growth. Our baseline population assumptions are based on principal projections provided by the Office for National Statistics.
No-deal Brexit
Throughout this chapter, we contrast our central forecast with an alternative forecast for a no-deal scenario based on the following assumptions (see also figure A1):
The impact of different Brexit scenarios by transmission channel

If the UK was to revert to trade under WTO most-favoured-nation status, trade in services would face substantial regulatory barriers while goods trade would be subject to tariff and non-tariff barriers. Based on updated NIESR estimates, we would expect EU–UK trade to fall by 56 per cent in the long run. Some of this reduction (we assume one half) would already materialise on the day of Brexit as tariffs would apply to trade in goods, services may fail to be authorised for trade, and complex supply chains would be interrupted by border controls.
The British government would be free to impose rules on EU immigration. As the UK might potentially also become a less attractive destination for migrants, we assume that net migration falls by around 100,000 a year compared to the ONS’ principal population projection.
Similarly, foreign direct investment is assumed to fall by 24 per cent as access to the EU market is inhibited, making the UK a less attractive investment destination.
As a result of the reduction in trade, net migration and FDI, we would expect productivity growth to slow and assume a reduction in total factor productivity of 1.4 per cent in the long run.
Upon leaving the EU, the British government is assumed to recycle around half of its current EU budgetary contributions of £10 billion per year (0.5 per cent of GDP) into domestic government consumption (using the other half to settle financial accounts for an extended period of time).
We assume that the government is able to ensure the transition to trade under WTO rules in 2019Q2 is orderly by putting temporary arrangements in place. Our scenario therefore does not consider short-term effects of uncertainty on financial market risk premia.
Compared to the soft Brexit case, economic growth slows under the no-deal scenario. Over ten years, we estimate that annual output would be 5.3 per cent smaller (figure A2). The loss in GDP is mainly driven by reductions in EU–UK trade (1.8 per cent) and net migration (1.7 per cent), followed by lower productivity growth (1.4 per cent). The direct impact of reductions in foreign direct investment is comparatively small (0.4 per cent) and changes in budgetary contributions do not have any sizeable effects on output in the long run.
The long-run impact of a no-deal Brexit on UK real GDP

Other shades of Brexit
A number of other variations of the future economic relationship between the UK and the EU are conceivable, subject to both sides of the negotiation dropping some of their red lines and, crucially, parliamentary approval. Figure A1 provides an illustration of the intensity with which different parts of the economy would be affected. The membership of countries like Norway in the European Economic Area would be a close substitute for a soft Brexit. It would ensure full access to the EU single market, most likely in return for free movement of labour, but somewhat inhibit goods trade if it means an exit from the customs union. The trading relationship between the EU and Switzerland is characterised by a number of bilateral agreements that ensure relatively high levels of market access outside of the EU institutions. By contrast, free trade agreements, such as that between the EU and Canada, eliminate tariffs and align some of the regulation governing trade but cannot guarantee as frictionless a relationship as an EEA or customs union membership. The exact implications of these different options for our forecast depend very much on their practical implementation but we would expect their economic impact to lie somewhere between our soft Brexit and no-deal case. One example of an ‘in-between’ relationship is the government's July 2018 White Paper proposal (Chequers). We have discussed the likelihood of this proposal and assessed its economic impact in the previous Review.
Outside of the spectrum between a soft Brexit and a WTO outcome, a hypothetical revocation of the Brexit process has the potential to lift the cloud of economic uncertainty immediately. Abstracting from potential political consequences, this could provide a boost to investment in the short term. By contrast, the economic consequences of an exit from the EU without sufficient preparation time and short-term transition arrangements in place are likely to be much more severe than those of an ‘orderly’ no-deal outcome, at least in the short term. Finally, uncertainty may prevail for longer if negotiations drag on without reaching a final conclusion, dampening investment and economic sentiment.
Section 2. Forecast in detail
Financial markets developments
The main news from markets since our last forecast has been from equities and commodities. The FTSE 100 and the FTSE 250 have fallen by around 8 per cent since the start of August which is similar to other major European indices such as the Eurostoxx 50. The price of Brent crude has risen by around 10 per cent in US dollars over this period. Some of that increase has been offset by the appreciation of sterling against the dollar so that the sterling price of oil is some 8 per cent higher than three months ago. In other words, the factors driving the large moves in financial and commodity markets over the past three months appear to be global rather than local.
What is striking then about the recent performance of the UK financial markets is the absence of a clear response to Brexit-related news. The news flow over this period has ebbed from a soft Brexit outcome where the UK maintains a close trading relationship with the EU to a no-deal hard Brexit, yet, the sovereign CDS spread, which is the cost of default protection or, more generally, a measure of sovereign risk, remains well below the levels reached around the time of the EU referendum in June 2016. Similarly, the 10-year gilt-bund spread remains below the June 2016 level and in the foreign exchange markets sterling, which was the market variable most sensitive to the referendum result, has, in fact, appreciated over the past three months. Taken together, financial markets have been placing more weight on economic news and global factors rather than Brexit-related news.
The economic news from the UK has been generally positive over the past three months (see Monetary Policy section for more details). Consistent with that, financial markets have brought forward expectations of the next Bank Rate increase and in fact, the entire yield curve has shifted higher (figure 13).
Five-year sovereign CDS spread

Sterling exchange rate (effective and bilaterals)

UK yield curve

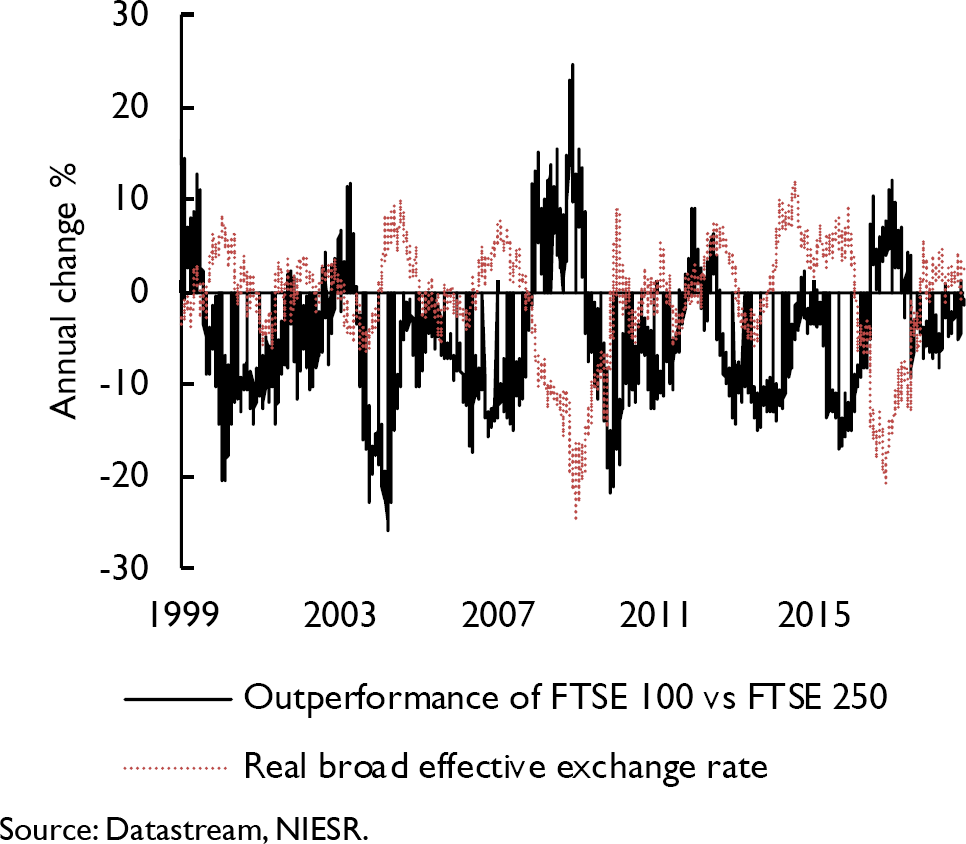
All this is not to suggest that the outcome of the Brexit negotiations will not influence the financial markets going forward. A failure in talks that leads to a hard Brexit will, in our view, drive the currency lower by some 10–15 per cent against the dollar even if the monetary policy response is less clear this time (see Monetary Policy section for a discussion). That currency depreciation will lead to an outperformance of the globally-exposed FTSE 100 index relative to the more domestically exposed FTSE 250 index (figure 14), as happened after the announcement of the Brexit referendum. By contrast, a soft Brexit outcome will likely drive the currency higher and the FTSE 100 is likely to underperform the FTSE 250.
The exchange rate and the relative performance of the FTSE 100 and FTSE 250 stock price indices
Output and the components of demand
Quarterly growth path
In the face of Brexit uncertainty the UK economy has recently gained some momentum. According to ONS estimates, GDP expanded by 0.7 per cent in the three months to August, after growing by 0.4 per cent in the second quarter (three months to June) and above our expectation of 0.6 per cent, partly due to back data revisions. In particular, the industrial production sector contributed to this performance by expanding at a rate of 0.7 per cent in the three months to August. At the same time, growth in the first quarter of 2018, when the economy was hit by weather-related disruptions, was revised back down to 0.1 per cent. NIESR's Monthly GDP Tracker suggests that the economy will continue to rebound and expand by 0.7 per cent in the third quarter and by 0.5 per cent in the final quarter of this year (figure 15).
GDP growth (3 months on previous 3 months, per cent)

Revisions to the quarterly growth path of GDP have implications for annual growth figures. Downward revisions for the first quarter, an unchanged path for the second quarter and higher expectations for the third quarter mean that our forecast for 2018 as a whole, based on soft Brexit assumptions, remains unchanged at 1.4 per cent. For 2019, we now expect annual growth of 1.9 per cent, a 0.2 percentage point revision up from the forecast published in our last Review. This change is entirely explained by the new quarterly profile for 2018 rather than an upward revision to our 2019 quarterly growth projections: GDP is set to expand by around 0.4–0.5 per cent throughout 2019 as before.
Growth contributions under a soft Brexit
Should a deal on Brexit be reached where the UK maintains a high level of access for goods and services to the EU market, we would expect the recent rebalancing towards net trade to reverse and consumption and investment growth to pick up.
Net trade has made a positive contribution to real GDP growth of 0.7 percentage point in 2017 and is set to contribute 0.4 percentage point to 2018 overall output growth (figure 16). This is because the depreciation of sterling lowered import growth as import prices rose. Exports benefitted from lower foreign-currency export prices but not as much as we expected a year ago. This is because demand for British exports did not sufficiently pick up (Reference Douch, Edwards and SoegaardDouch et al., 2018) and uncertainty about the future trading relationship between the UK and EU deterred exporters from entering into new trade contracts (Reference Crowley, Exton and HanCrowley et al., 2018). Instead, foreign companies appear to be sourcing increasingly from non-UK-based suppliers as exports of manufacturing goods producers surveyed by IHS Markit, which are used as inputs by other manufacturers, remained weak in the third quarter of 2018.
Contributions to annual GDP growth

As Brexit uncertainties disappear, this could help exporters but we would also expect sterling to appreciate with countervailing effects on exports. By contrast, a higher exchange rate would lower the price of imports. On balance, we forecast net trade to lower overall GDP growth by 0.2 percentage point in 2019 and by 0.1 percentage points in 2020.
Business investment grew by 0.5 per cent in the second quarter of 2018, offsetting the 0.4 per cent drop in the first quarter. The Bank of England's Agents’ summary of business conditions suggests that investment intentions softened again in the third quarter, to a large extent as a result of Brexit-related uncertainties. We expect business investment to benefit from a soft Brexit outcome and forecast a growth contribution of 0.5 percentage points in 2019 and 2020, after 0.1 and 0.2 percentage point in 2017 and 2018, respectively.
Private consumption should also recover somewhat as the cloud of uncertainty is lifted and inflation moves back to the Bank of England's 2 per cent target. We forecast consumption to add 1.1 percentage points to growth in 2019, after 1.2 and 1 percentage points in 2017 and 2018, respectively.
As a result of our judgement on fiscal policy and our assumption of a higher path for government consumption relative to the OBR's spring forecast, government spending should add 0.1 percentage point to real GDP growth in 2018, and 0.2 percentage point in 2019 rising to 0.4 percentage point in 2020.
Growth contributions under a no-deal Brexit
In our no-deal Brexit scenario, in which negotiations fail and the UK reverts to trade under WTO rules in the second quarter of 2019, we expect real GDP growth to slow to 0.3 per cent in 2019 and 2020, i.e. to be 1.6 and 1.3 percentage points lower, respectively, compared to the soft Brexit forecast.
Forecasting with a benchmark: the Warwick Business School forecasting system
We provide benchmark forecasts to help understand and contextualise the forecasts presented elsewhere in this Review. The box presents density forecasts for UK GDP annual growth and inflation, and reports the probabilities of a range of output and inflation events occurring, as calculated using the Warwick Business School Forecasting System (WBSFS).Footnote 1
To reflect the uncertainties inherent in economic forecasting, and following the practice of the NIESR and other forecasters such as the Bank of England and OBR, the WBSFS provides probabilistic forecasts. The WBSFS forecasts are produced by explicitly combining density forecasts from a set of 24, statistically motivated, univariate and multivariate econometric models commonly used in the academic literature. The use of combination forecasts or model averaging reflects the view, supported by research (e.g., see Reference Bates and GrangerBates and Granger, 1969; Reference WallisWallis, 2011; Reference Geweke and AmisanoGeweke and Amisano, 2012; Reference Rossi, Elliott and TimmermannRossi, 2013), that because any single model may be mis-specified there may be gains from the use of combination forecasts.
Comparison of the Institute's forecasts with the probabilistic forecasts from the WBSFS may be interpreted as providing an approximate indicator of the importance of expert judgement, which may include views on the underlying structure of the macroeconomy. This is because the WBSFS forecasts are computed by exploiting regularities in past data with the aid of automated time-series models; they do not take an explicit, structural or theoretical view about how the macroeconomy works; and they do not rely on (subjective) expert judgement to the same degree as those presented by the Institute. The forecasts from the WBSFS are not altered once produced; they are deemed ‘simply’ to represent the data's view of what will happen to the macroeconomy in the future.
Figure B1 presents WBSFS's latest (as of 15 October 2018) probabilistic forecasts for real GDP growth and inflation – defined as year-on-year growth rates for 2018Q4 and 2019Q4 – as histograms. The information set used to produce these forecasts includes information on GDP growth up to 2018Q2 and data on CPI inflation up to August 2018.
WBSFS forecast probabilities for real GDP growth and inflation, year-on-year

Table 1 extracts from these histogram forecasts the probabilities of specific output growth and inflation events. The events considered are the probability of output growth being less than 0 per cent, 1 per cent and 2 per cent, and of inflation lying outside the 1–3 per cent range (i.e., the probability of the Bank of England's Governor having to write a letter explaining how and why inflation has breached this range). Also reported are the individual probabilities of inflation being less than 1 per cent and greater than 3 per cent, to indicate which side of the range is most likely to be breached.
Inspection of the forecasts for output growth for 2018Q4 in table B1 suggests that, compared with our forecasts made one quarter ago in July, lower output growth is more likely. The most likely range for the forecast remains for economic growth between 1 and 2 per cent in 2018Q4, but the probability of growth less than 2 per cent has increased from 71 per cent in July to 83 per cent in October. The uncertainty about the 2018Q4 growth has declined in comparison to July, so the predictive density is now narrower, and there is a 1 in 2 chance that growth will be between 1 and 2 per cent. Looking out further to 2019Q4, there are only limited changes in the probabilistic forecasts from July to October, with higher growth between 2 and 3 per cent now marginally less likely at around 25 per cent. As table B1 shows, there is a small increase of the risk of ‘low’ growth (growth less than 1 per cent) in 2019Q4 – the predictive probability of this event has risen to 28 per cent from 25 per cent in July.
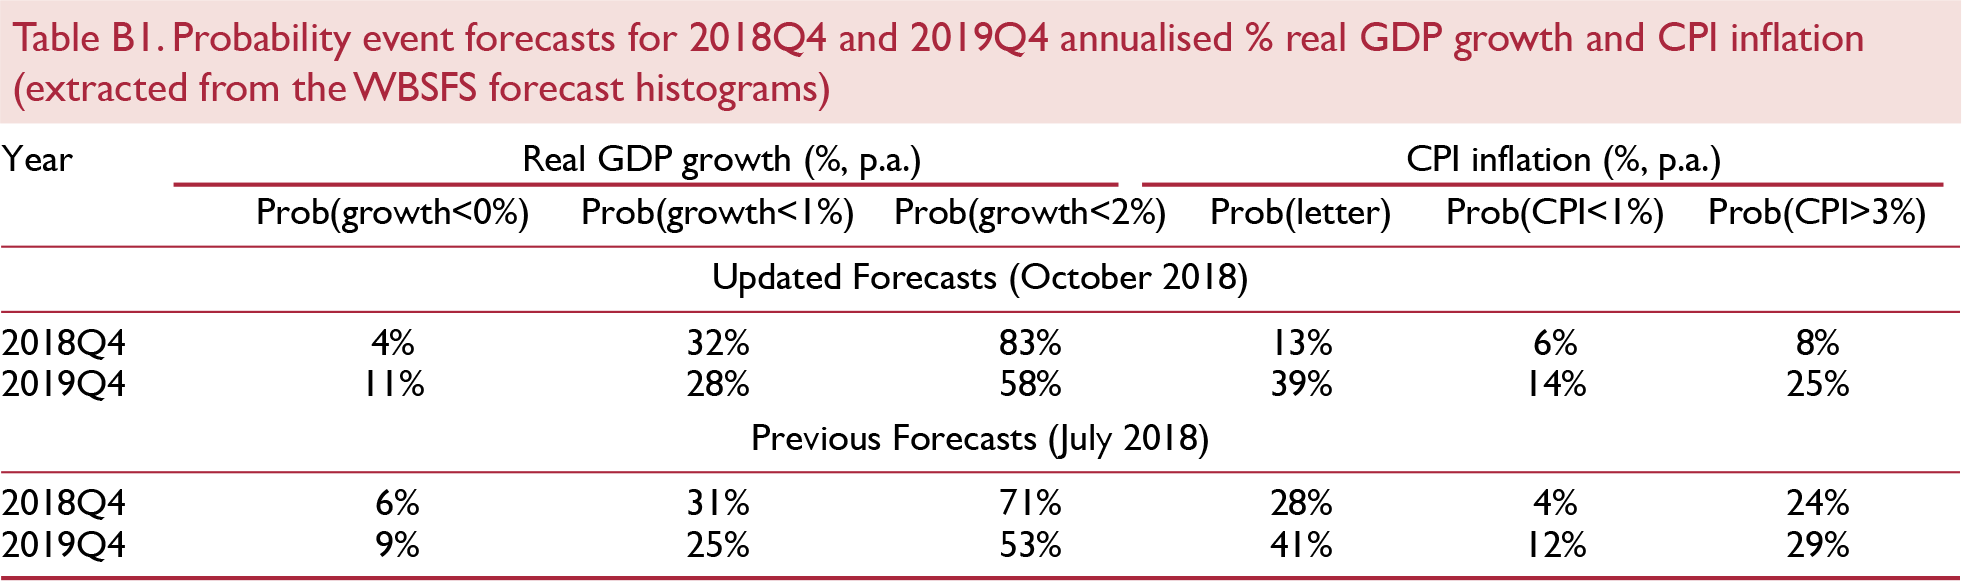
For inflation, our probabilistic forecasts for 2018Q4 have changed between July and October, such that the probability of inflation being outside the range where the Governor of the Bank of England needs to write an explanatory letter has decreased by a sizeable 15 percentage points from 28 to 13 per cent. This change is largely attributable to the probability of inflation exceeding 3 per cent falling from 24 to 8 per cent. This is a continuation of the downward movement in the inflation forecasts from April to July. An inflation rate between 2 and 3 per cent remains the most likely outcome in the year ending 2018Q4, with a 45 per cent probability. But the WBSFS predicts that inflationary pressures for 2019Q4 remain approximately as predicted in July, with a probability of around 30 per cent of inflation falling in the 1–2 per cent range and 30 per cent in the 2–3 per cent range, as compared to 27 per cent and 32 per cent, respectively, in July. In comparison with our previous forecasts, the probability of inflation rising above 3 per cent in 2019Q4 is marginally lower, falling from 29 to 25 per cent.
Note
1 WBSFS forecasts for UK output growth and inflation have been released every quarter since November 2014. Details of the releases are available at https://www2.warwick.ac.uk/fac/soc/wbs/subjects/emf/forecasting/ and a description of the models in the system and of the indicators employed is available at https://www2.warwick.ac.uk/fac/soc/wbs/subjects/emf/forecasting/summary_of_wbs_forecastng_system.pdf.
Figure 17 illustrates how the different components of GDP contribute to this slowdown. It shows the difference in growth contributions by GDP expenditure component relative to the soft Brexit case in percentage points. The initial slowdown in growth within two years of exiting the EU is mainly explained by a sharp drop in business investment, scraping 1 percentage points off real GDP growth in 2019, and 0.2 percentage points in 2020. Private consumption growth also slows down considerably, contributing only 0.5 and 0.1 percentage points to GDP growth in 2019 and 2020, respectively, i.e. 0.6–0.7 percentage point less than in the soft Brexit case. The contribution of government consumption growth is also lower.
No-deal relative to soft Brexit scenario: differences in contributions to GDP growth
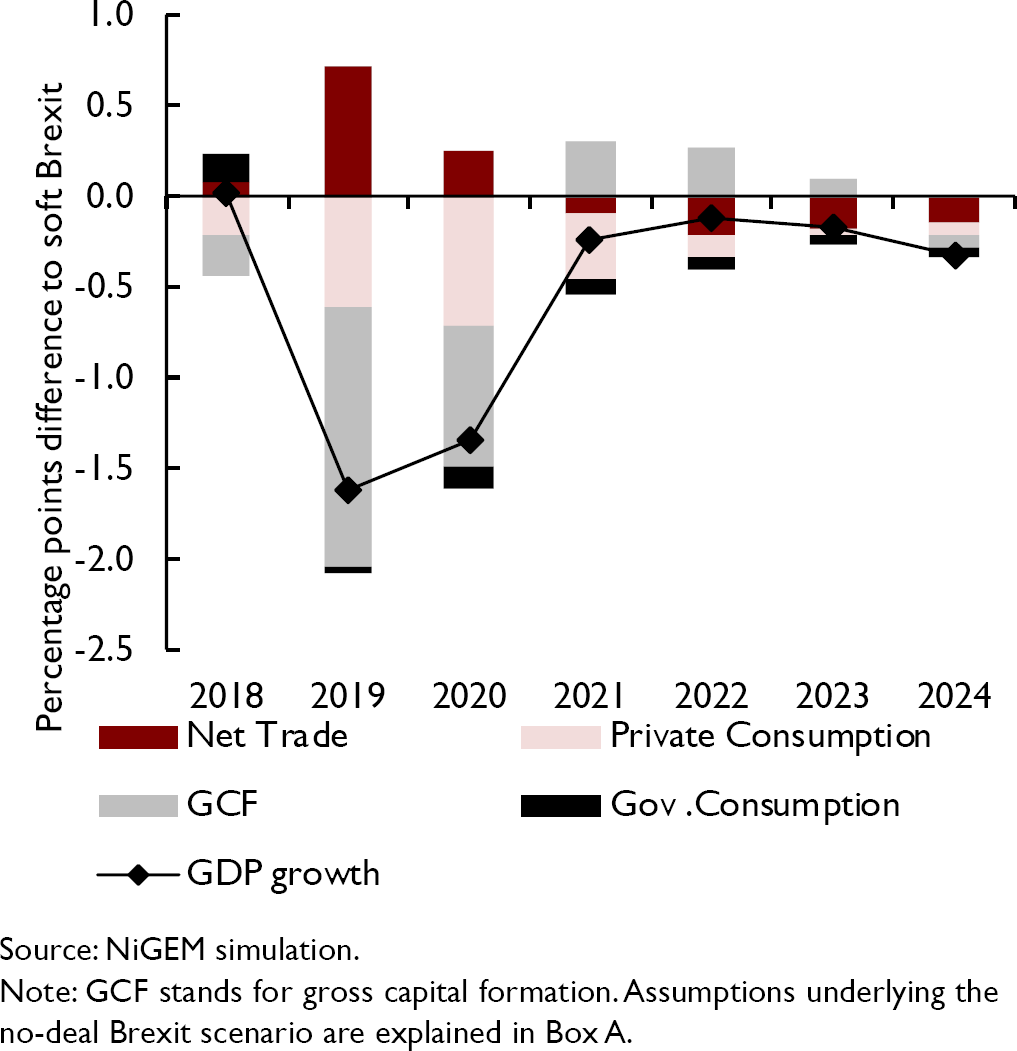
Despite the rise in trade barriers, we would expect the UK economy to rebalance more towards net trade in the short run because of a 10 per cent depreciation in the sterling effective exchange rate. This is mainly the result of a decline in imports of 8 per cent in 2019 relative to its soft Brexit level due to higher import costs, a gap that widens to 20 per cent in the long run. The fall in imports initially outweighs the loss in exports, which we assume to be around 6 per cent in 2019 but eventually also to rise to 20 per cent. Thus, net trade makes a positive contribution to real GDP growth in 2019 and 2020 but not thereafter.
Supply conditions
Productivity
Labour productivity continues to recover very gradually some of the losses made since the financial crisis but given the lack of clarity about future trading relationships with the EU, the outlook remains as uncertain as ever, both in the short and medium term. In the second quarter of 2018, output per hour increased by 0.5 per cent relative to the first quarter when it had fallen by 0.5 per cent. On an annual basis, this translated into labour productivity growth of 1.5 per cent, more than 1 percentage point above its post-crisis average growth rate. Output per worker however, increased by 0.3 per cent in the second quarter of 2018 relative to the first, and by just 0.2 per cent on an annual basis.
Looking ahead, we expect the recovery to continue in our central forecast based on soft Brexit assumptions. In particular, the expected pick-up in business investment and the resulting increase in the growth rate of the capital stock should support productivity growth. In the absence of substantial barriers to trade and migration, the annual growth rate of output per hour is forecast to stabilise at around 1½ per cent in the medium term.
However, post-Brexit trade and migration policies have the potential to change this outlook considerably. In our no-deal scenario, we assume that shocks to trade, foreign direct investment and migration inhibit productivity growth (for details see Box A). There is a large degree of uncertainty around potential effects. We calibrate a shock to total factor productivity based on empirical estimates (Reference Behrens and MionBehrens and Mion, 2017) such that after ten years output per hour is 1.4 per cent lower compared to the soft Brexit central case. This is because the reduction in trade is likely to reduce firm competition in the long term (Reference Impullitti and LicandroImpullitti and Licandro, 2017). Weak productivity growth can also be driven by a lack of demand, particularly for exports (Reference OultonOulton, 2018). A Brexit-related rise in trade barriers and a reduction in demand for UK exports has the potential to worsen the outlook for labour productivity, unless there is a substantial fall in net migration and employment to offset lower demand. The evolution of productivity growth in the short term is equally uncertain. Early evidence suggests that the depreciation of sterling since the referendum has led to less training of workers by firms exposed to higher input prices (Reference Costa, Dhingra and MachinCosta et al., 2018). This may have been a drag on productivity growth already.
Migration
Net migration of around 270,000 people added to the UK population in the year to March 2018. Of this, net migration from the EU was 90,000 people, its lowest level since 2012. A number of factors contributed to the fall in EU net migration, such as the currency depreciation, which reduced the foreign currency value of income earned in the UK and strong economic growth in other European economies. Uncertainty about future access to the UK labour market may also have played a role.
The assumption underlying our soft Brexit central forecast is that the UK population grows according to principal projections provided by the ONS. These imply a slowdown of net migration to around 200,000 people per year in the medium term.
Migration policies post-Brexit provide a risk to these population forecasts. Reference Chadha, Hantzsche and MellinaThe Migration Advisory Committee (2018) recommends a migration regime without preferential labour market access given to EU citizens while controlling the inflow of migrants in favour of those with higher skills. This however could lead to labour shortages in sectors that rely more strongly on less skilled workers (Reference Rolfe, Ahlstrom-Vij, Runge and Hudson-SharpRolfe et al., 2018). Our no-deal Brexit scenario assumes a fall in net migration to around 100,000 people per year, following the ONS’ low migration variant. We find that independent of potentially associated productivity effects, this reduction in numbers alone lowers the level of GDP by 1.7 per cent in the long run.
Wages and employment
Nominal earnings growth recently picked up with average weekly earnings (excluding bonus payments and arrears) increasing by 3.1 per cent in the three months to August, compared to twelve months earlier. The question is whether this is a sign of wage pressure building up in the economy.
On one hand, there is a case for record levels of unemployment to strengthen the bargaining position of workers and to support stronger wage growth. In the three months to August, the unemployment rate fell to 4 per cent, a level last observed in 1975. The rise in minimum wages also contributed to stronger wage growth at the bottom end of the wage distribution. In addition, part of recent nominal wage rises may be due to spillover effects from the public sector, where regular pay increased by 2.7 per cent in the three months to August, its highest growth rate since 2012, after the 1 per cent cap on pay in the sector was lifted (figure 18). Reference Dolton, Hantzsche and KaraDolton et al. (2018) estimate that a 1 per cent pay rise in the public sector tends to increase private sector wages by 0.1 per cent in the short term. A factor holding down wage growth in the recent past is productivity growth (Reference Kara and LoprestoKara and Lopresto, 2018). A faster than expected pick-up in productivity growth therefore poses an upside risk to our forecast.
Average weekly earnings growth, different measures

On the other hand, total pay, including bonus and arrear payments, increased by 2.7 per cent in the three months to August compared to a year earlier, not much different from the increases seen at the beginning of the calendar year. Real average weekly earnings growth remained subdued at 0.7 per cent in the three months to August as inflation stayed above 2 per cent. Weak wage growth may well be the flipside to the current strength in employment if it is caused by structural factors that make it easier for firms to hire and fire while depressing workers’ bargaining power (Reference HantzscheHantzsche, 2018). The persistence of factors like a decreased role for collective bargaining and employer monopsony on local labour markets is a downside risk to our wage forecast but might in the short term be an upside risk to our employment forecast.
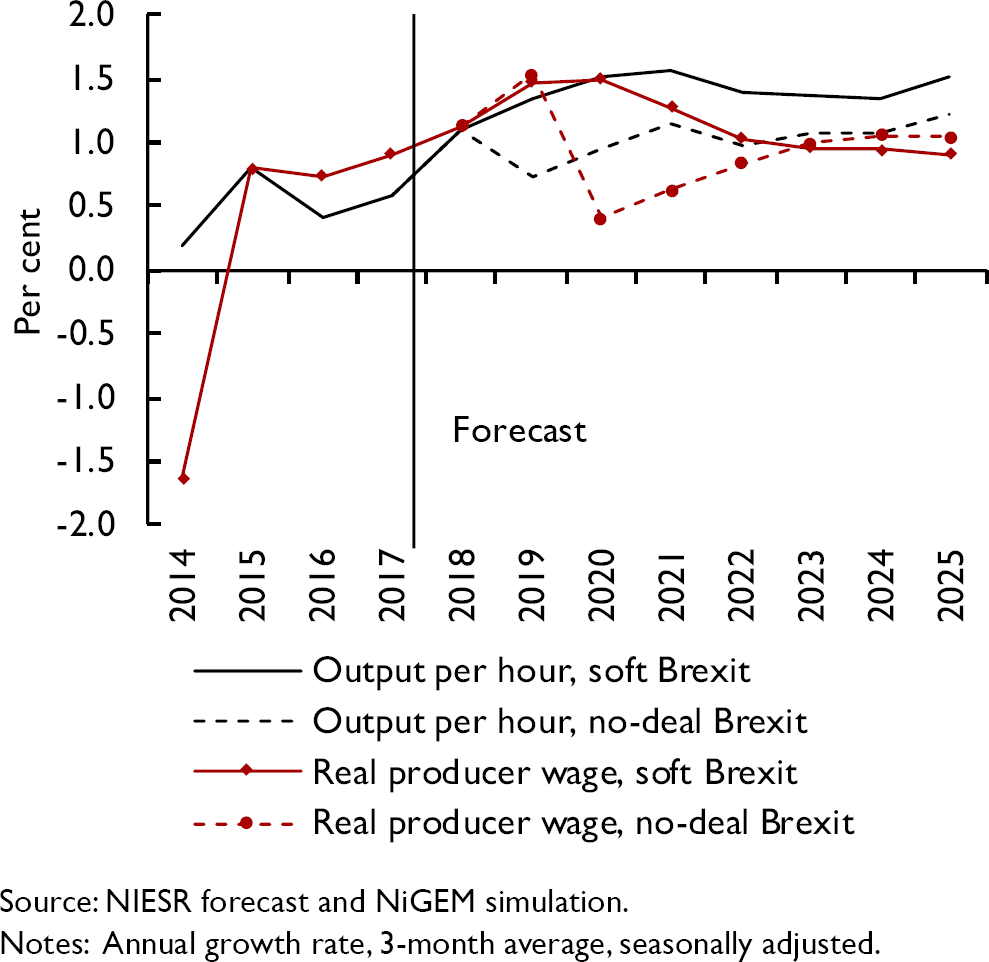
On balance, we forecast the unemployment rate to rise to around 4½ per cent in the medium term based on soft Brexit forecast assumptions. The improvement in productivity growth should further support moderate levels of wage growth (figure 19). A no-deal Brexit poses a substantial downside risk to our wages and employment forecast. The impact of disruptions to trade on the economy lifts the unemployment rate by more than 1 percentage point within a year in our alternative scenario. This and the hit to productivity growth could dampen real wage growth.
Productivity and wage growth in different Brexit scenarios
Turning minutes into measures – text-mining MPC communication
In recent years, central bankers have used various ways of communication to signal to the public how different economic issues shape their decision-making, and to steer markets’ expectations about future monetary policy. For instance, members of the Bank of England's Monetary Policy Committee express their opinion through monetary policy statements, minutes of their meetings, the Inflation Report and speeches, which are closely observed by market participants. How can we quantify the information provided that way? In this box, we illustrate how text mining techniques can be used to measure the signals conveyed by the MPC about future monetary policy. We are also able to quantify how intensely Brexit-related economic uncertainty featured in the decision-making process of the MPC.
Text mining encompasses a wide set of computational tools and advanced statistics able to provide accurate and unbiased quantitative measures of qualitative text data. We apply different text mining techniques to a corpus of Bank of England monetary policy summaries and MPC minutes spanning from January 1999 to August 2018 (228 documents in total). These documents are currently released at 12 noon on the Thursday after each MPC meeting, eight times per year. Before 2016, the MPC met monthly and in 2016 eleven times. Minutes and policy summaries inform the public about the MPC's assessment of current and future economic conditions, financial market developments, and its decision around the policy interest rate and unconventional policy instruments. Unlike policy summaries and minutes, other forms of communication, such as speeches, are published not as regularly and are structured in a less coherent way rendering them less suitable for a computer-based text analysis.
We first measure policymakers’ inclination whether to tighten or loosen policy by employing an automated search and word-counting approach of ‘hawkish words’ (e.g., increase, tighten, etc.) and ‘dovish words’ (e.g., decrease, expansionary, etc.). An index of the monetary stance is computed as the difference between hawkish and dovish words per document (see Reference Chadha, Hantzsche and MellinaChadha et al., 2018). Figure C1 plots the time series of the index of the monetary stance against the Bank Rate set by the Bank of England. It shows, for instance, that at the onset of the financial crisis in 2008, central bank communication started to become much more dovish, as indicated by negative values. It remained on balance more dovish than hawkish for most of the time since. Over the same period, long-term interest rates declined steadily. The shaded area in Figure C1 denotes the post-referendum period. In the run-up to the Brexit referendum on 23 June 2016, MPC minutes became gradually more dovish, signalling that the Bank could loosen policy should the referendum result negatively impact the economy.
Index of the monetary stance against long-term interest rates

In order to identify which economic issues and monetary policy tools were discussed at MPC meetings, we revert to an alternative method for quantifying text data: a grouping algorithm called Latent Dirichlet Allocation (LDA), proposed by Blei et al. (2003). LDA extracts latent topics in a document by inferring which words are more likely to be grouped together (see Reference Chadha, Hantzsche and MellinaChadha et al., 2018, for further details). Because the selection of words forming a topic purely depends on the probability of these words occurring together in a document, the algorithm remains agnostic as to what individual topics are and its output is therefore not contaminated by hindsight bias. Applying it to our collection of MPC minutes, the LDA algorithm singles out two topics that caught our attention. One is closely related to the Bank's Quantitative Easing programmes, where the three most likely words characterising that topic are ‘purchase’, ‘asset’, and ‘programme’. The second captures the MPC's concern about Brexit-related uncertainty and is defined by words such as ‘uncertainty’, ‘referendum’, and ‘asset’.
Figure C2 shows the frequency with which both topics feature in MPC minutes over time. We find that the MPC started heavily debating asset purchases right before the announcements of its QE programmes on 9 March 2009, 6 October 2011, and 4 August 2016. In particular after the second QE programme discussions remained elevated as the programme was twice extended in 2012 but also after the programme was concluded at the end of 2012. The QE index picks up again for the first MPC meeting after the Brexit referendum in July 2016. MPC discussions of Brexit increased drastically as the referendum date was approached and reached a first high during the April meeting in 2016. Brexit was then most heavily discussed nine days before the vote. At its second meeting after the referendum on 4 August 2016, the MPC confirmed expectations it previously set by adjusting its expectation and announced a sizeable package of policy measures to address the potential effect of Brexit-related uncertainty on the economy, including a 25 basis points rate cut, a new term funding scheme, the purchase of £10 billion of corporate bonds and of government bonds worth £60 billion.
MPC Brexit Uncertainty and QE Index

This suggests that text mining can serve as a powerful tool to quantify the signals provided by central bank communication about the monetary policy stance and topics entering the decision-making process of policymakers.
This box was prepared by Arno Hantzsche and Sathya Mellina.Prices
Having climbed above 3 per cent in 2017, consumer price inflation has eased to an average of 2.5 per cent in the third quarter of 2018 and is set to fall to 2.1 per cent next year before settling at the Bank of England's target rate of 2 per cent thereafter. That return to the target represents a shift in the balance between the inflationary effects of the recent currency depreciation and oil/commodity prices and domestic factors, such as higher wage inflation.
Recent developments
The price of Brent crude has risen by around 10 dollars per barrel since the start of August. What matters for UK households and businesses, however, is the price of oil in sterling. Over this period, the price increase in sterling is somewhat less at 8 per cent because the exchange rate has appreciated against the dollar. Alongside that there are early signs of rising wage inflation in the UK, although unit labour cost growth, which adjusts for changes in productivity and is a factor that drives the cost of production, eased to an annual growth rate of 2 per cent in the second quarter after average growth of 2.7 per cent in the previous six months. Consistent with that, the most recent PMI survey signals an increase in both input and output prices and thus, the output price balance.
Turning to the most recent CPI inflation data, our analysis shows that the fall from 2.7 per cent in August to 2.4 per cent in September is attributable to many goods and services in the consumer basket rather than a few idiosyncratic items (see NIESR press note on the CPI inflation statistics). Our measure of trimmed mean inflation, which is the arithmetic mean of all price changes once 5 per cent of the highest and lowest price changes have been excluded, has fallen by 0.1 percentage point to 0.9 per cent in September.
Outlook
Inflation dynamics beyond the short run are driven by the balance between supply and demand. As discussed above, we expect CPI inflation to ease to around the Bank of England's target of 2 per cent next year and thereafter. That forecast assumes a moderation of GDP growth to a level that is consistent with our estimate of potential, a steady increase in Bank Rate and wage growth in line with productivity. That forecast is based on a soft Brexit scenario. Under the alternative hard Brexit scenario we expect the currency to depreciate and for inflation to rise to 3.5 per cent and overshoot the target rate until 2020 (see Box A).
Sectoral balance
Sectoral balance: triple deficit
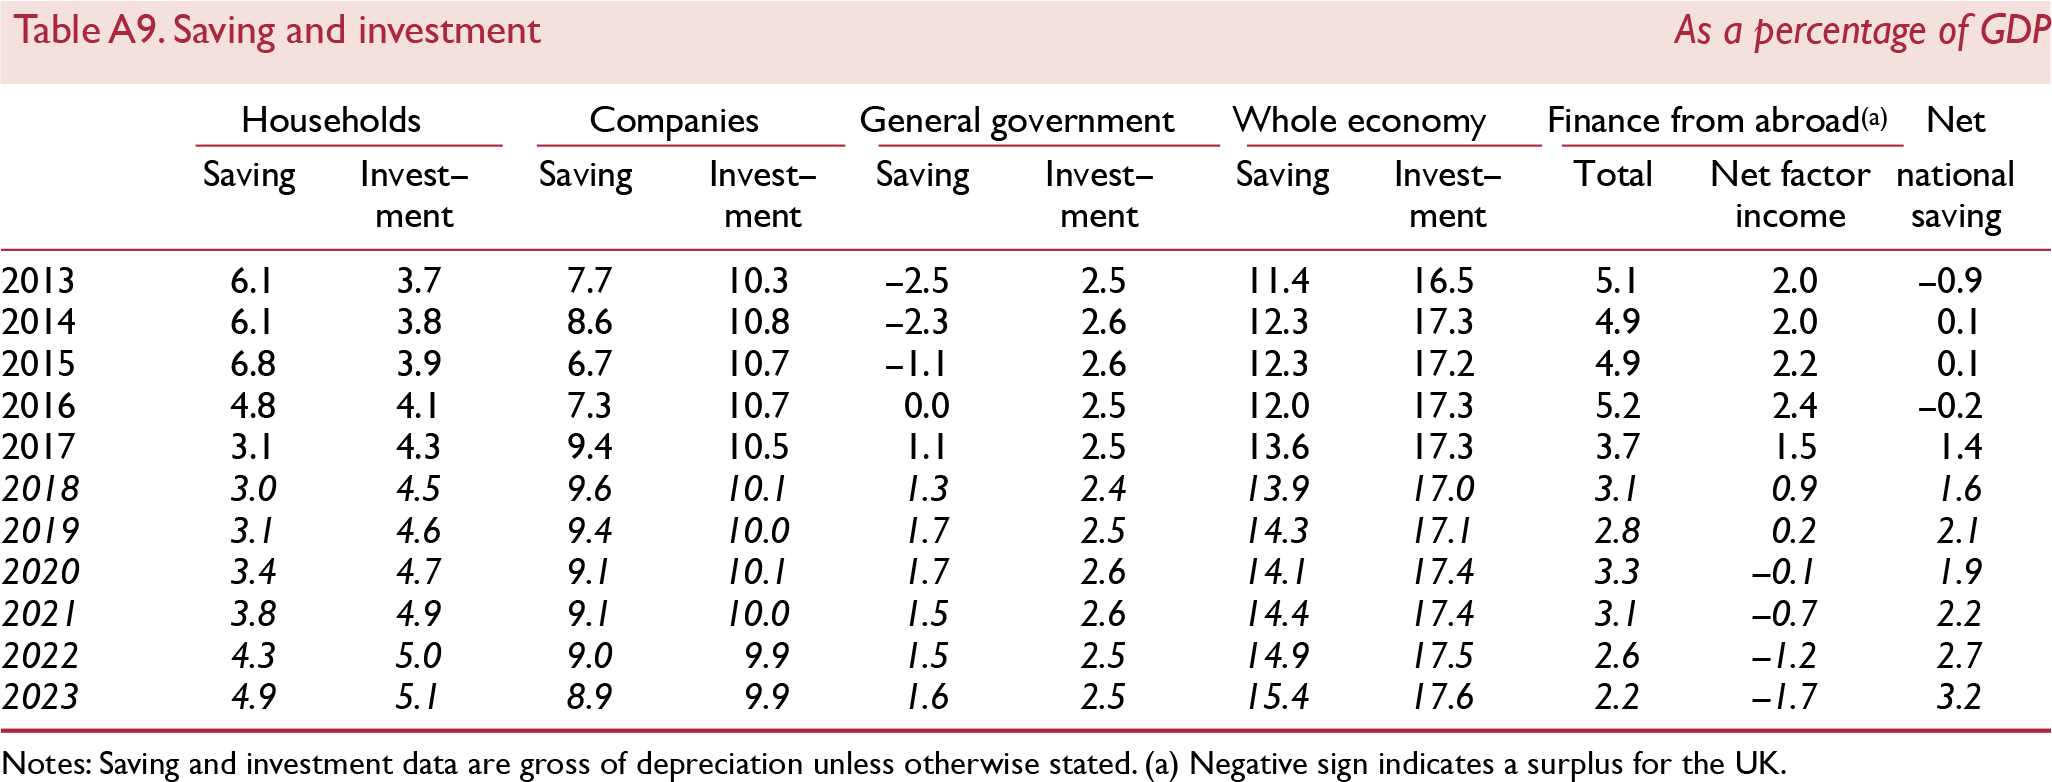
Table A9 shows the financial position of the private and public sectors of the economy and the resulting balance with the rest of the world. The private sector is further split into a household and a corporate sector. If investment is greater than saving for a sector, then this sector is a net borrower. The aggregation of these three sectors is the current account balance, which, if in deficit, implies that borrowing from the rest of the world is required in order to fund domestic investment plans. It is not possible to infer the optimality of the levels of capital from the current account but rather just the immediate financing needs of the economy. In 2017, all three domestic sectors of the economy – households, companies and government – were in deficit for the first time since at least 1987 (figure 21), and we forecast this pattern to carry on into the medium term.
CPI inflation and trimmed mean inflation

Sectoral balances

Household saving as a fraction of GDP has been falling since 2016. This erosion in savings has helped support consumer spending. In our central forecast based on soft Brexit assumptions, we expect that trend to reverse over the medium term as households look to rebuild savings from levels that are well below the long-run average. An important driver of the increase in saving will be the ongoing auto-enrolment into workplace pensions.
Household investment rose steadily from a trough of 3.2 per cent of GDP in 2009 to 4.3 per cent of GDP in 2017, which is similar to the pre-crisis high of 4.5 per cent in 2006–7. With demand for housing still growing strongly, we project household investment to increase in each subsequent year and to reach 5 per cent of GDP in 2022. The saving and investment positions of the household sector imply that in 2017 households required 1.2 per cent of GDP in funding from the rest of the economy. This represents the first time since at least 1987 that the household sector was a net borrower. With both household saving and investment growing slowly, we expect households to return to a near-balanced net position in the medium term.
On the corporate side, saving rebounded strongly in 2017, rising to 9½ per cent of GDP from 7½ per cent in 2016. This was driven by an increase in corporate profits both in manufacturing and in the oil and natural gas exploration and extraction sector. We forecast corporate saving to GDP to remain close to 9 per cent in the medium term as the headwinds from Brexit ease in our soft Brexit scenario. The corporate investment ratio was steady at around 10½ per cent of GDP in 2017. Conditional on a ‘soft Brexit’ assumption, we forecast corporate investment to remain at about 10 per cent of GDP in the medium term, and therefore the corporate sector still to require about 1 per cent of GDP of net financing from the rest of the economy over the same time horizon.
Government sector dis-saving, which reached a peak in 2009 of around 5½ per cent of GDP, has vanished in 2016 as a result of the ongoing fiscal consolidation. We now expect saving to be steady at about 1–2 per cent of GDP from 2018 to 2022. This represents a deviation from the OBR forecast and reflects our belief that the government will slow the pace of fiscal consolidation from 2019 onwards. Government investment stayed stable in 2017 at 2½ per cent of GDP and we have maintained our estimate of 2½ per cent of GDP over the forecast horizon. As a result of constant saving and investment, we now expect the government to remain in a net borrowing position of 1 per cent of GDP until 2022, after having borrowed 1.4 per cent in 2017.
To finance the triple deficit of the household, corporate and government sectors, the domestic economy had to borrow 3.7 per cent of GDP in 2017 from the rest of the world, the lowest ratio since 2012 but high compared with other G7 economies or the Euro Area. The current account balance is forecast to stabilise at around 2½ per cent of GDP in 2022.
Appendix – Forecast details