


1. Introduction
Galaxy clusters are the most massive virialised structures in the present-day Universe; in hierarchical cosmologies such as the $\Lambda$
Cold Dark Matter model they assemble relatively recently, with typical formation redshifts of
$\Lambda$
Cold Dark Matter model they assemble relatively recently, with typical formation redshifts of $z_{\text{form}}\simeq 0.5$
(e.g. Hahn et al. Reference Hahn, Porciani, Marcella Carollo and Dekel2007; Li, Mo, & Gao Reference Li, Mo and Gao2008; Power et al. Reference Power, Knebe and Knollmann2012). Clusters sit at the nodes of the cosmic web, accreting material from filaments, which is evident in the relative positions and orbits of infalling galaxies and groups (e.g. Tempel et al. Reference Tempel, Guo, Kipper and Libeskind2015) and in accretion shocks in the hot intracluster medium (hereafter ICM; e.g. Burns, Skillman, & O’Shea Reference Burns, Skillman and O’Shea2010; Brown & Rudnick Reference Brown and Rudnick2011; Power, Knebe, & Knollmann Reference Power, Knebe and Knollmann2020).
$z_{\text{form}}\simeq 0.5$
(e.g. Hahn et al. Reference Hahn, Porciani, Marcella Carollo and Dekel2007; Li, Mo, & Gao Reference Li, Mo and Gao2008; Power et al. Reference Power, Knebe and Knollmann2012). Clusters sit at the nodes of the cosmic web, accreting material from filaments, which is evident in the relative positions and orbits of infalling galaxies and groups (e.g. Tempel et al. Reference Tempel, Guo, Kipper and Libeskind2015) and in accretion shocks in the hot intracluster medium (hereafter ICM; e.g. Burns, Skillman, & O’Shea Reference Burns, Skillman and O’Shea2010; Brown & Rudnick Reference Brown and Rudnick2011; Power, Knebe, & Knollmann Reference Power, Knebe and Knollmann2020).
A commonly used measure of the physical state of a cluster’s ICM is the entropy, K, which is defined as,
 \begin{equation}K \equiv \frac{k_\mathrm{B}T}{n_\mathrm{e}^{2/3}}\end{equation}
(cf. Cavaliere & Lapi Reference Cavaliere and Lapi2013); here $k_\mathrm{B}$
is the Boltzmann constant, T is the ICM gas temperature, and
$k_\mathrm{B}$
is the Boltzmann constant, T is the ICM gas temperature, and $n_\mathrm{e}$
is the electron number density, which is related to the ICM gas density. High-resolution X-ray observations, including XMM-Newton (e.g. Jansen et al. Reference Jansen2001), Chandra (e.g. Weisskopf et al. Reference Weisskopf, Tananbaum, Van Speybroeck, O’Dell, Truemper and Aschenbach2000), and eROSITA (e.g. Predehl et al. Reference Predehl2021) have allowed the radial variation of cluster entropy to be studied in detail, and consequently the functional form of the entropy with respect to the radius r, K(r), is well understood (e.g. Panagoulia et al. Reference Panagoulia, Fabian, Sanders and Hlavacek-Larrondo2014; Hogan et al. Reference Hogan, McNamara, Pulido, Nulsen, Russell, Vantyghem, Edge and Main2017; McDonald et al. Reference McDonald2019; Zhu et al. Reference Zhu2021). K(r) can be characterised by its logarithmic slope, k, which is defined as,
$n_\mathrm{e}$
is the electron number density, which is related to the ICM gas density. High-resolution X-ray observations, including XMM-Newton (e.g. Jansen et al. Reference Jansen2001), Chandra (e.g. Weisskopf et al. Reference Weisskopf, Tananbaum, Van Speybroeck, O’Dell, Truemper and Aschenbach2000), and eROSITA (e.g. Predehl et al. Reference Predehl2021) have allowed the radial variation of cluster entropy to be studied in detail, and consequently the functional form of the entropy with respect to the radius r, K(r), is well understood (e.g. Panagoulia et al. Reference Panagoulia, Fabian, Sanders and Hlavacek-Larrondo2014; Hogan et al. Reference Hogan, McNamara, Pulido, Nulsen, Russell, Vantyghem, Edge and Main2017; McDonald et al. Reference McDonald2019; Zhu et al. Reference Zhu2021). K(r) can be characterised by its logarithmic slope, k, which is defined as,
 \begin{equation} k \equiv \frac{\mathrm{d} \ln K}{\mathrm{d} \ln r},\end{equation}
which is itself a function of radius.
Observationally we find that K is consistent with being a power-law near $R_{500}$
such that
$R_{500}$
such that $k \simeq 1.1$
(see, e.g. Babyk et al. Reference Babyk, McNamara, Nulsen, Russell, Vantyghem, Hogan and Pulido2018; Ghirardini et al. Reference Ghirardini2019); here
$k \simeq 1.1$
(see, e.g. Babyk et al. Reference Babyk, McNamara, Nulsen, Russell, Vantyghem, Hogan and Pulido2018; Ghirardini et al. Reference Ghirardini2019); here $R_{\text{500,crit}}$
is the radius at which the enclosed matter density is 500 times the critical density,
$R_{\text{500,crit}}$
is the radius at which the enclosed matter density is 500 times the critical density, $\rho_{\text{crit}}=3H^2/8\pi\,G$
. This power-law behaviour is recovered in hydrodynamical cosmological simulations (e.g. Voit, Kay, & Bryan Reference Voit, Kay and Bryan2005), independent of hydrodynamics solver and galaxy formation model (e.g. Sembolini et al. Reference Sembolini2016). At larger radius, simulations predict that K(r) reaches a maximum at
$\rho_{\text{crit}}=3H^2/8\pi\,G$
. This power-law behaviour is recovered in hydrodynamical cosmological simulations (e.g. Voit, Kay, & Bryan Reference Voit, Kay and Bryan2005), independent of hydrodynamics solver and galaxy formation model (e.g. Sembolini et al. Reference Sembolini2016). At larger radius, simulations predict that K(r) reaches a maximum at $\simeq$ $1.6\,R_{\text{200,mean}}$
, where
$1.6\,R_{\text{200,mean}}$
, where $R_{\text{200,mean}}$
encloses a mean matter density that is 200 times the cosmological mean matter density,
$R_{\text{200,mean}}$
encloses a mean matter density that is 200 times the cosmological mean matter density, $\rho_{\text{mean}}=\Omega_{\text{m}}\rho_{\text{crit}}$
, where
$\rho_{\text{mean}}=\Omega_{\text{m}}\rho_{\text{crit}}$
, where $\Omega_{\text{m}}$
is the matter density parameter (cf. Lau et al. Reference Lau, Nagai, Avestruz, Nelson and Vikhlinin2015). We note that this predicted radius is larger than that inferred from observational data (cf. Walker et al. Reference Walker, Fabian, Sanders and George2012), which indicate that the entropy profile reaches its maximum closer to
$\Omega_{\text{m}}$
is the matter density parameter (cf. Lau et al. Reference Lau, Nagai, Avestruz, Nelson and Vikhlinin2015). We note that this predicted radius is larger than that inferred from observational data (cf. Walker et al. Reference Walker, Fabian, Sanders and George2012), which indicate that the entropy profile reaches its maximum closer to $R_{\text{200,crit}}\equiv\,R_{200}$
, the radius enclosing a mean matter density of 200
$R_{\text{200,crit}}\equiv\,R_{200}$
, the radius enclosing a mean matter density of 200 $\rho_{\text{crit}}$
. Regardless, the presence of a turnover in the entropy profile is interpreted as arising from infalling gas from the cosmic web generating an accretion shock at the ‘shock radius’,
$\rho_{\text{crit}}$
. Regardless, the presence of a turnover in the entropy profile is interpreted as arising from infalling gas from the cosmic web generating an accretion shock at the ‘shock radius’, $r_{\text{shock}}$
, which is consistent with empirical measurements of the interface between cluster outskirts and filaments in the cosmic web (e.g. Kawaharada et al. Reference Kawaharada2010). For this reason we can regard
$r_{\text{shock}}$
, which is consistent with empirical measurements of the interface between cluster outskirts and filaments in the cosmic web (e.g. Kawaharada et al. Reference Kawaharada2010). For this reason we can regard $r_{\text{shock}}$
as a characteristic measure of the boundary between a cluster’s accreted gas reservoir and gas in the process of accreting from the cosmic web.
$r_{\text{shock}}$
as a characteristic measure of the boundary between a cluster’s accreted gas reservoir and gas in the process of accreting from the cosmic web.
The splashback radius, $r_{\text{splash}}$
, provides an analogous characteristic measure of the boundary between collisionless material – dark matter and galaxies – that is orbiting within a cluster’s potential and material that is infalling for the first time (e.g. More, Diemer, & Kravtsov Reference More, Diemer and Kravtsov2015; Mansfield, Kravtsov, & Diemer Reference Mansfield, Kravtsov and Diemer2017; Diemer et al. Reference Diemer, Mansfield, Kravtsov and More2017; Deason et al. Reference Deason2021). By convention,
$r_{\text{splash}}$
, provides an analogous characteristic measure of the boundary between collisionless material – dark matter and galaxies – that is orbiting within a cluster’s potential and material that is infalling for the first time (e.g. More, Diemer, & Kravtsov Reference More, Diemer and Kravtsov2015; Mansfield, Kravtsov, & Diemer Reference Mansfield, Kravtsov and Diemer2017; Diemer et al. Reference Diemer, Mansfield, Kravtsov and More2017; Deason et al. Reference Deason2021). By convention, $r_{\text{splash}}$
is defined as the radius at which the logarithmic slope of the spherically averaged density profile reaches its minimum value. Observational estimates of
$r_{\text{splash}}$
is defined as the radius at which the logarithmic slope of the spherically averaged density profile reaches its minimum value. Observational estimates of $r_{\text{splash}}$
using, for example, the luminosity density profile, galaxy number densities, and weak lensing measurements (e.g. Chang et al. Reference Chang2018; Bianconi et al. Reference Bianconi, Buscicchio, Smith, McGee, Haines, Finoguenov and Babul2021; Gonzalez et al. Reference Gonzalez, George, Connor, Deason, Donahue, Montes, Zabludoff and Zaritsky2021) indicate good consistency between simulation predictions and observationally inferred values, although observational estimates will be sensitive to a cluster’s dynamical state and the structure of the cosmic web in which it is embedded (e.g. Lebeau et al. Reference Lebeau, Ettori, Aghanim and Sorce2024).
$r_{\text{splash}}$
using, for example, the luminosity density profile, galaxy number densities, and weak lensing measurements (e.g. Chang et al. Reference Chang2018; Bianconi et al. Reference Bianconi, Buscicchio, Smith, McGee, Haines, Finoguenov and Babul2021; Gonzalez et al. Reference Gonzalez, George, Connor, Deason, Donahue, Montes, Zabludoff and Zaritsky2021) indicate good consistency between simulation predictions and observationally inferred values, although observational estimates will be sensitive to a cluster’s dynamical state and the structure of the cosmic web in which it is embedded (e.g. Lebeau et al. Reference Lebeau, Ettori, Aghanim and Sorce2024).
The question arises naturally as to the relationship between $r_{\text{shock}}$
and
$r_{\text{shock}}$
and $r_{\text{splash}}$
. Both are characteristic of the growth of clusters by the accretion of material from their surroundings. Analytical models have assumed that
$r_{\text{splash}}$
. Both are characteristic of the growth of clusters by the accretion of material from their surroundings. Analytical models have assumed that $r_{\text{shock}}$
and
$r_{\text{shock}}$
and $r_{\text{splash}}$
are coincident (e.g. Patej & Loeb Reference Patej and Loeb2015, who assume that the shock in the hot gas profile is coincident with a break in the dark matter profile). However,
$r_{\text{splash}}$
are coincident (e.g. Patej & Loeb Reference Patej and Loeb2015, who assume that the shock in the hot gas profile is coincident with a break in the dark matter profile). However, $r_{\text{shock}}$
arises because of the collisional nature of accreting gas whereas
$r_{\text{shock}}$
arises because of the collisional nature of accreting gas whereas $r_{\text{splash}}$
is a result of the complex dynamics of collisionless components in an evolving gravitational potential, and so it’s likely that instances in which
$r_{\text{splash}}$
is a result of the complex dynamics of collisionless components in an evolving gravitational potential, and so it’s likely that instances in which $r_{\text{shock}}$
and
$r_{\text{shock}}$
and $r_{\text{splash}}$
are coincident and infrequent at cluster mass scales.
$r_{\text{splash}}$
are coincident and infrequent at cluster mass scales.
The goal of this paper is to quantify the relationship between $r_{\text{shock}}$
and
$r_{\text{shock}}$
and $r_{\text{splash}}$
and its predicted variation with mass and recent accretion history using a statistical sample of massive galaxy clusters from The Three Hundred collaboration’s simulation suite (cf. Cui et al. Reference Cui2018, Reference Cui2022). This is a mass complete sample of clusters drawn from a 1
$r_{\text{splash}}$
and its predicted variation with mass and recent accretion history using a statistical sample of massive galaxy clusters from The Three Hundred collaboration’s simulation suite (cf. Cui et al. Reference Cui2018, Reference Cui2022). This is a mass complete sample of clusters drawn from a 1 $h^{-1}$
Gpc box, which have a diversity of assembly histories and larger-scale environments.
$h^{-1}$
Gpc box, which have a diversity of assembly histories and larger-scale environments.
In the following sections, we describe briefly The Three Hundred project and our approach to calculating $r_{\text{shock}}$
and
$r_{\text{shock}}$
and $r_{\text{splash}}$
(Section 2). We present the measured relationship between
$r_{\text{splash}}$
(Section 2). We present the measured relationship between $r_{\text{shock}}$
and
$r_{\text{shock}}$
and $r_{\text{splash}}$
and their variation with cluster mass and accretion rate (Section 3), and we discuss our results in the context of previous work (Section 4). Finally, we summarise our main findings in Section 5.
$r_{\text{splash}}$
and their variation with cluster mass and accretion rate (Section 3), and we discuss our results in the context of previous work (Section 4). Finally, we summarise our main findings in Section 5.
2. The simulated dataset
We use the 324 clusters from the latest GIZMO-Simba runs – hereafter GIZMO-Simba-7k (Cui et al. in Preparation) – of The Three Hundred collaboration’s suite of zoom simulations of galaxy clusters (cf. Cui et al. Reference Cui2018). These are a higher resolution extension – with re-calibrated galaxy formation prescriptions – of the GIZMO-Simba runs – hereafter GIZMO-Simba-3k – presented in Cui et al. (Reference Cui2022). GIZMO-Simba-3k modelled galaxy formation processes (radiative cooling, star formation and feedback, black hole formation and growth, multiple modes of black hole feedback) using a variant of the SIMBA galaxy formation model presented in Davé et al. (Reference Davé, Anglés-Alcázar, Narayanan, Li, Rafieferantsoa and Appleby2019), calibrated for cluster scales as detailed in Cui et al. (Reference Cui2022), and run with GIZMO (Hopkins Reference Hopkins2015). GIZMO-Simba-7k uses an updated version of the SIMBA model – SIMBA-C (Hough et al. Reference Hough, Rennehan, Kobayashi, Ilani Loubser, Davé, Babul and Cui2023), which adopts the advanced chemical enrichment model of Kobayashi, Karakas, & Lugaro (Reference Kobayashi, Karakas and Lugaro2020). SIMBA-C also includes several other modifications, including a jet velocity that depends on the host dark matter halo’s mass via the approximate escape velocity and a lower black hole seeding mass ( $M_\ast \gtrsim 6 \times 10^6\,\mathrm{ M}_\odot$
compared to
$M_\ast \gtrsim 6 \times 10^6\,\mathrm{ M}_\odot$
compared to $M_\ast \gtrsim 5 \times 10^9\,\mathrm{M}_\odot$
in SIMBA). We refer interested readers to Hough et al. (Reference Hough, Rennehan, Kobayashi, Ilani Loubser, Davé, Babul and Cui2023) for more details. We note that the calibration of GIZMO-Simba-7k considered both the stellar and gas properties of the cluster, unlike GIZMO-Simba-3k, which was calibrated against only stellar properties; this produce improved ICM properties in GIZMO-Simba-7k.
$M_\ast \gtrsim 5 \times 10^9\,\mathrm{M}_\odot$
in SIMBA). We refer interested readers to Hough et al. (Reference Hough, Rennehan, Kobayashi, Ilani Loubser, Davé, Babul and Cui2023) for more details. We note that the calibration of GIZMO-Simba-7k considered both the stellar and gas properties of the cluster, unlike GIZMO-Simba-3k, which was calibrated against only stellar properties; this produce improved ICM properties in GIZMO-Simba-7k.
These clusters form a mass complete sample at z=0 in the MultiDark Planck 2 simulation (Klypin et al. Reference Klypin, Yepes, Gottlöber and Prada2016), a $1 h^{-1}$
Gpc box on a side. They have virial masses in the range
$1 h^{-1}$
Gpc box on a side. They have virial masses in the range $6.4 \times 10^{14} h^{-1}\,\mathrm{M}_{\odot} \lesssim M_{200} \lesssim 2.6 \times 10^{15} h^{-1}\,\mathrm{M}_{\odot}$
, where
$6.4 \times 10^{14} h^{-1}\,\mathrm{M}_{\odot} \lesssim M_{200} \lesssim 2.6 \times 10^{15} h^{-1}\,\mathrm{M}_{\odot}$
, where $M_{200}$
is the mass corresponding to an overdensity criterion of 200 times the critical density at that epoch. The zoom region extends 15
$M_{200}$
is the mass corresponding to an overdensity criterion of 200 times the critical density at that epoch. The zoom region extends 15 $h^{-1}$
Mpc from the centre of the cluster at z=0, corresponding to several virial radii; dark matter and gas cell masses in this region are
$h^{-1}$
Mpc from the centre of the cluster at z=0, corresponding to several virial radii; dark matter and gas cell masses in this region are $m_\textrm{dm} \simeq 10^8 h^{-1}\,\mathrm{M}_{\odot}$
and
$m_\textrm{dm} \simeq 10^8 h^{-1}\,\mathrm{M}_{\odot}$
and $m_\textrm{gas} \simeq 2 \times 10^7 h^{-1}\,\mathrm{M}_{\odot}$
, respectively. The adopted cosmological parameters are
$m_\textrm{gas} \simeq 2 \times 10^7 h^{-1}\,\mathrm{M}_{\odot}$
, respectively. The adopted cosmological parameters are $(\Omega_{\text{m}},\Omega_{\text{B}},\Omega_{\Lambda},h,\sigma_8)=(0.307, 0.048, 0.693, 0.678, 0.823)$
.
$(\Omega_{\text{m}},\Omega_{\text{B}},\Omega_{\Lambda},h,\sigma_8)=(0.307, 0.048, 0.693, 0.678, 0.823)$
.
For each cluster, we use group catalogues constructed with the AHF halo finder (cf. Knollmann & Knebe Reference Knollmann and Knebe2009), which includes information about the stellar and gas content of the main halo and its substructures. We compute radial profiles for the mass density and gas entropy using 100 equally spaced logarithmic bins between minimum and maximum cluster-centric radii of 0.5 $R_{200}$
and 5
$R_{200}$
and 5 $R_{200}$
; here the centre is the density-weighted centre of the adaptive mesh refinement grid in AHF. The presence of substructure in the outskirts of the halo can bias estimates of the logarithmic slope, which influences the value of
$R_{200}$
; here the centre is the density-weighted centre of the adaptive mesh refinement grid in AHF. The presence of substructure in the outskirts of the halo can bias estimates of the logarithmic slope, which influences the value of $r_{\text{splash}}$
. To avoid this, we evaluate the density and mass-weighted temperature in 48 angular segments within each radial bin and take the median value within the bin as our estimate of the density and temperature at that radius. With this information we can estimate the entropy in a given radial bin following Equation (1). Note that for each gas elementFootnote
a
in the cluster we have an associated internal energy per unit mass,
$r_{\text{splash}}$
. To avoid this, we evaluate the density and mass-weighted temperature in 48 angular segments within each radial bin and take the median value within the bin as our estimate of the density and temperature at that radius. With this information we can estimate the entropy in a given radial bin following Equation (1). Note that for each gas elementFootnote
a
in the cluster we have an associated internal energy per unit mass, $u=3k_\textrm{B}T/(2\mu m_\textrm{p})$
, from which we can estimate the temperature, and a local density,
$u=3k_\textrm{B}T/(2\mu m_\textrm{p})$
, from which we can estimate the temperature, and a local density, $\rho=\mu_\textrm{e}m_\textrm{p}n_\textrm{e}$
; here
$\rho=\mu_\textrm{e}m_\textrm{p}n_\textrm{e}$
; here $\mu$
and
$\mu$
and $\mu_\textrm{e}$
are the mean molecular weights of the gas and the electrons, respectively, and
$\mu_\textrm{e}$
are the mean molecular weights of the gas and the electrons, respectively, and $m_\textrm{p}$
is the proton mass. The profiles and their logarithmic slopes are smoothed by a Gaussian filter to allow for reliable identification of maxima and minima.
$m_\textrm{p}$
is the proton mass. The profiles and their logarithmic slopes are smoothed by a Gaussian filter to allow for reliable identification of maxima and minima.
Note that there are two different definitions for shock radius in the literature – one defined by the radius at which the entropy profile reaches its maximum or ‘peak’ (cf. Lau et al. Reference Lau, Nagai, Avestruz, Nelson and Vikhlinin2015), which we indicate by $r_{\text{shock,p}}$
, and one defined by the radius at which the logarithmic slope of the entropy profile is a minimum (cf. Shi Reference Shi2016), which we indicate by
$r_{\text{shock,p}}$
, and one defined by the radius at which the logarithmic slope of the entropy profile is a minimum (cf. Shi Reference Shi2016), which we indicate by $r_{\text{shock,m}}$
. We provide predictions for both
$r_{\text{shock,m}}$
. We provide predictions for both $r_{\text{shock,p}}$
and
$r_{\text{shock,p}}$
and $r_{\text{shock,m}}$
.
$r_{\text{shock,m}}$
.
3. Results
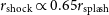
Heavy solid, red solid, dashed, dotted and dot-dashed circles indicate $R_\textrm{200,crit}$
,
$R_\textrm{200,crit}$
, $R_\textrm{200,mean}$
,
$R_\textrm{200,mean}$
, $r_{\text{splash}}$
,
$r_{\text{splash}}$
, $r_{\text{shock,p}}$
, and
$r_{\text{shock,p}}$
, and $r_{\text{shock,m}}$
, respectively.
$r_{\text{shock,m}}$
, respectively.
We begin with a visual impression of the most massive cluster in our sample, showing the relative positions of $r_{\text{splash}}$
,
$r_{\text{splash}}$
, $r_{\text{shock,p}}$
, and
$r_{\text{shock,p}}$
, and $r_{\text{shock,m}}$
. This cluster has a z=0 virial mass of
$r_{\text{shock,m}}$
. This cluster has a z=0 virial mass of $M_{200}$
=
$M_{200}$
= $2.82\times 10^{15} h^{-1}\,\mathrm{M}_{\odot}$
and virial radius of
$2.82\times 10^{15} h^{-1}\,\mathrm{M}_{\odot}$
and virial radius of $R_{200, \rm crit}=2.298 h^{-1} \rm Mpc$
. Although it is not currently undergoing a significant merger, it has accreted 75% of its mass since z=0.5, which indicates that it has a high recent accretion rate. In Fig. 1, we show projections of the distribution of dark matter (top panel), gas (middle panel), and stars (lower panel) around the most massive cluster in our sample at z=0 within a comoving cube of size 20
$R_{200, \rm crit}=2.298 h^{-1} \rm Mpc$
. Although it is not currently undergoing a significant merger, it has accreted 75% of its mass since z=0.5, which indicates that it has a high recent accretion rate. In Fig. 1, we show projections of the distribution of dark matter (top panel), gas (middle panel), and stars (lower panel) around the most massive cluster in our sample at z=0 within a comoving cube of size 20 $h^{-1}$
Mpc. In each of the panels, the heavy solid, red solid, and heavy dashed circles indicate the virial radii,
$h^{-1}$
Mpc. In each of the panels, the heavy solid, red solid, and heavy dashed circles indicate the virial radii, $R_{200}=2.30 h^{-1} \rm{Mpc}$
and
$R_{200}=2.30 h^{-1} \rm{Mpc}$
and $R_\textrm{200,mean}=3.81 h^{-1} \rm{Mpc}$
, and splashback radius,
$R_\textrm{200,mean}=3.81 h^{-1} \rm{Mpc}$
, and splashback radius, $r_{\text{splash}}=1.61 R_{200}$
for dark matter; if not specified,
$r_{\text{splash}}=1.61 R_{200}$
for dark matter; if not specified, $R_\textrm{200}$
indicates
$R_\textrm{200}$
indicates $R_\textrm{200,crit}$
throughout this paper. The heavy dotted and dot-dashed circle in the middle panel (projected gas distribution) indicate the two definitions of shock radius,
$R_\textrm{200,crit}$
throughout this paper. The heavy dotted and dot-dashed circle in the middle panel (projected gas distribution) indicate the two definitions of shock radius, $r_{\text{shock,p}}=2.17 R_{200}$
and
$r_{\text{shock,p}}=2.17 R_{200}$
and $r_{\text{shock,m}}=2.95 R_{200}$
, respectively. For completeness, we also estimate
$r_{\text{shock,m}}=2.95 R_{200}$
, respectively. For completeness, we also estimate $r_{\text{splash}}=1.93 R_{200}$
for the gas profile and
$r_{\text{splash}}=1.93 R_{200}$
for the gas profile and $r_{\text{splash}}=1.71 R_{200}$
for stellar profile. It’s interesting to note that, for this particular cluster, the splashback radius of the gas is within
$r_{\text{splash}}=1.71 R_{200}$
for stellar profile. It’s interesting to note that, for this particular cluster, the splashback radius of the gas is within $\sim$
10% of the shock radius defined relative to the peak of the entropy profile; the splashback radii of the dark matter and stars are within 5% of each other, as we might expect given their collisionless nature; and the splashback radius of the dark matter is
$\sim$
10% of the shock radius defined relative to the peak of the entropy profile; the splashback radii of the dark matter and stars are within 5% of each other, as we might expect given their collisionless nature; and the splashback radius of the dark matter is $\sim$
20% smaller than that of the gas. For reference, the radial (dark matter, stellar, gas) density and gas entropy profiles used to estimate
$\sim$
20% smaller than that of the gas. For reference, the radial (dark matter, stellar, gas) density and gas entropy profiles used to estimate $r_{\text{splash}}$
and
$r_{\text{splash}}$
and $r_{\text{shock}}$
are shown in Fig. 2.
$r_{\text{shock}}$
are shown in Fig. 2.
Projected dark matter, gas, and stellar densities (top to bottom) at $z=0$
in the most massive cluster in our sample within a cubic region 20
$z=0$
in the most massive cluster in our sample within a cubic region 20 $h^{-1}$
Mpc, centred on the density-weighted centred of AHF’s adaptive mesh refinement grid. The dark matter halo’s mass and radius are
$h^{-1}$
Mpc, centred on the density-weighted centred of AHF’s adaptive mesh refinement grid. The dark matter halo’s mass and radius are $M_{200}=2.82\times 10^{15} h^{-1}M_{\odot}$
and
$M_{200}=2.82\times 10^{15} h^{-1}M_{\odot}$
and $R_{200, crit}=2.298 h^{-1} \rm Mpc$
, and it has accreted 75% of its present day mass since
$R_{200, crit}=2.298 h^{-1} \rm Mpc$
, and it has accreted 75% of its present day mass since $z=0.5$
.
$z=0.5$
.
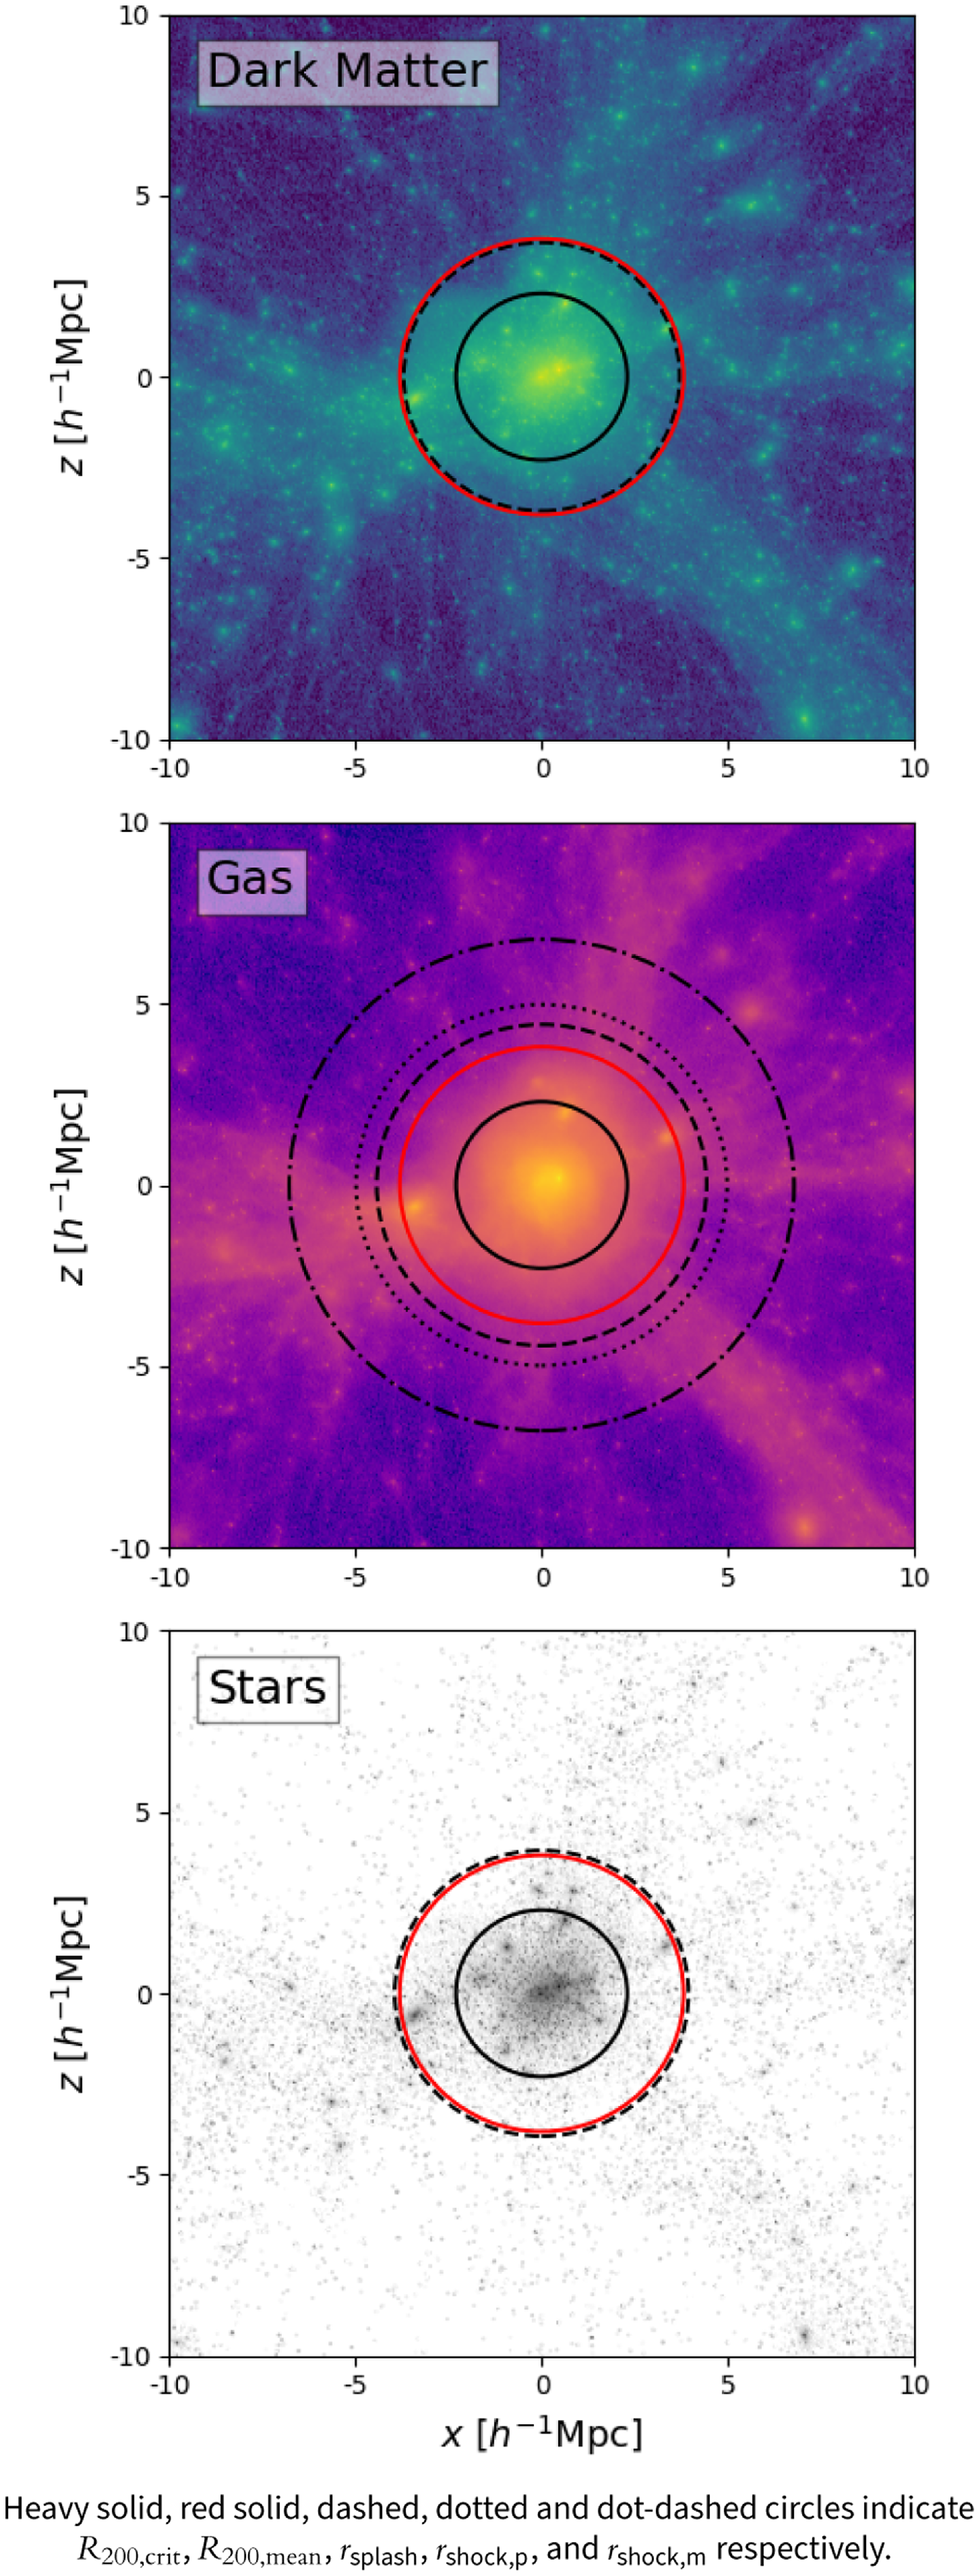
Density (top) and gas entropy (bottom) radial profiles, along with their logarithmic slopes (lower panels) for the cluster shown in Fig. 1. Dashed vertical lines in the top panel correspond to $r_\mathrm{splash}=1.61 R_{200}$
(blue) for dark matter,
$r_\mathrm{splash}=1.61 R_{200}$
(blue) for dark matter, $r_\mathrm{splash}=1.93 R_{200}$
(purple) for gas,
$r_\mathrm{splash}=1.93 R_{200}$
(purple) for gas, $r_\mathrm{splash}=1.71 R_{200}$
(grey) for stars, respectively. Dotted, and dot-dashed vertical lines in the bottom panel correspond to
$r_\mathrm{splash}=1.71 R_{200}$
(grey) for stars, respectively. Dotted, and dot-dashed vertical lines in the bottom panel correspond to $r_{\text{shock,p}}=2.17 R_{200}$
and
$r_{\text{shock,p}}=2.17 R_{200}$
and $r_{\text{shock,m}}=2.95 R_{200}$
, respectively.
$r_{\text{shock,m}}=2.95 R_{200}$
, respectively.

This trend – for $R_{200}\lt r_{\text{splash}}\lt r_{\text{shock,p}}\lt r_{\text{shock,m}}$
– is characteristic of the typical cluster in this sample. We demonstrate this in Fig. 3 in which we show the median dark matter density profiles (blue curves and shaded regions; top) and gas entropy profiles (red curves and shaded regions; bottom) and their corresponding logarithmic slopes for all 324 clusters; the shaded bands indicate the range of variation between the 10th and 90th percentiles within each radial bin. The dashed, dotted, and dot-dashed lines indicate the locations of
$R_{200}\lt r_{\text{splash}}\lt r_{\text{shock,p}}\lt r_{\text{shock,m}}$
– is characteristic of the typical cluster in this sample. We demonstrate this in Fig. 3 in which we show the median dark matter density profiles (blue curves and shaded regions; top) and gas entropy profiles (red curves and shaded regions; bottom) and their corresponding logarithmic slopes for all 324 clusters; the shaded bands indicate the range of variation between the 10th and 90th percentiles within each radial bin. The dashed, dotted, and dot-dashed lines indicate the locations of $r_{\text{splash}}$
,
$r_{\text{splash}}$
, $r_{\text{shock,p}}$
, and
$r_{\text{shock,p}}$
, and $r_{\text{shock,m}}$
of the median cluster. We find that
$r_{\text{shock,m}}$
of the median cluster. We find that $r_{\text{splash}}=1.87^{+0.39}_{-0.41} R_{200}$
,
$r_{\text{splash}}=1.87^{+0.39}_{-0.41} R_{200}$
, $r_{\text{shock,p}}=2.58^{+0.45}_{-0.43} R_{200}$
and
$r_{\text{shock,p}}=2.58^{+0.45}_{-0.43} R_{200}$
and $r_{\text{shock,m}}=3.58^{+0.57}_{-0.62} R_{200}$
. We also include the splashback radii for gas –
$r_{\text{shock,m}}=3.58^{+0.57}_{-0.62} R_{200}$
. We also include the splashback radii for gas – $r_{\text{splash}}/R_{200} = 1.72^{+0.55}_{-0.45}$
– and stars –
$r_{\text{splash}}/R_{200} = 1.72^{+0.55}_{-0.45}$
– and stars – $r_{\text{splash}}/R_{200} = 2.07^{+0.42}_{-0.39}$
– in Fig. 3 (purple and grey curves and shaded regions, top). This means that the stellar mass density profile traces that of the underlying dark matter, and indeed we see a stronger splashback feature in the stars. In contrast, the gas mass density profile is smoother and shows no obvious feature, and formally reaches a minimum slope at a smaller radius compared to the stars although this is not a strong feature.
$r_{\text{splash}}/R_{200} = 2.07^{+0.42}_{-0.39}$
– in Fig. 3 (purple and grey curves and shaded regions, top). This means that the stellar mass density profile traces that of the underlying dark matter, and indeed we see a stronger splashback feature in the stars. In contrast, the gas mass density profile is smoother and shows no obvious feature, and formally reaches a minimum slope at a smaller radius compared to the stars although this is not a strong feature.
Radial profiles of dark matter density (top) and gas entropy (bottom) with their logarithmic slopes for all The Three Hundred collaboration’s suite of simulated clusters. The curves and shaded regions correspond to the median and the range between the $10\textrm{th}$
to
$10\textrm{th}$
to $90\textrm{th}$
percentiles from the distribution of cluster profiles. The dashed line in the top panel represents the location of
$90\textrm{th}$
percentiles from the distribution of cluster profiles. The dashed line in the top panel represents the location of $r_{\text{splash}}$
. The dotted and dot-dashed lines in the bottom panel indicate the location of
$r_{\text{splash}}$
. The dotted and dot-dashed lines in the bottom panel indicate the location of $r_{\text{shock,p}}$
and
$r_{\text{shock,p}}$
and $r_{\text{shock,m}}$
, respectively. Curves are colour coded as in Fig. 2.
$r_{\text{shock,m}}$
, respectively. Curves are colour coded as in Fig. 2.
For this typical cluster, we note that the relative coincidence of $r_{\text{splash}}$
for the gas and
$r_{\text{splash}}$
for the gas and $r_{\text{shock,p}}$
evident in Fig. 2 is absent. This is not so surprising because we expect strong cluster-to-cluster variations in density and temperature in the outskirts of clusters (e.g. Power et al. Reference Power2020), which will dampen any splashback features in the median gas density profile. We defer a more detailed study of the relationship between gas splashback and shock radii to a subsequent paper. Note that from here and for the remainder of the paper, when we refer to
$r_{\text{shock,p}}$
evident in Fig. 2 is absent. This is not so surprising because we expect strong cluster-to-cluster variations in density and temperature in the outskirts of clusters (e.g. Power et al. Reference Power2020), which will dampen any splashback features in the median gas density profile. We defer a more detailed study of the relationship between gas splashback and shock radii to a subsequent paper. Note that from here and for the remainder of the paper, when we refer to $r_{\text{splash}}$
we use the value defined for the dark matter.
$r_{\text{splash}}$
we use the value defined for the dark matter.
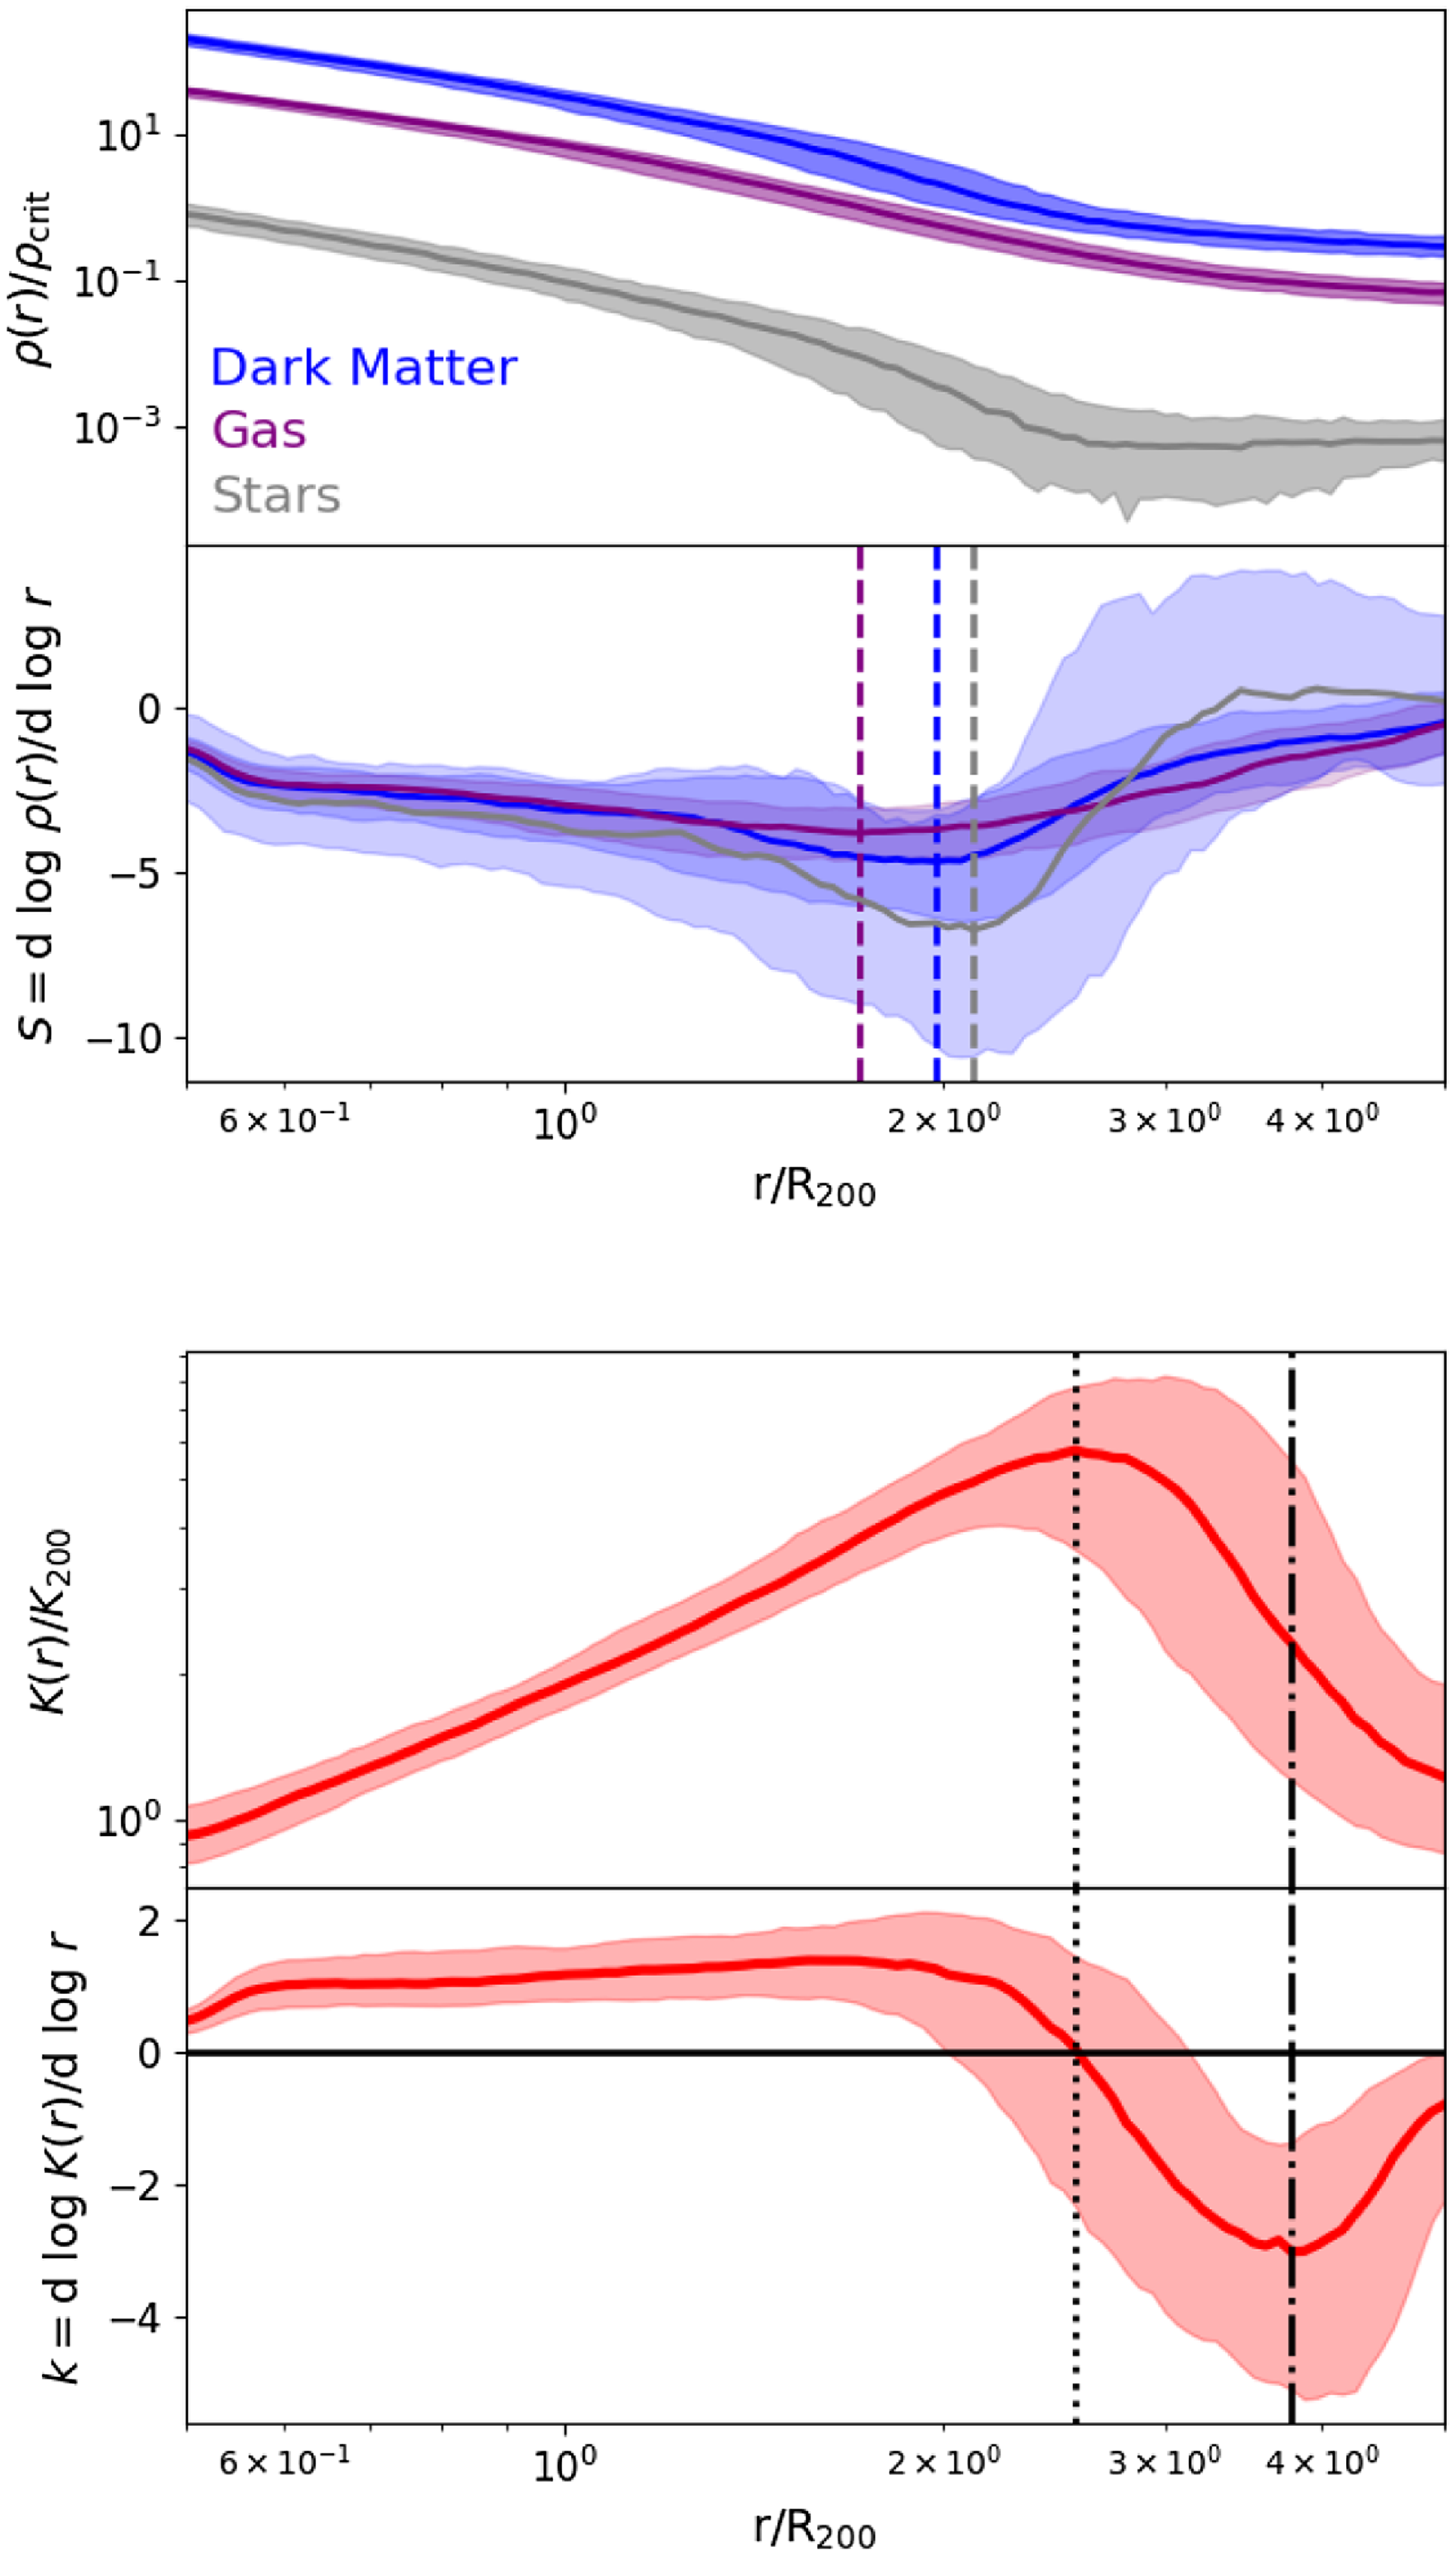
The clusters in our sample have diverse assembly histories and larger-scale environments, and so we expect cluster-to-cluster variations in $r_{\text{splash}}$
and
$r_{\text{splash}}$
and $r_{\text{shock}}$
. We quantify this in Fig. 4 in which we show how
$r_{\text{shock}}$
. We quantify this in Fig. 4 in which we show how $r_{\text{shock,p}}$
(upper panels) and
$r_{\text{shock,p}}$
(upper panels) and $r_{\text{shock,m}}$
(lower panels) vary with
$r_{\text{shock,m}}$
(lower panels) vary with $r_{\text{splash}}$
for each cluster, in units of
$r_{\text{splash}}$
for each cluster, in units of $R_{200}$
; on the left we investigate trends with virial mass,
$R_{200}$
; on the left we investigate trends with virial mass, $M_{200}$
, while on the right we look at trends with the fractional increase in
$M_{200}$
, while on the right we look at trends with the fractional increase in $M_{200}$
since
$M_{200}$
since $z=0.5$
,
$z=0.5$
,
 \begin{equation}\frac{\Delta\,M}{M}=\frac{M_{200}(z=0)-M_{200}(z=0.5)}{M_{200}(z=0)}.\end{equation}
Compared to $\Gamma$
, the accretion rate conventionally used in the literature (cf. the equation 1 of Zhang et al. Reference Zhang, Zhuravleva, Kravtsov and Churazov2021),Footnote b Equation (3) corresponds to
$\Gamma$
, the accretion rate conventionally used in the literature (cf. the equation 1 of Zhang et al. Reference Zhang, Zhuravleva, Kravtsov and Churazov2021),Footnote b Equation (3) corresponds to $\Gamma\log(1+z)\simeq\!0.41\Gamma$
for z=0.5.
$\Gamma\log(1+z)\simeq\!0.41\Gamma$
for z=0.5.
The relationship between the shock radius $r_{\text{shock}}$
and splashback radius
$r_{\text{shock}}$
and splashback radius $r_{\text{splash}}$
for each of the 324 clusters in our sample. Upper panels correspond to
$r_{\text{splash}}$
for each of the 324 clusters in our sample. Upper panels correspond to $r_{\text{shock,p}}$
identified with the maximum of K, while the lower panels correspond to
$r_{\text{shock,p}}$
identified with the maximum of K, while the lower panels correspond to $r_{\text{shock,m}}$
identified with the minimum of its logarithmic slope. The points are colour coded by the virial mass
$r_{\text{shock,m}}$
identified with the minimum of its logarithmic slope. The points are colour coded by the virial mass $M_{200}$
(left panels) and the fractional increase in
$M_{200}$
(left panels) and the fractional increase in $M_{200}$
since
$M_{200}$
since $z=0.5$
,
$z=0.5$
, $\Delta M / M$
(right panels). The red and blue stars indicate the median values
$\Delta M / M$
(right panels). The red and blue stars indicate the median values $r_{\text{shock}}$
and
$r_{\text{shock}}$
and $r_{\text{splash}}$
, while the light and heavy dashed lines correspond to the one-to-one relationships and the best-fit linear relationships. The shaded band in the left-hand panels indicates the 1-
$r_{\text{splash}}$
, while the light and heavy dashed lines correspond to the one-to-one relationships and the best-fit linear relationships. The shaded band in the left-hand panels indicates the 1- $\sigma$
variation estimated by bootstrapping.
$\sigma$
variation estimated by bootstrapping.
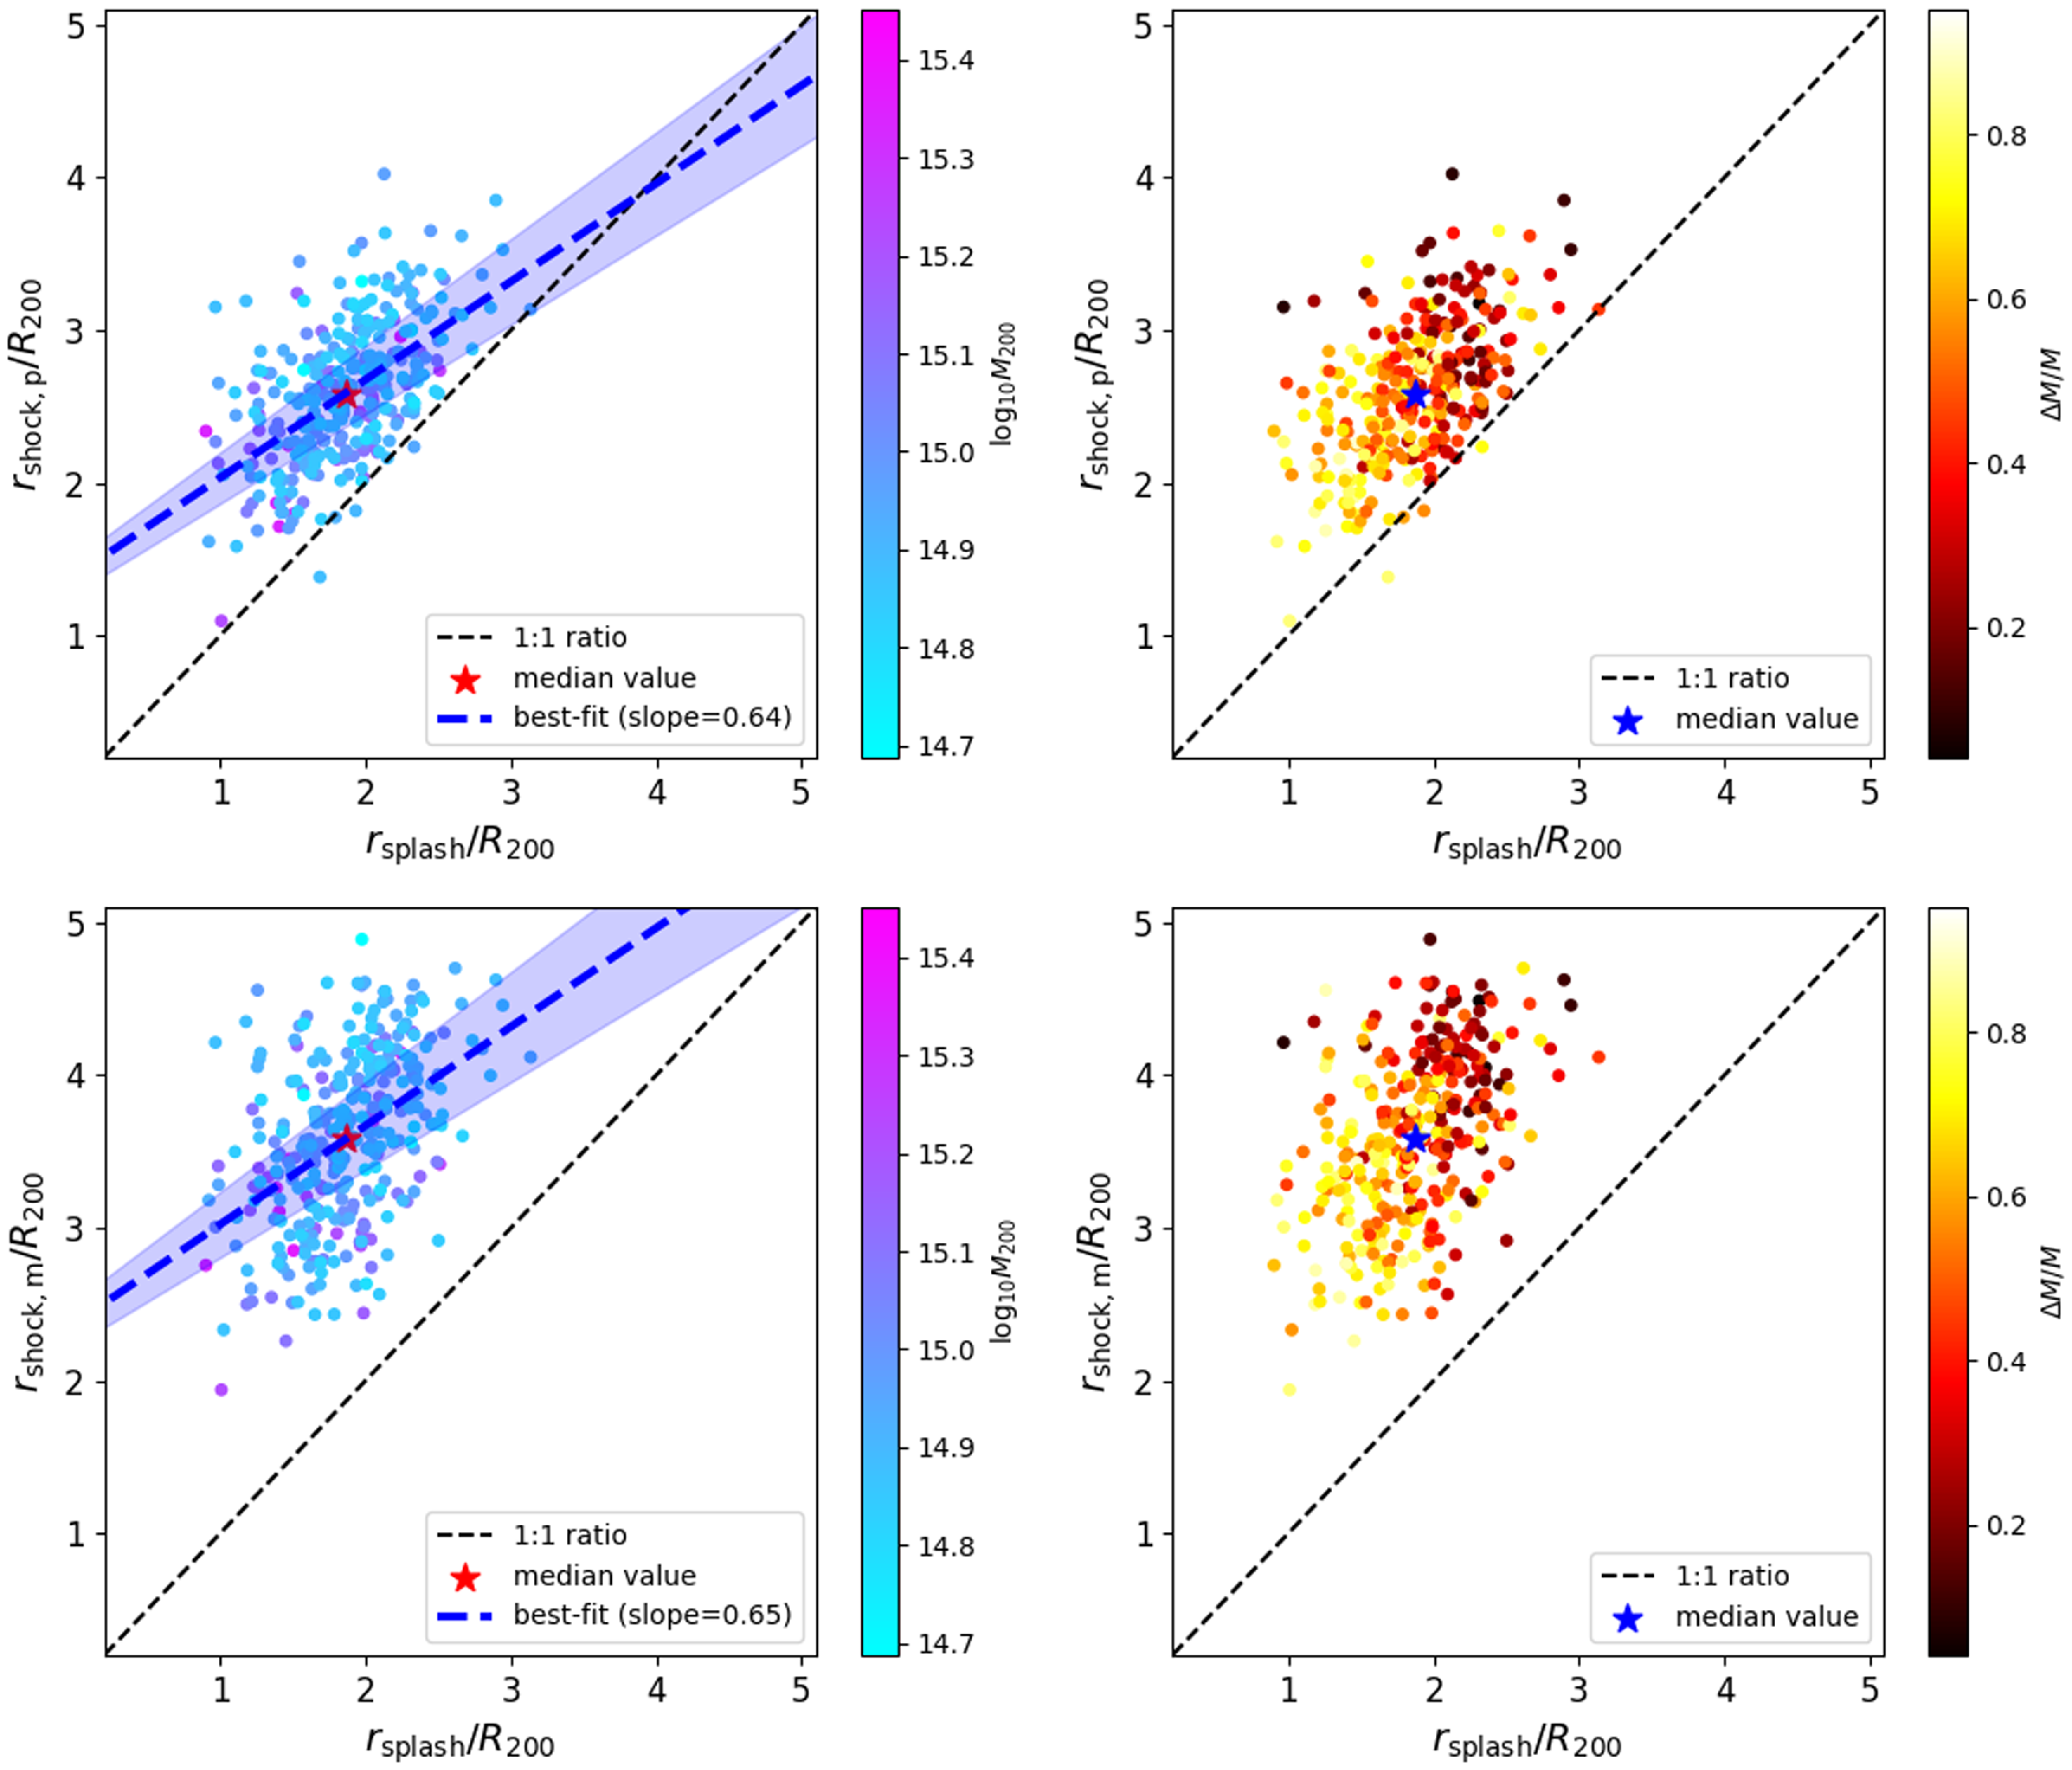
Fig. 4 reveals that $r_{\text{shock,p}}$
is larger than
$r_{\text{shock,p}}$
is larger than $r_{\text{splash}}$
for all but a handful of clusters, while
$r_{\text{splash}}$
for all but a handful of clusters, while $r_{\text{shock,m}}$
is consistently larger than
$r_{\text{shock,m}}$
is consistently larger than $r_{\text{splash}}$
for all cases. The stars indicate the median values of
$r_{\text{splash}}$
for all cases. The stars indicate the median values of $r_{\text{shock}}$
and
$r_{\text{shock}}$
and $r_{\text{splash}}$
for the sample are
$r_{\text{splash}}$
for the sample are $r_{\text{shock,p}}/r_{\text{splash}}=1.38^{+0.27}_{-0.21}$
and
$r_{\text{shock,p}}/r_{\text{splash}}=1.38^{+0.27}_{-0.21}$
and $r_{\text{shock,m}}/ r_{\text{splash}}=1.91^{+0.31}_{-0.42}$
, while the best-fit linear relationships between
$r_{\text{shock,m}}/ r_{\text{splash}}=1.91^{+0.31}_{-0.42}$
, while the best-fit linear relationships between $r_{\text{shock}}$
and
$r_{\text{shock}}$
and $r_{\text{splash}}$
– which we show in the left hand panels – are
$r_{\text{splash}}$
– which we show in the left hand panels – are
 \begin{equation}r_{\text{shock,p}} = 0.64(\pm0.06)\,r_{\text{splash}} + 1.39(\pm0.11),\end{equation}
and
 \begin{equation}r_{\text{shock,m}} = 0.65(\pm0.07)\,r_{\text{splash}} + 2.38(\pm0.14),\end{equation}
where $r_{\text{splash}}, r_{\text{shock,p}}$
, and
$r_{\text{splash}}, r_{\text{shock,p}}$
, and $r_{\text{shock,m}}$
are in units of
$r_{\text{shock,m}}$
are in units of $h^{-1}$
Mpc. We estimate
$h^{-1}$
Mpc. We estimate $1-\sigma$
uncertainties via bootstrapping; these are listed in parentheses and by the shaded bands around the best-fit lines in Fig. 4. The Spearman rank correlation coefficients are
$1-\sigma$
uncertainties via bootstrapping; these are listed in parentheses and by the shaded bands around the best-fit lines in Fig. 4. The Spearman rank correlation coefficients are $r_s$
=0.469 and 0.564 (with vanishingly small p-values) for Equations (5) and (6), respectively; this indicates that there is a moderate positive correlation between the shock radii and the splashback radius.
$r_s$
=0.469 and 0.564 (with vanishingly small p-values) for Equations (5) and (6), respectively; this indicates that there is a moderate positive correlation between the shock radii and the splashback radius.
Fig. 4 shows how $r_{\text{splash}}$
and
$r_{\text{splash}}$
and $r_{\text{shock}}$
relate to one another for a given cluster and trends between this relationship and the cluster’s virial mass,
$r_{\text{shock}}$
relate to one another for a given cluster and trends between this relationship and the cluster’s virial mass, $M_{200}$
, and its recent fractional change in
$M_{200}$
, and its recent fractional change in $M_{200}$
,
$M_{200}$
, $\Delta\,M/M$
. In Fig. 5 we quantify the trends between
$\Delta\,M/M$
. In Fig. 5 we quantify the trends between $r_{\text{splash}}$
and
$r_{\text{splash}}$
and $r_{\text{shock}}$
with
$r_{\text{shock}}$
with $M_{200}$
and
$M_{200}$
and $\Delta\,M/M$
directly. The top panel shows how
$\Delta\,M/M$
directly. The top panel shows how $r_{\text{splash}}$
and
$r_{\text{splash}}$
and $r_{\text{shock}}$
vary with
$r_{\text{shock}}$
vary with $M_{200}$
, in units of
$M_{200}$
, in units of $R_{200}$
, for all 324 clusters in our sample. The data can be characterised by the relations,
$R_{200}$
, for all 324 clusters in our sample. The data can be characterised by the relations,
 \begin{equation}\frac{r_{\text{shock,p}}}{R_\textrm{200}} = -0.82 \, \log_{10} M_\textrm{200} + 15.02(\pm0.08),\end{equation}
 \begin{equation}\frac{r_{\text{shock,m}}}{R_\textrm{200}} = -1.05 \, \log_{10} M_\textrm{200} + 19.23(\pm0.09),\end{equation}
and
 \begin{equation}\frac{r_{\text{splash}}}{R_\textrm{200}} = -0.56 \, \log_{10} M_\textrm{200} + 10.23(\pm0.07),\end{equation}
where, as before, $M_{200}$
is in units of
$M_{200}$
is in units of $h^{-1}M_{\odot}$
. 1-
$h^{-1}M_{\odot}$
. 1- $\sigma$
uncertainties, estimated via bootstrapping, are in parentheses, and are shown as shaded bands in the Figure. We find Spearman rank correlation coefficients of
$\sigma$
uncertainties, estimated via bootstrapping, are in parentheses, and are shown as shaded bands in the Figure. We find Spearman rank correlation coefficients of $r_s=-0.20$
for
$r_s=-0.20$
for $r_{\text{shock,p}}$
,
$r_{\text{shock,p}}$
, $r_s=-0.18$
for
$r_s=-0.18$
for $r_{\text{shock,m}}$
and
$r_{\text{shock,m}}$
and $r_s=-0.14$
for
$r_s=-0.14$
for $r_{\text{splash}}$
, with respect to
$r_{\text{splash}}$
, with respect to $M_{200}$
, which indicates that there is a weak anti-correlation with virial mass.
$M_{200}$
, which indicates that there is a weak anti-correlation with virial mass.
The relationship between the shock and splashback radii, $r_{\text{shock, p}}$
,
$r_{\text{shock, p}}$
, $r_{\text{shock, m}}$
, and
$r_{\text{shock, m}}$
, and $r_{\text{splash}}$
as a function of virial mass,
$r_{\text{splash}}$
as a function of virial mass, $M_{200}$
(upper panel) and recent mass accretion history (lower panel) for each of the 324 clusters in our sample. The shaded bands indicate the 1-
$M_{200}$
(upper panel) and recent mass accretion history (lower panel) for each of the 324 clusters in our sample. The shaded bands indicate the 1- $\sigma$
variations for each set of points estimated by bootstrapping.
$\sigma$
variations for each set of points estimated by bootstrapping.
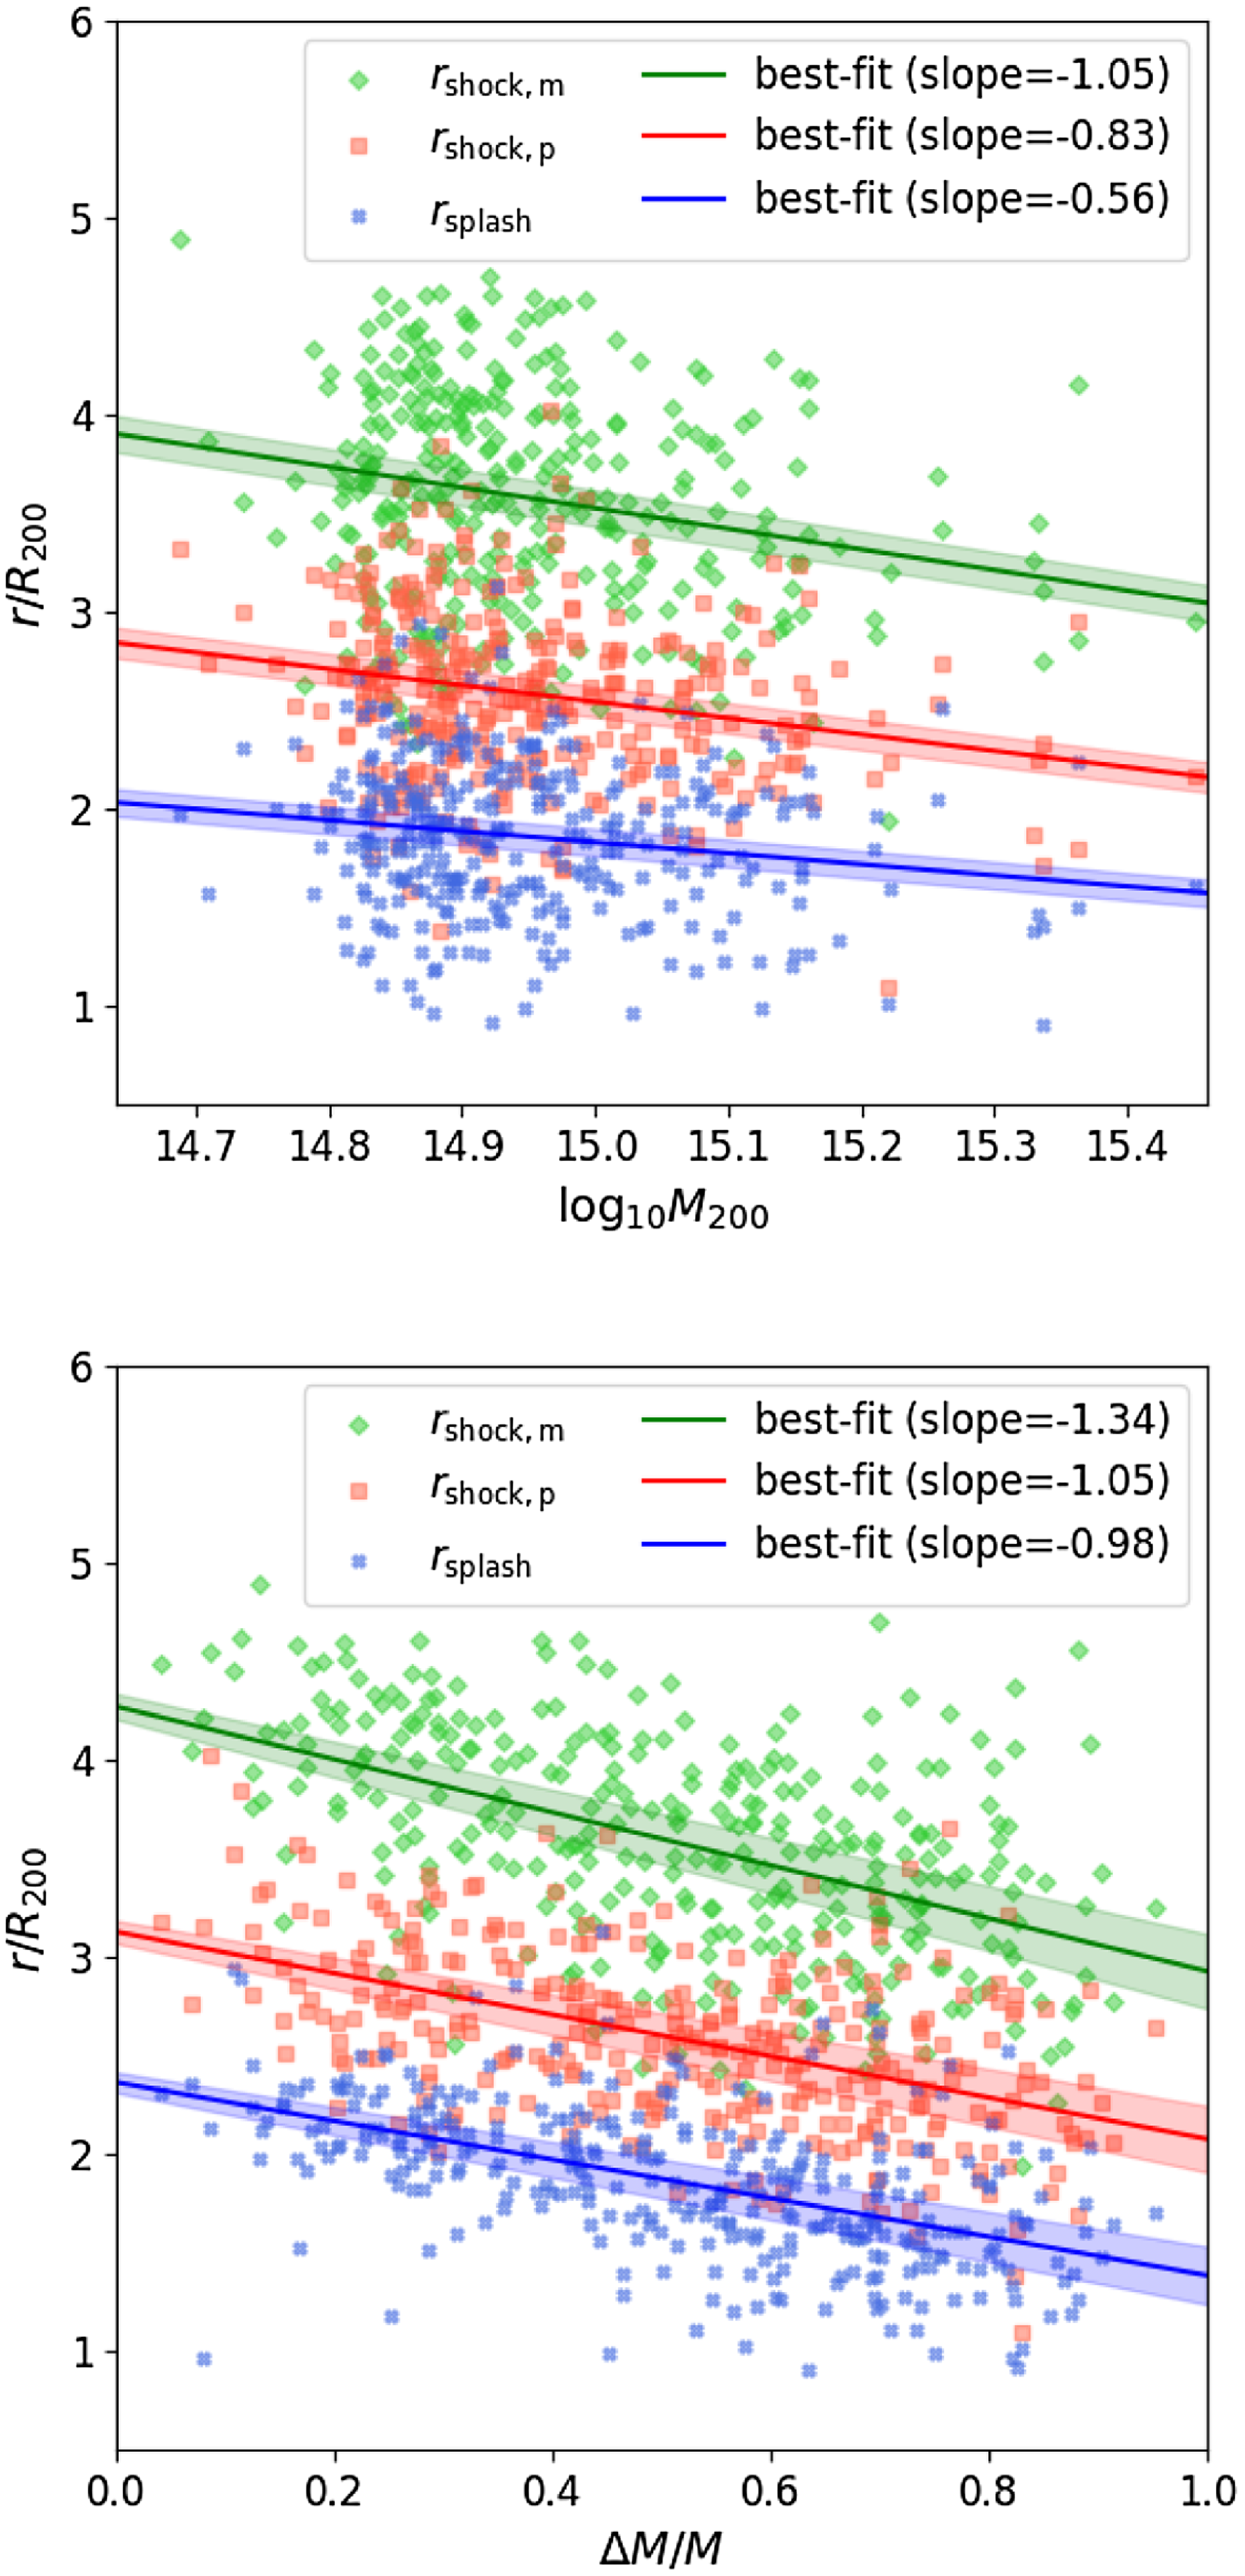
The bottom panel shows shows how $r_{\text{splash}}$
and
$r_{\text{splash}}$
and $r_{\text{shock}}$
vary with
$r_{\text{shock}}$
vary with $\Delta\,M/M$
, in units of
$\Delta\,M/M$
, in units of $R_{200}$
. We find,
$R_{200}$
. We find,
 \begin{equation}\frac{r_{\text{shock,p}}}{R_\textrm{200}} = -1.05(\pm0.11) \, \Delta M/M + 3.13(\pm0.06),\end{equation}
 \begin{equation}\frac{r_{\text{shock,m}}}{R_\textrm{200}} = -1.34(\pm0.12) \, \Delta M/M + 4.27(\pm0.07),\end{equation}
and
 \begin{equation}\frac{r_{\text{splash}}}{R_\textrm{200}} = -0.98(\pm0.10) \, \Delta M/M + 2.36(\pm0.05).\end{equation}
As above, 1- $\sigma$
uncertainties are in parentheses and are shown as shaded bands in the figure. The Spearman rank correlation coefficients are
$\sigma$
uncertainties are in parentheses and are shown as shaded bands in the figure. The Spearman rank correlation coefficients are $r_s=-0.48$
for
$r_s=-0.48$
for $r_{\text{shock,p}}$
,
$r_{\text{shock,p}}$
, $r_s=-0.51$
for
$r_s=-0.51$
for $r_{\text{shock,m}}$
and
$r_{\text{shock,m}}$
and $r_s=-0.57$
for
$r_s=-0.57$
for $r_{\text{splash}}$
, which indicate a moderate anti-correlation with our measure of the recent accretion rate.
$r_{\text{splash}}$
, which indicate a moderate anti-correlation with our measure of the recent accretion rate.
These trends, along with the best-fit linear relationships (Equations 5 and 6), indicate that there is a moderate positive correlation between $r_{\text{shock}}$
and
$r_{\text{shock}}$
and $r_{\text{splash}}$
, driven by a cluster’s recent mass accretion rate. This is consistent with the findings of Aung, Nagai, & Lau (Reference Aung, Nagai and Lau2021). These findings are largely insensitive to mass resolution and galaxy formation model, provided care is taken to recover ICM properties that are consistent with observations. We discuss this in more detail in Appendix 1.
$r_{\text{splash}}$
, driven by a cluster’s recent mass accretion rate. This is consistent with the findings of Aung, Nagai, & Lau (Reference Aung, Nagai and Lau2021). These findings are largely insensitive to mass resolution and galaxy formation model, provided care is taken to recover ICM properties that are consistent with observations. We discuss this in more detail in Appendix 1.
4. Discussion
There has been significant progress over the last decade in our understanding of the physical processes that shape the outskirts of galaxy clusters, using both cosmological simulations and a variety of observational data. Radio synchrotron emission and polarisation (e.g. Locatelli et al. Reference Locatelli, Vazza, Bonafede, Banfi, Bernardi, Gheller, Botteon and Shimwell2021; Ha, Ryu, & Kang Reference Ha, Ryu and Kang2023; Vernstrom et al. Reference Vernstrom, West, Vazza, Wittor, Riseley and Heald2023; Böss et al. Reference Böss, Dolag, Steinwandel, Hernández-Martnez, Seidel and Sorce2023), gas entropy (Lau et al. Reference Lau, Nagai, Avestruz, Nelson and Vikhlinin2015; Aung et al. Reference Aung, Nagai and Lau2021) and X-ray emission (e.g. Simionescu et al. Reference Simionescu2021), and the thermal Sunyaev–Zeldovich (tSZ) effect (Baxter et al. Reference Baxter, Adhikari, Vega-Ferrero, Cui, Chang, Jain and Knebe2021; Anbajagane et al. Reference Anbajagane2022; Anbajagane et al. Reference Anbajagane2024) all offer the means to probe the shocked gas associated with accretion from the cosmic web. That there is a relationship between this accretion shock and the cluster boundary defined by the splashback radius has been explored observationally (Anbajagane et al. Reference Anbajagane2022, Reference Anbajagane2024) and in non-radiative cosmological hydrodynamical simulations (Walker et al. Reference Walker2019; Aung et al. Reference Aung, Nagai and Lau2021).
Our study leverages the latest iteration of The Three Hundred collaboration’s suite of cosmological galaxy formation simulations of galaxy clusters, which model a broad range of physical processes – radiative cooling, star formation and supernovae, black hole growth, outflows, and jets – and provide a more realistic treatment of cluster formation than is possible in non-radiative simulations. Nevertheless, we find that a relationship between shock and splashback radii that is consistent with that found in non-radiative simulations, such as those of Aung et al. (Reference Aung, Nagai and Lau2021), who found $r_\mathrm{shock,m}/r_\mathrm{splash} \simeq 1.89$
based on a sample of 65 clusters, compared to our median value of
$r_\mathrm{shock,m}/r_\mathrm{splash} \simeq 1.89$
based on a sample of 65 clusters, compared to our median value of $\simeq$
1.91. Our results also show that both shock and splashback radii correlates with the cluster accretion rate, which is consistent with previous studies. Baxter et al. (Reference Baxter, Adhikari, Vega-Ferrero, Cui, Chang, Jain and Knebe2021) found clusters with high mass fraction of the cluster in substructure, as a proxy for a high accretion rate, tend to have smaller shock and splashback radii, as we show in Fig. 5.
$\simeq$
1.91. Our results also show that both shock and splashback radii correlates with the cluster accretion rate, which is consistent with previous studies. Baxter et al. (Reference Baxter, Adhikari, Vega-Ferrero, Cui, Chang, Jain and Knebe2021) found clusters with high mass fraction of the cluster in substructure, as a proxy for a high accretion rate, tend to have smaller shock and splashback radii, as we show in Fig. 5.
We note that our results on the relationship between $r_{\text{splash}}$
and halo mass are broadly consistent with previous work. O’Neil et al. (Reference O’Neil, Barnes, Vogelsberger and Diemer2021) found that
$r_{\text{splash}}$
and halo mass are broadly consistent with previous work. O’Neil et al. (Reference O’Neil, Barnes, Vogelsberger and Diemer2021) found that $r_\mathrm{splash}$
decreases with mass for halo masses in the range
$r_\mathrm{splash}$
decreases with mass for halo masses in the range $10^{13}$
–
$10^{13}$
– $10^{15}$
M
$10^{15}$
M $_{\odot}$
in the Illustris TNG simulations, while Towler et al. (Reference Towler2024) found that
$_{\odot}$
in the Illustris TNG simulations, while Towler et al. (Reference Towler2024) found that $r_\mathrm{splash}$
has a weak negative mass dependence for halos more massive than
$r_\mathrm{splash}$
has a weak negative mass dependence for halos more massive than $10^{14}\,\mathrm{M}_{\odot}$
in the FLAMINGO simulations. Towler et al. (Reference Towler2024) also reported a correlation between
$10^{14}\,\mathrm{M}_{\odot}$
in the FLAMINGO simulations. Towler et al. (Reference Towler2024) also reported a correlation between $r_\mathrm{splash}$
and accretion rate, in agreement with our results. O’Neil et al. (Reference O’Neil, Barnes, Vogelsberger and Diemer2021) found that
$r_\mathrm{splash}$
and accretion rate, in agreement with our results. O’Neil et al. (Reference O’Neil, Barnes, Vogelsberger and Diemer2021) found that $r_\mathrm{splash}$
computed from the gas profile is
$r_\mathrm{splash}$
computed from the gas profile is $\sim$
10–20% lower than computed using the dark matter profile, while
$\sim$
10–20% lower than computed using the dark matter profile, while $r_\mathrm{splash}$
computed from the galaxy number density profile (essentially the stellar mass density profile) is similar to that of the dark matter profiles; this is consistent with our results.
$r_\mathrm{splash}$
computed from the galaxy number density profile (essentially the stellar mass density profile) is similar to that of the dark matter profiles; this is consistent with our results.
Observational limits on the location of accretion shocks in galaxy clusters’ outskirts have been recovered by stacking Compton-y maps (Baxter et al. Reference Baxter, Adhikari, Vega-Ferrero, Cui, Chang, Jain and Knebe2021; Anbajagane et al. Reference Anbajagane2022; Anbajagane et al. Reference Anbajagane2024). These studies detect an integrated tSZ signal; this is proportional to the line-of-sight integral of the electron pressure, which is related to, but not equal nor proportional to, the gas entropy. Anbajagane et al. (Reference Anbajagane2022) locate the accretion shock via a minimum in the logarithmic derivative of the tSZ signal and estimate $r_\mathrm{shock,m}/r_\mathrm{splash} \gt 2.16\pm0.59$
. This is slightly higher than the results suggested by cosmological simulations, but this is not a one-to-one comparison. Future X-ray experiments capable of mapping the outskirts of clusters should allow for a more direct comparison with estimates of the shock radius based on gas entropy (e.g. Simionescu et al. Reference Simionescu2021).
$r_\mathrm{shock,m}/r_\mathrm{splash} \gt 2.16\pm0.59$
. This is slightly higher than the results suggested by cosmological simulations, but this is not a one-to-one comparison. Future X-ray experiments capable of mapping the outskirts of clusters should allow for a more direct comparison with estimates of the shock radius based on gas entropy (e.g. Simionescu et al. Reference Simionescu2021).
5. Conclusions
Using 324 simulated galaxy clusters from The Three Hundred collaboration, we have investigated the relationship between the shock radius, $r_{\text{shock}}$
, which characterises the boundary between a cluster’s gaseous outskirts and accreting gas from the cosmic web, and the splashback radius,
$r_{\text{shock}}$
, which characterises the boundary between a cluster’s gaseous outskirts and accreting gas from the cosmic web, and the splashback radius, $r_{\text{splash}}$
, which characterises the boundary between collisionless material orbiting within the cluster and matter that is infalling for the first time. Depending on our definition, we find the shock radius is larger than splashback radius for most, if not all, clusters. If we stack our clusters and estimate
$r_{\text{splash}}$
, which characterises the boundary between collisionless material orbiting within the cluster and matter that is infalling for the first time. Depending on our definition, we find the shock radius is larger than splashback radius for most, if not all, clusters. If we stack our clusters and estimate $r_{\text{splash}}$
and
$r_{\text{splash}}$
and $r_{\text{shock}}$
from the median radial profiles for dark matter density and gas entropy, respectively, we find that the median cluster has
$r_{\text{shock}}$
from the median radial profiles for dark matter density and gas entropy, respectively, we find that the median cluster has $r_{\text{shock,p}} \simeq 1.38 r_{\text{splash}} (2.58 R_{200})$
, estimated from where K reaches its maximum, and
$r_{\text{shock,p}} \simeq 1.38 r_{\text{splash}} (2.58 R_{200})$
, estimated from where K reaches its maximum, and $r_{\text{shock,m}} \simeq 1.91 r_{\text{splash}} (3.54 R_{200})$
, estimated from when its logarithmic slope is a minimum. If we evaluate
$r_{\text{shock,m}} \simeq 1.91 r_{\text{splash}} (3.54 R_{200})$
, estimated from when its logarithmic slope is a minimum. If we evaluate $r_{\text{splash}}$
and
$r_{\text{splash}}$
and $r_{\text{shock}}$
for each cluster individually, we find that the best-fit linear relation increases as
$r_{\text{shock}}$
for each cluster individually, we find that the best-fit linear relation increases as $r_{\text{shock}} \propto 0.65 r_{\text{splash}}$
, independent of definition, and we observe that
$r_{\text{shock}} \propto 0.65 r_{\text{splash}}$
, independent of definition, and we observe that $r_{\text{shock}}/r_{\text{splash}}$
tends to be larger in clusters that have experienced higher recent mass accretion rates, which is driven primarily by strength of the dependence of
$r_{\text{shock}}/r_{\text{splash}}$
tends to be larger in clusters that have experienced higher recent mass accretion rates, which is driven primarily by strength of the dependence of $r_{\text{splash}}$
on the accretion rate rather than any dependence of
$r_{\text{splash}}$
on the accretion rate rather than any dependence of $r_{\text{shock}}$
. We find that
$r_{\text{shock}}$
. We find that $r_{\text{shock}}/R_{200}$
and
$r_{\text{shock}}/R_{200}$
and $r_{\text{splash}}/R_{200}$
anti-correlate with virial mass,
$r_{\text{splash}}/R_{200}$
anti-correlate with virial mass, $M_{200}$
, and recent mass accretion history.
$M_{200}$
, and recent mass accretion history.
These results are consistent with the results of recent studies (e.g. Aung et al. Reference Aung, Nagai and Lau2021) but draw on a larger statistical, mass complete, sample of simulated, run using a state-of-the-art galaxy formation model, and calibrated to reproduce the observed galaxy cluster population, building on the work of Cui et al. (Reference Cui2022). While this consistency is to be expected – as previous work has shown (e.g. Power et al. Reference Power2020), the key properties of galaxy cluster outskirts are shaped by the physics of gravitational dynamics and strong hydrodynamic shocks – it is important to verify it. These results also confirm that analytical models that assume the coincidence of $r_{\text{shock}}$
and
$r_{\text{shock}}$
and $r_{\text{splash}}$
(e.g. Patej & Loeb Reference Patej and Loeb2015) need to be modified, and need to account for mass accretion history and larger scale environment.
$r_{\text{splash}}$
(e.g. Patej & Loeb Reference Patej and Loeb2015) need to be modified, and need to account for mass accretion history and larger scale environment.
Our work has potentially interesting consequences for observational studies of the outskirts of clusters, and efforts to measure empirically the accretion shock. Measurements of $r_{\text{splash}}$
and phase space caustics using cluster galaxies (e.g. Deason et al. Reference Deason2021) could offer the means to constrain the recent mass accretion history. This could help to predict the projected radial scale at which we might expect to detect the accretion shock, based on the relationship we have measured in our sample of clusters, which would help to guide measurements of non-thermal emission with radio telescopes (e.g. Vernstrom et al. Reference Vernstrom, West, Vazza, Wittor, Riseley and Heald2023), X-ray emission (e.g. Ichikawa et al. Reference Ichikawa2013; Simionescu et al. Reference Simionescu2021; McCall et al. Reference McCall2024) and the thermal Sunyaev–Zeldovich (tSZ) effect (Anbajagane et al. Reference Anbajagane2024), especially when stacking is required to boost sensitivity. Future work will focus on using mock observables to verify the most reliable methods to recover accurate combined measurements of
$r_{\text{splash}}$
and phase space caustics using cluster galaxies (e.g. Deason et al. Reference Deason2021) could offer the means to constrain the recent mass accretion history. This could help to predict the projected radial scale at which we might expect to detect the accretion shock, based on the relationship we have measured in our sample of clusters, which would help to guide measurements of non-thermal emission with radio telescopes (e.g. Vernstrom et al. Reference Vernstrom, West, Vazza, Wittor, Riseley and Heald2023), X-ray emission (e.g. Ichikawa et al. Reference Ichikawa2013; Simionescu et al. Reference Simionescu2021; McCall et al. Reference McCall2024) and the thermal Sunyaev–Zeldovich (tSZ) effect (Anbajagane et al. Reference Anbajagane2024), especially when stacking is required to boost sensitivity. Future work will focus on using mock observables to verify the most reliable methods to recover accurate combined measurements of $r_{\text{splash}}$
and
$r_{\text{splash}}$
and $r_{\text{shock}}$
.
$r_{\text{shock}}$
.
Acknowledgements
We thank the anonymous referee for their report. This work has been made possible by the The Three Hundred collaboration.Footnote c The HD simulations (7K and 15K runs) were performed on the MareNostrum Finisterrae3, and Cibeles Supercomputers through The Red Española de Supercomputación grants (AECT-2022-3-0027, AECT-2023-1-0013, AECT-2023-2-0004, AECT-2023-3-0023, AECT-2024-1-0026), on the DIaL3 – DiRAC Data Intensive service at the University of Leicester through the RAC15 grant: Seedcorn/ACTP317, and on the Niagara supercomputer at the SciNet HPC Consortium. DIaL3 is managed by the University of Leicester Research Computing Service on behalf of the STFC DiRAC HPC Facility (https://www.dirac.ac.uk). The DiRAC service at Leicester was funded by BEIS, UKRI, and STFC capital funding and STFC operations grants. DiRAC is part of the UKRI Digital Research Infrastructure. This work also used the DiRAC Complexity system, operated by the University of Leicester IT Services, which forms part of the STFC DiRAC HPC Facility (https://www.dirac.ac.uk). This equipment is funded by BIS National E-Infrastructure capital grant ST/K000373/1 and STFC DiRAC Operations grant ST/K0003259/1. DiRAC is part of the National e-Infrastructure. Some of the analysis presented in this work was performed on the OzSTAR national facility at Swinburne University of Technology. The OzSTAR programme receives funding in part from the Astronomy National Collaborative Research Infrastructure Strategy (NCRIS) allocation provided by the Australian Government, and from the Victorian Higher Education State Investment Fund (VHESIF) provided by the Victorian Government. SciNet (Loken et al. Reference Loken2010) is funded by Innovation, Science and Economic Development Canada; the Digital Research Alliance of Canada; the Ontario Research Fund: Research Excellence; and the University of Toronto.
Data availability statement
All data used in our analysis are from The Three Hundred collaboration.
Funding statement
MZ is supported by China Scholarship Council. KW and AS acknowledge the support of the Australian Government Research Training Program Fees Offset. AS acknowledges the Bruce and Betty Green Postgraduate Research Scholarship and The University Club of Western Australia Research Travel Scholarship. AS, KW, and CP acknowledge the support of the ARC Centre of Excellence for All Sky Astrophysics in 3 Dimensions (ASTRO 3D), through project number CE170100013. WC is supported by the Atracción de Talento Contract no. 2020-T1/TIC-19882 was granted by the Comunidad de Madrid in Spain, and the science research grants were from the China Manned Space Project. He also thanks the Ministerio de Ciencia e Innovación (Spain) for financial support under Project grant PID2021-122603NB-C21 and HORIZON EUROPE Marie Sklodowska-Curie Actions for supporting the LACEGAL-III project with grant number 101086388. MZ, YL, and XZ acknowledge the support of the National SKA Program of China (Grant Nos. 2022SKA0110200, 2022SKA0110203), the National Natural Science Foundation of China (Grant Nos. 12473001, 11975072, 11835009), and the 111 Project (Grant No. B16009). The work presented here emerged out of the annual The300 workshop held at UAM’s La Cristalera during the week July 8-12, 2024, partially funded by the ’Ayuda para la Organización de Jornadas Cientficas en la UAM en el Marco del Programa Propio de Investigación y con el Apoyo del Consejo Social de la UAM’
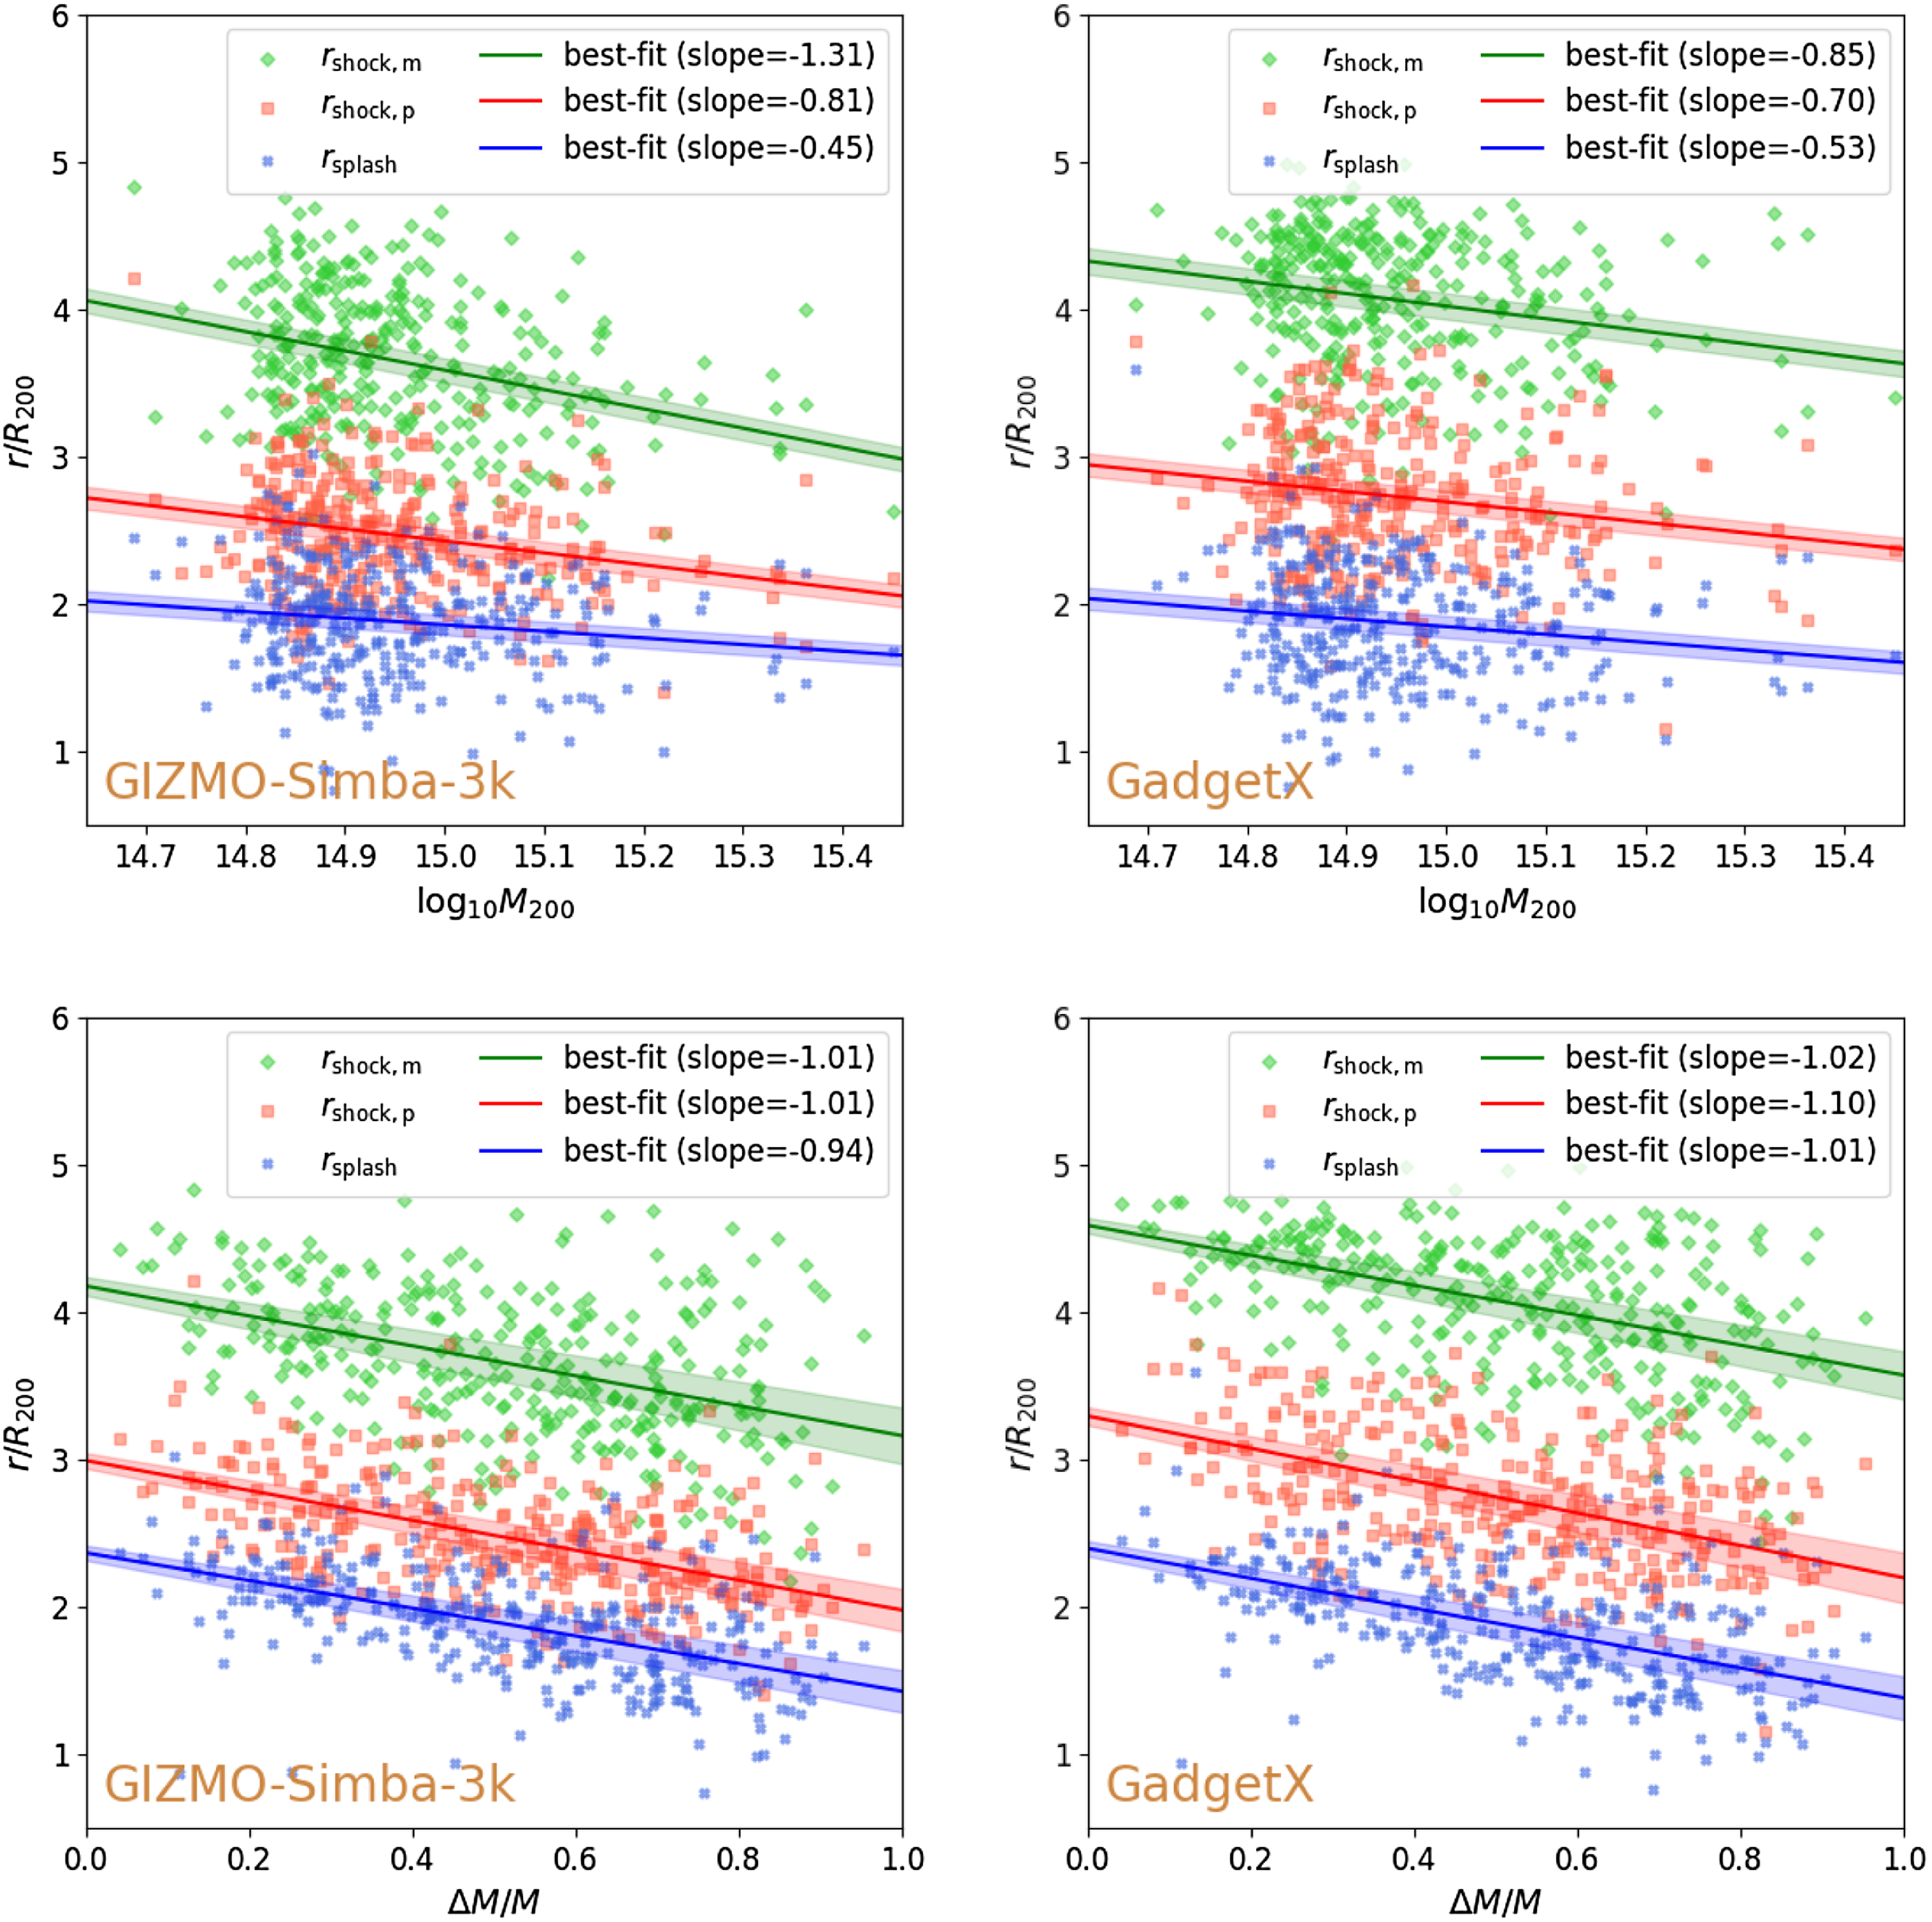
The relationship between the shock and splashback radii, $r_{\text{shock, m}}$
,
$r_{\text{shock, m}}$
, $r_{\text{shock, p}}$
and
$r_{\text{shock, p}}$
and $r_{\text{splash}}$
as a function of virial mass,
$r_{\text{splash}}$
as a function of virial mass, $M_{200}$
and recent mass accretion history
$M_{200}$
and recent mass accretion history $\Delta M/M$
in the GIZMO-Simba-3k (left two panels) and GadgetX (right two panels) runs for each of the 324 clusters in our sample. The shaded bands indicate the 1-
$\Delta M/M$
in the GIZMO-Simba-3k (left two panels) and GadgetX (right two panels) runs for each of the 324 clusters in our sample. The shaded bands indicate the 1- $\sigma$
variations for each set of points estimated by bootstrapping.
$\sigma$
variations for each set of points estimated by bootstrapping.
Appendix 1. Sensitivity to Mass Resolution and Galaxy Formation Model
We have checked the sensitivity of our results to mass resolution, by comparing measurements for the GIZMO-Simba-7k shown here and the GIZMO-Simba-3k runs, and galaxy formation model, by comparing both sets of the GIZMO-Simba runs to the GadgetX runs (cf. Cui et al. Reference Cui2018). We see similar qualitative trends regardless of mass resolution or galaxy formation model.
The relation between $r_{\text{shock,p}}$
to
$r_{\text{shock,p}}$
to $r_{\text{splash}}$
predicted by GIZMO-Simba-7k, GIZMO-Simba-3k, and GadgetX in the form of Equation (5) is given by the pairs of coefficients (0.64,1.39), (0.54, 1.45), and (0.58, 1.64), respectively. And the relation between
$r_{\text{splash}}$
predicted by GIZMO-Simba-7k, GIZMO-Simba-3k, and GadgetX in the form of Equation (5) is given by the pairs of coefficients (0.64,1.39), (0.54, 1.45), and (0.58, 1.64), respectively. And the relation between $r_{\text{shock,m}}$
to
$r_{\text{shock,m}}$
to $r_{\text{splash}}$
predicted by GIZMO-Simba-7k, GIZMO-Simba-3k, and GadgetX in the form of Equation (6) is given by the pairs of coefficients (0.65,2.38), (0.41, 2.88), and (0.47, 3.19), respectively. Similarly, Fig. A1 shows the relationship between shock and splashback radii as a function of
$r_{\text{splash}}$
predicted by GIZMO-Simba-7k, GIZMO-Simba-3k, and GadgetX in the form of Equation (6) is given by the pairs of coefficients (0.65,2.38), (0.41, 2.88), and (0.47, 3.19), respectively. Similarly, Fig. A1 shows the relationship between shock and splashback radii as a function of $M_{200}$
and
$M_{200}$
and $\Delta\,M/M$
, for the relations encoded in
$\Delta\,M/M$
, for the relations encoded in
-
• $r_{\text{shock,p}}/R_{200}$
versus
$M_{200}$
(Equation 7): (−0.82,15.02), (-0.81,14.59), and (-0.70,13.17)
$r_{\text{shock,p}}/R_{200}$
versus
$M_{200}$
(Equation 7): (−0.82,15.02), (-0.81,14.59), and (-0.70,13.17) -
•
$r_{\text{shock,m}}/R_{200}$
versus
$M_{200}$
(Equation 8): (−1.05,19.22), (−1.31,23.26), and (−0.85,16.73) -
•
$r_{\text{splash}}/R_{200}$
versus
$M_{200}$
(Equation 9): (−0.56,10.23), (−0.45, 8.59), and (−0.53,9.78) -
•
$r_{\text{shock,p}}/R_{200}$
versus
$\Delta\,M/M$
(Equation 10): (−1.05,3.13), (−1.01, 2.99), and (−1.10,3.29) -
•
$r_{\text{shock,m}}/R_{200}$
versus
$\Delta\,M/M$
(Equation 11): (−1.05,3.13), (−1.01, 4.18), and (−1.02,4.59) -
•
$r_{\text{splash}}/R_{200}$
versus
$\Delta\,M/M$
(Equation 12): (−0.98,2.36), (−0.94, 2.37), and (−1.01,2.40)


The trends between $r_{\text{splash}}/R_{200}$
,
$r_{\text{splash}}/R_{200}$
, $r_{\text{shock,m}}/R_{200}$
,
$r_{\text{shock,m}}/R_{200}$
, $r_{\text{shock,p}}/R_{200}$
and
$r_{\text{shock,p}}/R_{200}$
and $\Delta\,M/M$
are similar across the different resolutions and galaxy formation models. There are differences in the strength of the anti-correlation between the
$\Delta\,M/M$
are similar across the different resolutions and galaxy formation models. There are differences in the strength of the anti-correlation between the $R_{200}$
normalised values of
$R_{200}$
normalised values of $r_{\text{splash}}$
,
$r_{\text{splash}}$
, $r_{\text{shock,m}}$
,
$r_{\text{shock,m}}$
, $r_{\text{shock,p}}$
, and
$r_{\text{shock,p}}$
, and $M_{200}$
between runs; there is better quantitative agreement between
$M_{200}$
between runs; there is better quantitative agreement between $r_{\text{shock,p}}/R_{200}$
and
$r_{\text{shock,p}}/R_{200}$
and $M_{200}$
between the GIZMO-Simba-7k run and the GIZMO-Simba-3k run than between the GIZMO-Simba-7k run and the GadgetX. This partly reflects the philosophy underpinning the GadgetX runs, which were calibrated to recover the properties of ICM of observed clusters and partly the improvement in calibration of the GIZMO-Simba-7k runs compared to the GIZMO-Simba-3k runs, which have produced ICM properties more consistent with observations. This explains the stronger scaling of
$M_{200}$
between the GIZMO-Simba-7k run and the GIZMO-Simba-3k run than between the GIZMO-Simba-7k run and the GadgetX. This partly reflects the philosophy underpinning the GadgetX runs, which were calibrated to recover the properties of ICM of observed clusters and partly the improvement in calibration of the GIZMO-Simba-7k runs compared to the GIZMO-Simba-3k runs, which have produced ICM properties more consistent with observations. This explains the stronger scaling of $r_{\text{shock,p}}$
with
$r_{\text{shock,p}}$
with $M_{200}$
and the larger spread in values at a given
$M_{200}$
and the larger spread in values at a given $M_{200}$
compared to the two other models.
$M_{200}$
compared to the two other models.
We conclude that, provided care is taken to calibrate runs to recover ICM properties that are consistent with observed clusters, the relations between $r_{\text{shock}}$
,
$r_{\text{shock}}$
, $r_{\text{splash}}$
,
$r_{\text{splash}}$
, $M_{200}$
, and
$M_{200}$
, and $\Delta\,M/M$
are consistent across mass resolution and galaxy formation model.
$\Delta\,M/M$
are consistent across mass resolution and galaxy formation model.


 Open access