


INTRODUCTION
Despite the importance of diseases of wildlife to human and domestic animal health, and biodiversity, long-term field studies of wild host–pathogen systems are relatively rare. Hence, there is a general paucity of empirical data on long-term temporal trends in disease occurrence, transmission dynamics and individual risks of infection in wild animal populations on which to develop well-informed strategies for effective management.
In Great Britain and the Republic of Ireland, European badgers (Meles meles) infected with Mycobacterium bovis are an important source of bovine tuberculosis (TB) in cattle [1, Reference Griffin2]. Badgers have previously been culled under a variety of strategies (see [Reference Krebs3]), but the results of the UK randomized badger culling trial (RBCT) demonstrated both positive and negative impacts on the incidence of TB in cattle (e.g. [Reference Donnelly4]). Potential alternatives to non-selective culling as a means of reducing TB infection in badger populations include targeted culling (following the use of a diagnostic test) and vaccination (either alone or in combination with culling).
Much existing information on the prevalence and pathology of M. bovis infection in wild badgers has been derived from local surveys, statutory badger culling operations and carcasses from road traffic accidents (see [Reference Krebs3]). More recently the RBCT provided further information from consecutive experimental culling operations [1]. These studies were largely based on post-mortem examination and culture of tissues. Methods for monitoring infection in live animals are by comparison less sensitive [Reference Pritchard5], but when applied consistently and repeatedly, can provide unique and valuable data on disease dynamics at an individual and population level.
A study of a naturally infected badger population was initiated in 1975 at Woodchester Park in Gloucestershire, South West England, with the objective of providing epidemiological and ecological data to inform TB control policy. This high-density, undisturbed population [Reference Rogers6] has provided the only long-term information on the dynamics of M. bovis in live badgers, and is one of the longest running studies of natural infection in any wild mammal population.
Preliminary information on the progression of disease in animals found dead (1975–1992 [Reference Clifton-Hadley, Wilesmith and Stuart7]) and epidemiological characteristics (1981–1985 [Reference Cheeseman8]) of M. bovis infection in this population have already been reported. More recent work described spatio-temporal patterns of infection (1982–1999 [Reference Delahay9]) and the significance of social behaviour and movement [Reference Rogers10, Reference Vicente11]. The present study describes temporal and demographic patterns of infection in live badgers in this population during a 24-year period of intensive investigation. We describe long-term trends in the incidence and prevalence of infection, sources of variation in individual risks of infection and use this unique dataset to estimate M. bovis transmission rates in badgers.
METHODS
Study area and trapping regimen
The study area is located on the Cotswold escarpment, Gloucestershire, South West England, and comprises a heavily wooded valley surrounded by farmland predominated by permanent pasture [Reference Delahay12]. We used data from badger social groups occupying approximately 7 km2 during the period 1982–2005 inclusive, since capture, sampling and diagnostic protocols were consistent during this period. Subsequently the diagnostic testing regimen changed, and hence epidemiological trends from 2006 onwards will be described elsewhere.
Badger social group territories were delineated by an annual bait marking exercise [Reference Delahay13]. A capture-mark-recapture programme provided demographic, morphometric and infection status data [Reference Cheeseman8]. Steel mesh box traps were deployed at the active setts in each social group territory at least four times each year, were baited with peanuts and set after 4–8 days of pre-baiting [Reference Cheeseman, Mallinson, Amlaner and Macdonald14]. Badgers were trapped throughout the year except during a ‘close season’ from February to April inclusive, when females may have young dependent cubs [Reference Woodroffe15].
Examination of captured badgers
Captured badgers were anaesthetized using ketamine hydrochloride (Vetalar™ V, Pharmacia and Upjohn, UK) alone [Reference MacKintosh16] until 2001, and in combination with medetomidine hydrochloride (Domitor®, Pfizer, UK) and butorphanol tartrate (Torbugesic®, Fort Dodge Animal Health Ltd, UK) thereafter [Reference De Leeuw17]. On first capture each badger was tattooed on the belly with a unique identifying code. At each capture badger sex and weight, and the location of the trap were recorded. Cubs were distinguished from adults by their smaller body size, narrower head, bright and silky pelage, and the presence of completely unworn and unstained teeth [Reference Neal and Cheeseman18, Reference Delahay, Harris and Yalden19]. A small number of animals in their second year (yearlings) caught in late spring or early summer could also be distinguished by their body size, narrower head, and bright and silky pelage. The year of birth was assigned as the year of capture for cubs and the year prior to capture for yearlings, but was unknown for animals first caught as adults.
Infection status was determined by the bacterial culture of clinical samples [Reference Gallagher and Horwill20] and a serological test for the presence of antibodies to M. bovis (the Brock Test ELISA [Reference Goodger21]). Clinical samples were taken by tracheal or oesophageal aspirate (sputum), enema (faeces) and palpation (or on occasion catheterization) of the bladder (urine) [Reference Clifton-Hadley, Wilesmith and Stuart7]. Where bite wounds and abscesses were present, swabs or needle aspirates were taken. Blood for serology was taken from the jugular vein. After recovery, all badgers were released at the point of capture.
Social group allocation
Badgers were usually trapped more than once each year. Each badger was allocated to one social group in each calendar year (see [Reference Vicente11] for details). The total number of animals resident in each group was estimated from a minimum number alive (MNA) calculation (see [Reference Rogers6]) using live capture records, as more refined methods are of limited use with small samples sizes.
Infection status
Each badger was allocated to one infection status category in each year. Badgers that were culture negative and either Brock Test negative or no result was available but all subsequent records were negative, were allocated ‘negative’ infection status. Those that were positive on only the Brock Test were considered ‘exposed’. A positive culture result from any clinical sample resulted in ‘excretor’ status, regardless of the Brock Test result, and animals were assigned ‘super-excretor’ status after their second consecutive culture-positive result, or if they provided two positive culture results from different clinical samples at the same capture event. Hence any given individual could progress from ‘negative’ to ‘exposed’ to ‘excretor’ to ‘super-excretor’ status but not in the opposite direction. This is based on the assumption that disease is essentially progressive (see [Reference Delahay9, Reference Vicente11] for supporting evidence). Resolution of early infection may occur [Reference Gallagher22], but containment with or without future progression appears more likely. An animal was deemed an incident case on the first occasion it was positive to a particular test, and was a prevalent case from that point onwards, regardless of subsequent test results.
General demographic and epidemiological trends
Annual population size was estimated using a refinement of the Jolly–Seber method in a POPAN model [Reference Arnason and Schwarz23] in program MARK [Reference White and Burnham24]. The POPAN method is more appropriate than MNA where an unbiased estimate [Reference Arnason25] rather than an index of population size [Reference Rogers6] is required. A Jolly–Seber approach was used to estimate numbers of cubs and adults separately (accounting for differential annual rates of survival and capture probability) in program MARK [Reference White and Burnham24].
Annual prevalence estimates were expressed as the percentage of individuals captured in a given year that fell into each infection status category (i.e. exposed, excretor, super-excretor). Annual incidence estimates were expressed as the percentage of susceptible individuals which were first allocated to one of the three infection states in a given year. Temporal trends were assessed by regressing these percentage estimates (normalized by angular transformation) on year. Further, a smoothing spline with three degrees of freedom was fitted to assess proximal trends within the time series. POPAN estimates of population size [Reference Arnason and Schwarz23] were regressed on (i) concurrent incidence or prevalence and (ii) incidence or prevalence in the following year, and analysed using autoregression to control for temporal autocorrelation.
Estimating transmission rates
The basic reproduction number (R 0) of a pathogen represents the expected number of secondary cases caused by a single infectious individual in a susceptible population. One simple method of estimating R 0 is 1/x*, where x* is the proportion of susceptible animals when the disease is at equilibrium. This is equivalent to R 0 = N*/S*, where N* is the total number of animals and S* is the total number of susceptible individuals in the population at disease equilibrium. We used a MNA estimate for N* (to permit social groups to be selectively removed; see below) and calculated S* by subtracting the number of test-positive (by culture of clinical samples or the Brock Test) individuals. Since there are limitations to the sensitivity of both tests (i.e. 40–53% for the Brock Test (see [Reference Chambers26]) and 20% for culture of clinical samples [Reference Pritchard5]) the true number of positive animals will be underestimated. To investigate the influence of test insensitivity on this calculation, we estimated R 0 after doubling the number of test-positive cases.
Since this high-density badger population is organized into social groups with limited movement between them [Reference Delahay9, Reference Rogers10], transmission rates are unlikely to be uniform. In a number of social groups, test-positive animals were not detected for one or more years [Reference Delahay9], potentially because these groups were never exposed to infection, in which case they would not form part of the susceptible population and could therefore be excluded from calculations of R 0. Hence, we investigated the effect on estimates of R 0 of successively excluding social groups in which no positive cases had been detected for 1, 3, 5 or all years, respectively.
Individual probability of positive test results
GLMMs were conducted to establish the probability of a positive Brock Test result and of a positive culture result relative to sex and age. In both models the individual was fitted as a random effect. Log-linear tests on observed and expected frequencies were conducted to investigate associations within individuals between results of the Brock Test and the culture of clinical samples. Finally, to determine the commonest sources of mycobacterial excretion observed during the study, we restricted capture events to those where at least one clinical sample was culture positive, and summarized the proportion that were positive for sputum, faeces, urine, and bite wounds or abscesses respectively.
Demographic correlates of infection
GLMMs were used to model the probability that an individual badger was an incident or prevalent exposed, excretor or super-excretor case, respectively. In all models the response variable (incident or prevalent case status at each capture event) was binary. Explanatory variables were age (cub or adult), sex, year, season [spring (March–May), summer (June–August), autumn (September–November), winter (December–February)], social group size, the proportion of females and the proportion of adults in the social group. The time (log-transformed days) since last capture (or since an assumed birth date of 1 February [Reference Neal and Cheeseman18] in the case of a first capture) was included as an explanatory variable in analyses of incidence as this represented a potential source of arbitrary bias. The effect of time (in years) was fitted as a third-order polynomial. To avoid pseudo-replication, social group and individual were fitted as random effects.
RESULTS
General demographic and epidemiological trends
From 1982 to 2005 inclusive, the number of badger social groups in the core of the study area remained relatively constant (mean 23·9, range 20–27). During the study 1803 individuals were represented in 9945 badger capture events. Each captured badger was trapped about twice per year (range of annual means 1·6–2·2).
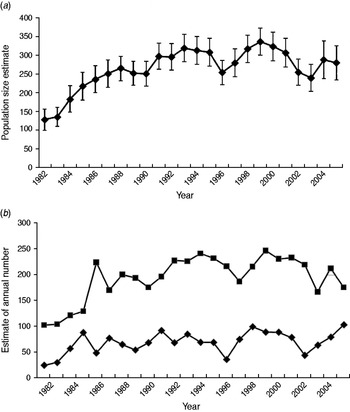
The POPAN estimate of total population size (adults and cubs) for the core area rose from 129 in 1982 to 334 in 1999, declining to 279 in 2005 (Fig. 1a), and annual mean social group size varied from 4·9 to 12·4 (mean 9·4). The estimated adult population size exhibited a similar pattern, but cub numbers fluctuated at a lower level with no obvious overall trend (Fig. 1b).
Estimates of population size for badgers resident in the 7 km2 core of the Woodchester Park study area (1982–2005). Estimates for (a) total population size, and (b) numbers of adults (■) and cubs (⧫) derived from mark-recapture analyses (program MARK).
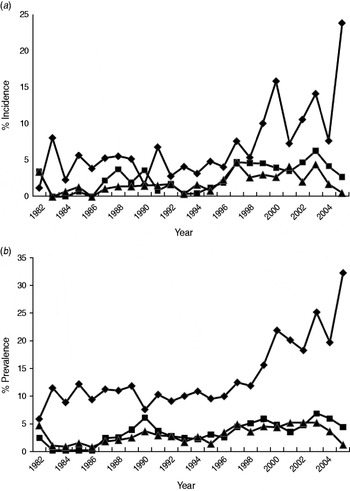
The percentage of incident and prevalent cases in the population varied over time (Fig. 2a, b). Linear regressions identified significant temporal increases in the incidence and prevalence of exposed (P always <0·001), excretor (P always <0·001) and super-excretor (P always <0·05) cases. A marked increase in the incidence and prevalence of exposed cases from 1998 onwards departed markedly from the trends in excretor and super-excretor cases (Fig. 2a, b). Smoothing splines fitted to the incidence and prevalence data for each of the infection categories were significant (P always <0·05), indicating that infection levels in one year were closely related to those in adjacent years.
The annual estimated percentage of (a) incident and (b) prevalent cases of exposed (⧫), excretor (■) and super-excretor (▲) M. bovis infection status categories in the badger population (adults and cubs) of the Woodchester Park study area (1982–2005).
Autoregressions indicated that total population size was not significantly associated with the incidence or prevalence of any infection category in the same year, but was significantly positively related to the prevalence of exposed cases in the following year (n = 23, P < 0·001). When the analysis was confined to adult badgers, population size was significantly negatively related to the prevalence of exposed cases in the same year (n = 24, P = 0·04) but remained positively associated with prevalence in the following year (n = 23, P < 0·001). Adult population size was also significantly positively correlated with the prevalence of excretors (n = 24, P = 0·01) and the incidence of super-excretors (n = 23, P = 0·02) in the following year.
Estimating transmission rates
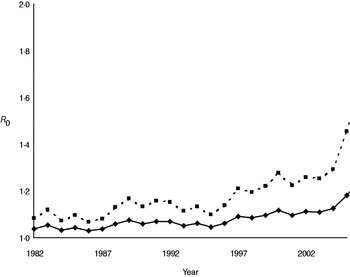
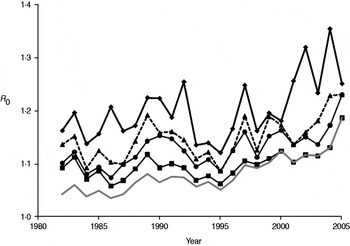
Annual estimates of R 0 (Fig. 3) varied between 1·03 and 1·19, increasing to 1·07 to 1·46 when the number of positive cases was doubled to account for limited test sensitivity. After successively excluding badger social groups with no positive cases in the previous 1, 3, 5 or all years, R 0 increased as expected (Fig. 4). Nevertheless, the maximum value attained was only 1·35 without accounting for limited test sensitivity. For all approaches the R 0 estimate increased over time.
Annual estimates of R 0 for M. bovis infection in the Woodchester Park badger population. The bottom (solid) line is derived from the MNA estimate of population size and the number of animals positive by either The Brock Test or culture of clinical samples. The upper (dashed) line assumes that the number of recorded cases in each year was underestimated by 50%.
Annual estimates of R 0 in the Woodchester Park badger population, calculated after the removal of social groups with successively longer periods over which no cases of M. bovis infection were detected. The lowest line (grey) represents R 0 for all social groups in the study area (i.e. the same as the lower line in Fig. 3). Three other lines indicate the trends in R 0 after excluding groups where no test-positive badgers had been recorded in the previous 1 (⧫), 3 (▲) and 5 (●) years, respectively. A further line (–■–) represents the trend in R 0 after excluding groups that had always remained test negative.
Individual probability of a positive test result
GLMMs showed that positive Brock Test and culture results were more likely in adult badgers than cubs (P always <0·001), but did not differ relative to sex (P always >0·05). The presence of a positive culture result from any clinical sample was significantly positively associated with a contemporary positive Brock Test result (log-linear test, P < 0·001). In capture events when badgers were detected as culture positive (n = 315), the most common source was sputum (53·4%), followed by bites and abscesses (39·4%), faeces (38·8%) and urine (37·2%).
Demographic correlates of infection
GLMMs identified several significant predictors of incident and prevalent cases in captured badgers (Table 1a, b). Cubs were significantly more likely to be exposure incident cases than adults, but there was no age-related difference in the likelihood of being an excretor incident case. Adults were significantly more likely to be incident super-excretor cases and to be exposure, excretor or super-excretor prevalent cases. Sex was not a significant predictor of risk in any analysis. The risk of being an incident case varied seasonally for exposure and excretor states, with the detection of incident cases being highest in spring and lowest in winter. The risk of being an exposure prevalent case was significantly greater in autumn and lowest in winter. There was significant annual variation in the risk of being either an incident or prevalent case for all infection states. None of the group-level variables were significant predictors of incidence or prevalence.
Results from GLMM analyses to partition variation in (a) incidence and (b) prevalence of M. bovis infection categories in the Woodchester Park badger population (1982–2005)

Individual badger and resident social group were fitted as random effects, and the capture interval (i.e. log of days since last capture or estimated birth) was included as a covariate. The response variable was binary in all cases and was modelled with a Bernoulli distribution using a logit link. Coefficients are presented on the logistic scale. Only significant effects are shown. P values <0.05 appear in bold.
DISCUSSION
This study describes key epidemiological characteristics of a unique long-term dataset on M. bovis infection in a wild badger population. Unlike studies using post-mortem data, this allowed the investigation of epidemiological trends over time in a population which has not been the subject of any management interventions.
During this 24-year study the Woodchester Park badger population exhibited initially rapid growth during the 1980s, followed by a levelling out and gradual decline in more recent years. These variations were largely driven by changes in social group size as the number of groups remained similar, indicating that social organization was relatively stable throughout [Reference Delahay9, Reference Vicente11]. This may have implications for large-scale surveys of badgers which estimate population size by multiplying the putative number of social groups by mean group size (e.g. [Reference Wilson, Harris and McLaren27]). Our results suggest that estimates of population size based on sett surveys may require a contemporary estimate of local group size. The temporal trend in cub numbers in our study varied more widely than adults, probably reflecting changing environmental conditions that may influence female reproductive performance and cub survival.
The incidence and prevalence of all M. bovis infection categories in the population varied over time, generally increasing throughout the study (see also [Reference Vicente11]). This upward trend was modest and gradual for excretors and super-excretors, and for exposed cases until about 1998 (see below). The prevalence of M. bovis infection during initial culls of badgers from RBCT areas varied from 0·02 to 0·37 [1]. However, the latter were based on the culture of tissues taken post-mortem which is a more sensitive diagnostic approach [Reference Pritchard5] than the live tests employed in the present study and so results are not directly comparable. Although prevalence and incidence figures in the present study are underestimates, they constitute useful indices of infection when applied consistently over time. One means of improving the accuracy of our estimates would be to combine test results while taking account of their limited sensitivity [Reference Drewe28]. However, this was not advisable in the present study owing to an unexplained rise in the frequency of Brock Test-positive results (see below).
Trends in the incidence and prevalence of badgers excreting M. bovis did not reflect the marked rise and subsequent oscillations in Brock Test positives (i.e. exposed cases) after 1998. The possibility that there had been a genuine increase in TB infection in the badger population with insufficient time elapsed for this to be reflected in the incidence or prevalence of excretion seems unlikely, since infected badgers may live for many years and so there is likely to have been sufficient time since 1998 to have observed a significant increase in excretor cases. A more plausible potential explanation for the unilateral rise in Brock Test-positive cases is some change in the performance of the test. This possibility is supported by the higher estimates of Brock Test sensitivity observed in recent studies than had been reported previously (see [Reference Chambers26]). The Brock Test underwent several refinements since its introduction in 1994, including changes to the nature and source of internal control sera, interpretation of the cut-off, the method of target antigen manufacture and the introduction of different batches of reagents (e.g. wash buffers, detection antibody, conjugate). As each refinement had the potential to influence the performance of the test, their introduction was carefully controlled such that the performance of the test under the new condition was compared with its former performance, and the cut-off for test interpretation was re-evaluated by receiver operating characteristic (ROC) analysis to ensure the specificity of the test was not reduced. Furthermore, the timings of these changes did not appear related in any obvious way to the temporal changes in Brock Test positivity in our study, so it seems unlikely that they can account for the unilateral rise in Brock Test positives. Another possibility is cross-reaction of the Brock Test to other environmental bacteria on the basis of the cross-recognition of MPB83 antigen (e.g. M. microti) [Reference Lyashchenko29]. The suborder Corynebacterineae are a group of bacteria within the order Actinomycetales that includes Rhodococcus, Gordonia, Nocardia and Mycobacteria [Reference Gurtler, Mayall and Seviour30]. The genus Rhodococcus comprises aerobic, Gram-positive, non-motile soil bacteria that occur in a wide variety of environmental niches and R. equi, at least, has been shown to encode a secreted lipoprotein homologous to MPB83 [Reference Letek31]. Furthermore, the Brock Test antigen was purified from whole cell sonicate of M. bovis and it is possible that trace amounts of mycolic acids and other cell wall components are present in the preparation and able to bind antibodies from sera of badgers exposed to Corynebacteria. However, this currently remains speculative as we have no data on environmental exposure to these organisms in our study area. If this phenomenon were responsible for the increase in Brock Test positivity then it suggests that the prevalence of such environmental bacteria is increasing and/or causing significant infection in badgers. To our knowledge, there are no reports of Corynebacteria being isolated from badgers. One further speculative possibility that could explain a unilateral rise in Brock Test positives is that the decrease in badger population density observed from the late 1990s onwards reduced levels of intra-specific competition and associated stress, and in turn lowered the likelihood of disease progression (see below). This could potentially have reduced the detectability of excretion by culture in animals that were Brock Test positive, giving the impression of reduced specificity.
At the present time there is insufficient information to distinguish between these possibilities and hence the temporal trends in exposed cases must be interpreted with caution. From 2006 onwards two further diagnostic tests (the Brock TB Stat-Pak lateral flow serological test [Reference Greenwald32] and gamma interferon release assay [Reference Dalley33]) were introduced to the long-term study, which will permit further investigation of the relative performance of the Brock Test, especially since the Stat-Pak test contains a recombinant source of MPB83 [Reference Greenwald32].
In our study, population size estimates equate to host density as the study area and capture effort remained constant throughout. We identified some associations between this measure of badger density and trends in the incidence and prevalence of M. bovis infection, although patterns were inconsistent and hence difficult to interpret. For example, the prevalence of exposure cases was positively correlated with population size in the preceding year, but negatively correlated with adult population size in the same year. In adults there was also a significant positive relationship between population size and the prevalence of excretors in the following year. If risks of infection increased with density then we would expect lagged positive correlations between population size and measures of TB incidence rather than prevalence, but this was not the case for exposed or excretor categories. However, the observation that population size was positively related to the incidence of super-excretors in the following year, is consistent with a density effect acting on disease progression. One potential explanation is that intra-specific competition increases with population density and creates stressors that enhance the probability of disease progression to super-excretor status in infected individuals. Evidence for density-dependent stressors in badger populations comes from a study of body weight in the same population [Reference Rogers, Cheeseman and Langton34] and of bite wounding in another [Reference Macdonald35].
The availability of a comprehensive long-term dataset on the infection status of individual badgers provided us with an opportunity to derive annual estimates of the basic reproduction number (R 0). This parameter represents the number of secondary cases caused (on average) by a single infectious individual in a susceptible population. There are three major assumptions underlying calculation of R 0, which are often not explicitly stated. First, the estimate relies on density dependence, owing to an assumption that the prevalence of infection (or the number of contacts) scales with host density, although in spatially structured badger populations this may be a simplistic concept for which there is no supporting field evidence either in the present or previous (e.g. [Reference Cheeseman8, Reference Rogers36]) studies of this population. Second, the disease is assumed to be in equilibrium, and this seemed reasonable given our expectation that it was probably present in the population for a number of years, and the limited annual fluctuation through most of the time series. The third assumption is that every individual in the population should have a chance of being infected by the pathogen if it is present, with implied importance for spatial definition of the population at risk. However, when we investigated the impact of removing groups without recent positive cases, increases in R 0 were modest, suggesting that despite pronounced spatio-temporal clustering of infection in this population [Reference Delahay9], accurate definition of the population at risk is not critical to estimation of this parameter. Two previous modelling studies estimated R 0 for M. bovis infection in the badger–cattle host community to lie between 1·1 and 1·2 [Reference Smith37, Reference Cox38], which is consistent with the range of 1·0–1·2 estimated in the present study from field data. When we assumed that poor test sensitivity underestimated the prevalence of TB in the resident badger population by as much as 50%, the corresponding increase in R 0 (to 1·4) was relatively modest. This is because the estimated number of positives represented a relatively small proportion of the total population size. It would therefore require a relatively large increase in the number of positive cases in the population to influence the value of R 0 significantly. Estimates in the range 1·1–1·4 suggest that less than a third of the population would need to be prevented from becoming infectious in order to eradicate the pathogen (see [Reference Anderson and May39]). However, calculations of R 0 (which assume homogenous mixing) for structured populations, where we may expect heterogeneity in contact patterns, will underestimate this parameter, and hence the level of control required to eliminate disease. Consequently, a simulation model of vaccination in a heterogeneously mixing badger population predicted that at least 40% of the population would need to be prevented from becoming infectious in order to eradicate TB [Reference Wilkinson40].
Our study identified a significantly greater likelihood of badgers being detected as an exposure incident case as cubs than adults, but a positive Brock Test result was more likely in adults than cubs. This may seem counter-intuitive, but it should be noted that adults were also more likely to yield positive culture results and once excreting they had a higher chance of also being Brock Test-positive owing to enhanced sensitivity of the test in animals with advanced disease [Reference Clifton-Hadley, Sayers and Stock41]. Nevertheless, the results in cubs suggest that most animals may become exposed in their first year of life, and this may in part explain the observed rise in exposure incident cases in spring (see below). Early infection may be particularly likely where the mother is infectious (see [Reference Delahay9]) and the risk of exposure is likely to increase throughout the first year of life as cubs expand their social network following emergence from the sett. We also found that adults and cubs were equally likely to be detected as excretor incident cases, and that cubs were less likely to be super-excretor incident cases or to yield any culture-positive sample. Such a pattern might be expected if infection of cubs resulted in rapid progression of disease (see [Reference Gallagher and Clifton-Hadley42]) and early mortality. The observation of super-excretor status in some cubs in our study is indicative of cases of advanced disease in early life, and is further evidence for their potential epidemiological importance and relevance to disease control interventions. In this regard, a recent study showed that vaccination of badgers with BCG reduced risks of infection in unvaccinated cubs in the following year [Reference Carter43], suggesting that infection in cubs may not be a barrier to effective disease control.
Seasonal variations in the detection of infection in live badgers have not been systematically investigated previously. The relatively high incidence of exposure and excretor cases we observed in spring could potentially be the result of enhanced susceptibility related to the physiological stress of lactation in females, and post-parturient sexual activity in both sexes. The latter may involve bite-wounding which has been implicated as a potential route of M. bovis transmission [Reference Clifton-Hadley, Wilesmith and Stuart7]. It may also be reasonable to expect more new cases of disease to emerge following a period of close confinement of group members in the main sett over winter. The prevalence of exposure cases peaked in autumn and was lowest in winter which might reflect over-winter disease-induced mortality, although if this were the case then we would have expected a similar pattern in excretors and super-excretors. Further investigations using state-dependent survival analyses may reveal seasonal patterns in disease-induced mortality rates in this population.
The routine and repeated culture of clinical samples from captured badgers in the present study provided unique field data on excretion of M. bovis bacilli from naturally infected animals. This indicated that the most common source of excreted mycobacteria was the pharynx, which is consistent with inhalation being the commonest route of infection in badgers [Reference Gallagher and Clifton-Hadley42]. The excretion of bacteria in faeces, urine and wounds or abscesses occurred with similar frequency. As a live test, the culture of clinical samples has high specificity but low sensitivity to detect infection [Reference Pritchard5, Reference Chambers44, Reference Corner45], although this is likely to be improved in animals with more severe disease which may be shedding higher numbers of bacilli, more frequently and from multiple sites. Hence it is difficult to draw conclusions about the progression of infection in an individual at a given capture event without recourse to previous captures. Further information on typical patterns of disease progression in badgers in this population may be gleaned from investigation of serial data on excretion dynamics in individuals, but that is beyond the scope of the present study.
Long-term studies of infectious disease in free-living wildlife populations are rare. Studies of wildlife disease are often hampered by the limitations of diagnostic tests, which are frequently less reliable than those developed for domestic species. However, the consistent and repeated application of imperfect diagnostic tests in the present study provided useful indices of M. bovis infection in badgers, revealing key epidemiological trends, and corroborating data derived from cross-sectional studies and simulation models.
ACKNOWLEDGEMENTS
The authors thank the Fera Woodchester Park team for carrying out fieldwork, staff of the Bacteriology Department of AHVLA and the Microbiology team at Fera for their technical support. We are also indebted to all the farmers and landowners in the Woodchester Park study area for their cooperation. The project was funded by the Animal Health and Veterinary Group of Defra.
DECLARATION OF INTEREST
None.



