


1. INTRODUCTION
The temperature rise over the past few decades (Stocker and others, Reference Stocker2013) is alarming for glacial health globally including High Mountain Asia (HMA) (Bolch and others, Reference Bolch2012; Gardelle and others, Reference Gardelle, Berthier, Arnaud and Kääb2013). Accelerated warming could affect glacier mass balances at high altitudes and intensify glacier melting (Mountain Research Initiative, Elevation Dependent Warming Working Group, 2015). Such changes would impact future water availability; therefore, hydrological and cryospheric projections require precise glacier mass-balance measurements (Lutz and others, Reference Lutz, Immerzeel, Kraaijenbrink, Shrestha and Bierkens2016). However, in situ glaciological studies remain insufficient due to the extreme topography and hazardous environment. The valley glaciers in western Himalaya and Karakoram are mostly avalanche-fed, with no distinctive equilibrium line altitude (ELA) or accumulation zones (Hewitt, Reference Hewitt2007, Reference Hewitt2011). These glaciers share similar morphologies and have extensive debris coverage (Shroder and others, Reference Shroder, Bishop, Copland and Sloan2000), making it difficult to determine their mass balance using most ground-based methods.
Direct measurements are vital for estimates of future water availability and food security (Kaser and others, Reference Kaser, Cogley, Dyurgerov, Meier and Ohmura2006; Immerzeel and others, Reference Immerzeel, Pellicciotti and Bierkens2013) but the only hydrological mass-balance measurements in the northwestern Himalayan and Karakoram regions of the Indus Basin exist for the Siachen glacier from 1986 to 1990 (Bhutiyani, Reference Bhutiyani1999; Zaman and Liu, Reference Zaman and Liu2015). Field-based geodetic studies using differential GPS (dGPS) and other instruments provide consistent estimates of glacier health (Kaser and others, Reference Kaser, Cogley, Dyurgerov, Meier and Ohmura2006; Cogley, Reference Cogley2009; Tian and others, Reference Tian2014; Muhammad and Tian, Reference Muhammad and Tian2016), but recent in situ dGPS measurements (2014/15) are restricted to the ablation zone for the Sachen glacier of the Astore Basin (Muhammad and Tian, Reference Muhammad and Tian2016). Earlier studies investigated the Astore Valley during 1984, 1993, 1995−97, 2006 and 2010 but focused on the velocities, fluctuations, debris cover and mechanisms of rock glacier formation (Shroder and others, Reference Shroder, Bishop, Copland and Sloan2000; Nüsser and Schmidt, Reference Nüsser and Schmidt2017). Dynamics of the Chungphare glacier were studied for the years 1934, 1958, 1987 and 2010 using repeat photography and multi-temporal mapping (Nüsser and Schmidt, Reference Nüsser and Schmidt2017). Hence, field-based glacier mass-balance measurements are still lacking in the study region (Farhan and others, Reference Farhan, Zhang, Ma, Guo and Ma2015; Muhammad and Tian, Reference Muhammad and Tian2016).
Available glacier observations indicate that Himalayan glaciers have experienced melting and retreat in recent years (Kulkarni and Bahuguna, Reference Kulkarni and Bahuguna2002; Fujita and Nuimura, Reference Fujita and Nuimura2011; Gardner and others, Reference Gardner2013; Vijay and Braun, Reference Vijay and Braun2016; Schmidt and Nüsser, Reference Schmidt and Nüsser2017). Several studies have derived glacier length and area changes to better understand their dynamics in response to climate change (Kulkarni and others, Reference Kulkarni, Rathore, Singh and Bahuguna2011; Muhammad and others, Reference Muhammad, Gul, Javed, Muneer and Waqar2013; Rankl and others, Reference Rankl, Kienholz and Braun2014; Khan and others, Reference Khan, Naz and Bowling2015), however, these changes represent an indirect and delayed response to climate change, varying from years to decades (Pratap and others, Reference Pratap, Dobhal, Bhambri, Mehta and Tewari2016; Zhu and others, Reference Zhu2019). Geodetic mass balance from surface elevation change data provides a more direct assessment of climate-induced glacier changes (Oerlemans, Reference Oerlemans2001; Bonanno and others, Reference Bonanno, Ronchi, Cagnazzi and Provenzale2014). However, the temporal coverage of such studies using remote-sensing data are mostly very limited (Gardelle and others, Reference Gardelle, Berthier, Arnaud and Kääb2013; Rankl and others, Reference Rankl, Kienholz and Braun2014; Kääb and others, Reference Kääb, Treichler, Nuth and Berthier2015; Bolch and others, Reference Bolch, Pieczonka, Mukherjee and Shea2017) and have involved negligible ground validation. Although recent observations have extended the spatial coverage, detailed temporal coverage is missing for each region, and so only provide an overview of the large-scale regional mass balance (Brun and others, Reference Brun, Berthier, Wagnon, Kääb and Treichler2017). Furthermore, validation and comparison of such measurements in the field are still lacking and strongly needed (Kulkarni and Bahuguna, Reference Kulkarni and Bahuguna2002; Bhambri and Bolch, Reference Bhambri and Bolch2009; Muhammad and others, Reference Muhammad, Gul, Javed, Muneer and Waqar2013; Kääb and others, Reference Kääb, Treichler, Nuth and Berthier2015; Khan and others, Reference Khan, Naz and Bowling2015).
Therefore, this study attempted to evaluate the current behaviour of glaciers in the north-western Himalaya in the field. A debris-covered valley glacier was selected to represent the behaviour of regional glaciers since a majority of them are debris-covered at lower elevations. This study investigates Harcho glacier surface elevation changes over the past 17 years (1999−2016). We also use our results to validate the mass balance of observed glaciers (with area ≥ 2 km2) in the Astore Basin derived by Brun and others (Reference Brun, Berthier, Wagnon, Kääb and Treichler2017) using Advanced Spaceborne Thermal Emission and Reflection Radiometer (ASTER) DEM. Furthermore, this work combined available historical data from a 1934 topographical map with more recent photographs taken in 1994 and a high-resolution QuickBird image of 2016 to track terminus changes. The study improves our understanding of the current glacier mass-balance changes in the region providing data on surface elevation change and mass balance.
2. STUDY AREA
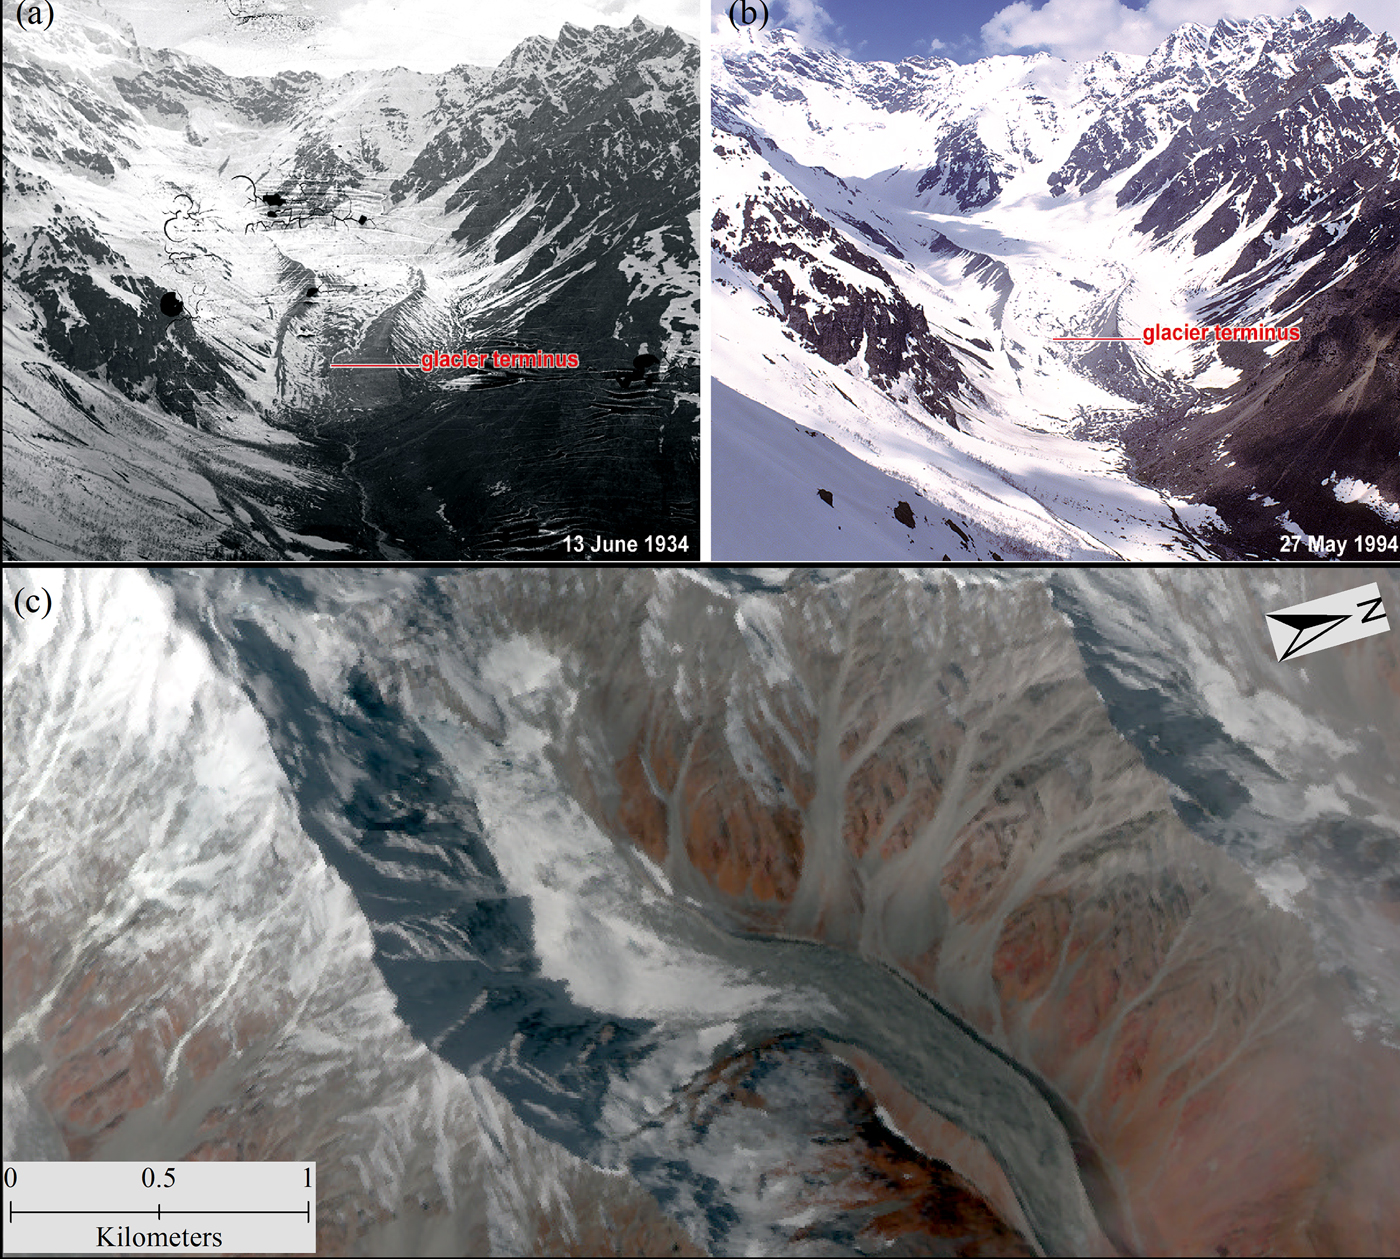
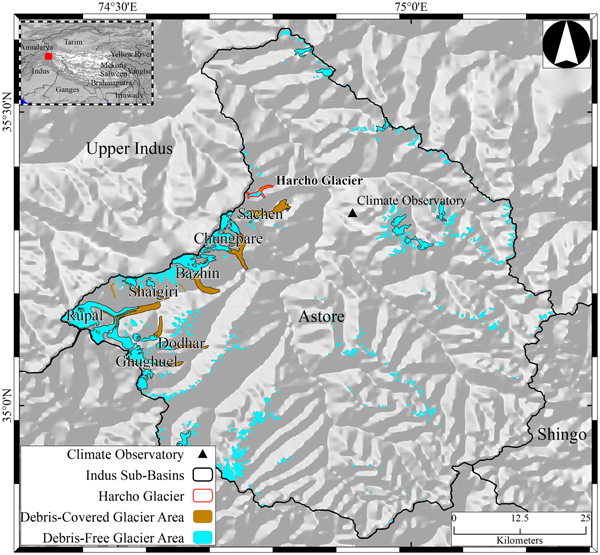
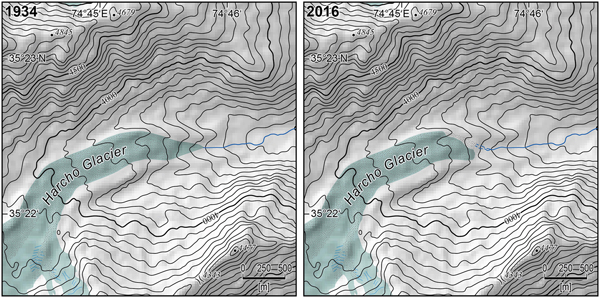
Astore Basin is in the extreme west of Himalaya and upper Indus River Basin, located in the Nanga Parbat area in northern Pakistan. The catchment area of the Astore Basin is ~3995 km2, with glaciers covering ~252 km2 (6.3% of the catchment area), as per Landsat imagery (Path/Row: 149/036) from September 2000, or 258 km2 (6.5%) from the Randolph Glacier Inventory version 6 (RGI6.0 released in 2017). Approximately 45% of the glacier-covered area comprises small cirque-type glaciers. The remaining 55% of the total glacierized area in the basin is covered by 13 debris-covered valley glaciers. Farhan and others (Reference Farhan, Zhang, Ma, Guo and Ma2015) estimated the glacier-covered area of the Astore Basin to be ~14% of the basin, which is more than double of the RGI6.0 and our estimates. The partially debris-covered Harcho glacier is located in the northwestern Himalaya between 35°21′−35°23′ N and 74°43′−74°46′ E (Fig. 1), near to the junction of the Himalaya, Hindukush and Karakoram ranges. The glacier was chosen as a regional representation of the study area, in which most of the glaciers have similar morphologies. The 4.8 km long Harcho glacier covers an area of 2.84 km2, with surface elevations ranging from 3750 to 4965 m a.s.l. The debris-covered and clean-ice portions of the glacier represent ~38 and 62% of the total area, respectively. Figure 1 also highlights glaciers that were studied by Brun and others (Reference Brun, Berthier, Wagnon, Kääb and Treichler2017) as their results will be compared with this study. Figure 2 contains historical photos taken in 1934 (Fig. 2a), 1994 (Fig. 2b) and Harcho glacier surface (debris cover and clean ice) captured by sentinel-2 satellite on 28 October 2016 (Fig. 2c).
Map showing Astore River Basin in the north-western Himalaya. All of the glaciers (debris-free and debris-covered) and the only climate observatory in the basin are presented. The mass balance of the Harcho glacier was observed in the field, whereas data for glaciers outlined in black are from Brun and others (Reference Brun, Berthier, Wagnon, Kääb and Treichler2017).

Comparison of two photos (a) captured on 13 June 1934 (photo taken by Richard Finsterwalder) and (b) on 27 May 1994 (photo taken by Marcus Nüsser) showing the Harcho glacier (from terminus to top) and surroundings. Surface (debris cover and clean ice) of the Harcho glacier can be seen in a high-resolution Sentinel-2 image (S2A_MSIL1C_20161028T054932_N0204_R048_T43SDV_20161028T055734) acquired on 28 October 2016 (c).
3. DATA AND METHOD
We present mass-balance data for Harcho glacier and compare/validate these results with glaciers in the Astore Basin (≥2 km2 area), derived by Brun and others (Reference Brun, Berthier, Wagnon, Kääb and Treichler2017), using ASTER DEM data from the same observation period. The dGPS-based glacier surface elevation measurements were performed from the glacier terminus upwards for a length of 3.9 km, thereby capturing a majority of the total length (4.8 km) of the glacier. The thickness change for the rest of the glacier was extrapolated based on the gradient of elevation change assuming surface elevation change as a function of altitude (Gardelle and others, Reference Gardelle, Berthier and Arnaud2012) to estimate the mass balance of the entire glacier. The following sub-sections describe the methodology for processing satellite images and DEM, dGPS survey of Harcho glacier, SRTM penetration correction, mass-balance estimation and uncertainty estimation.
3.1. Satellite images and DEM
This study mainly utilizes SRTM 30-m non void-filled DEM and dGPS data for the surface elevation change and mass-balance estimates. The glacier boundary was derived from the Sentinel-2 image acquired on 28 October 2016 and provided by the Copernicus Programme (Copernicus). The 10 m resolution of the Sentinel-2 data helped to precisely identify glacier boundaries. The insignificant changes in the glacierized area of the Astore Basin during the study period (Farhan and others, Reference Farhan, Zhang, Ma, Guo and Ma2015) was corroborated using the Sentinel-2 data that were appropriate for this purpose. Among the 16 bands, spectral bands 2–4 (visible) and band 8 (NIR) have 10-m spatial resolutions. The Sentinel Application Platform (SNAP) was used to process the Sentinel data, and the subsequent extraction of the glacier boundary was performed by manual digitization in ArcGIS using RGB-842. The glacier was also classified into debris-covered and debris-free ice using the same Sentinel-2 image by manual digitization. The SRTM DEM is the first high-resolution near-global DEM acquired for the year 2000 based on data acquired between 11 and 22 February and has been available with a 30 m resolution since 23 September 2014 through Earth Explorer (http://www.earthexplorer.usgs.gov). The vertical data of the dGPS were converted to the EGM96-geoid, making the results comparable with the SRTM-based elevations. The conversion from EGM96 to ellipsoid heights was performed using the National Geospatial-Intelligence Agency (NGA) EGM96 model.
3.2. DGPS survey
The dGPS data were acquired during a glacier expedition with the help of local porters in September 2016. Due to the remoteness of Harcho Valley, the expedition reached as far as Rama in the Astore Valley (3200 m a.s.l.). The glacier was surveyed after following an ~9.5 km path and crossing a 4000 m a.s.l. ridge to the south-east. A NavCom Starfire (SF-3050) differential GPS receiver was used for the survey, providing position and height information with accuracies of no more than 0.05 m (Muhammad and Tian, Reference Muhammad and Tian2016). A choke-ring antenna (P/N: 82-001020-3001 LF) was mounted on a mast to avoid multipath errors during the dGPS survey and to acquire data with a vertical accuracy of 10 cm or better. All the dGPS data with a vertical accuracy of <10 cm were discarded before analysis. The tested accuracy of the dGPS instrument used in Tibet was within ± 6 cm (Zhu and others, Reference Zhu, Tian, Wang, Wang and Cui2014). The glacier surface was measured in transverse tracks to improve sampling and to minimize the errors by averaging the differences in the 50 m elevation bins with SRTM 30 m data. The pixel center position represents the pixel location of SRTM data, therefore overlapping dGPS points were compared within 3 m inside from each edge of the SRTM pixel to overcome possible geolocation errors, which are typically <2 m (Rodriguez and others, Reference Rodriguez, Morris and Belz2006; Muhammad and Tian, Reference Muhammad and Tian2016). The glacier was surveyed for 3 days, during which a total of 245 well-distributed data points were collected (Fig. 4). A survey of the valley near the glacier was also conducted, measuring 45 locations over the flat and gently sloping surfaces below the glacier terminus, within the elevation range 3496–3700 m a.s.l. Off-glacier data were used for validation and to make data comparable with the SRTM DEM data. The dGPS data were collected up to an altitude of 4370 m a.s.l. before the glacier was inaccessible due to crevasses and slope steepness. The SRTM elevations of the overlaid pixels were subtracted to estimate the surface elevation changes using Eqn (1).
 $$\Delta {\bi H} = H_{{\rm dGPS}}-H_{{\rm SRTM}}$$
3.3. SRTM penetration correction
The SRTM C-band signal penetration into the glacier must be corrected to precisely estimate surface elevation change and mass balance (Gardelle and others, Reference Gardelle, Berthier and Arnaud2012; Kääb and others, Reference Kääb, Treichler, Nuth and Berthier2015; Dehecq and others, Reference Dehecq2016). The comparison of ICESat laser altimetry data with SRTM C-band data (Kääb and others, Reference Kääb, Berthier, Nuth, Gardelle and Arnaud2012; Reference Kääb, Treichler, Nuth and Berthier2015) is widely used for SRTM C-band penetration estimates for the region. We assume that the February 2000 SRTM elevation represented the debris surface close to the end of the 1999 ablation period, considering penetration of the radar into the snow overlying the debris (Bolch and others, Reference Bolch, Pieczonka, Mukherjee and Shea2017). However, deeper radar penetration is expected in the clean ice surface even considering the February 2000 SRTM acquisition as representative of the 1999 late ablation period. We applied an average penetration estimate of 2 m in the studied region derived from the average of Jammu and Kashmir (1.4 m) and the Karakoram (2.4 m) because the study area lies within these regions and there are no C-band penetration estimates specifically for our study area (Kääb and others, Reference Kääb, Berthier, Nuth, Gardelle and Arnaud2012). The penetration bias was applied to ~25% of the data corresponding to the clean ice surface of the glacier above 4000 m a.s.l.
3.4. Mass-balance estimation
After the penetration correction, the surface elevation change was converted into a mass balance in ice equivalent unit using Eqn (2) (Cogley and others, Reference Cogley2011).
 $$\dot{h}{\rm =} \displaystyle{{\dot{b}} \over {\rho {\rm \;}}} {\rm -} \nabla q{\rm.} $$
where  $\dot{h}$ is the surface elevation change, $\dot{b}$ is the mass balance, ρ is the density of glacier ice, and $\nabla q$ is the horizontal gradient of the glacier. Because the data cover almost the entire glacier, the horizontal ice gradient was assumed to be zero. The mass balance becomes equal to the surface elevation change multiplied by the glacier ice density. This study assumes an 850 ± 60 kg m−3 density throughout the glacier surface assuming a constant density vertical profile, as described by Sorge's law (Bader, Reference Bader1954), as used in other studies (Gardelle and others, Reference Gardelle, Berthier, Arnaud and Kääb2013; Bolch and others, Reference Bolch, Pieczonka, Mukherjee and Shea2017; Zhou and others, Reference Zhou, Li and Li2017). The mass balance was estimated at each measured location over the glacier surface. The point mass balance was then averaged over 50 m elevation contours for discrete data using Eqn (3) (Cogley and others, Reference Cogley2011).
 $$B = \displaystyle{1 \over S}.\sum b_{\rm n}.S_{\rm n}.$$
where S is the surface area and b n and S n are the mass balance and surface area intervals of each 50 m elevation contour band, respectively. The difference in data acquisition times in both the observation years (seasonal) of the two datasets is assumed to be equivalent to the SRTM penetration, making the mass-balance period equal to 17 years (1999 − 2016).
3.5. Uncertainty estimation
The maximum bound of the overall uncertainty in the surface elevation change and mass balance of the Harcho glacier was estimated using Eqn (4) (Bolch and others, Reference Bolch, Pieczonka, Mukherjee and Shea2017).
 $$E = E_{\Delta {\bf h}} + E_{\bf a} + E_{\bf p} + E_{\bf m}$$
where E Δh is the error due to elevation difference in the off-glacier areas (comparing SRTM with dGPS data); E a is the change in the glacier-covered area; E p and E m are the error in the penetration and density assumptions. E a was considered to be negligible, assuming no significant difference in the actual and mapped glacier coverages. E Δh was derived (±0.03 m a−1) by comparing off-glacier data from both the datasets. We estimated E p to be 0.04 m w.e. a−1 (an uncertainty of ±0.7 m in penetration estimate for the region (Kääb and others, Reference Kääb, Berthier, Nuth, Gardelle and Arnaud2012)) and E m to be 7% (±60 kg m−3) of the elevation change (Huss, Reference Huss2013; Bolch and others, Reference Bolch, Pieczonka, Mukherjee and Shea2017).
4. RESULTS
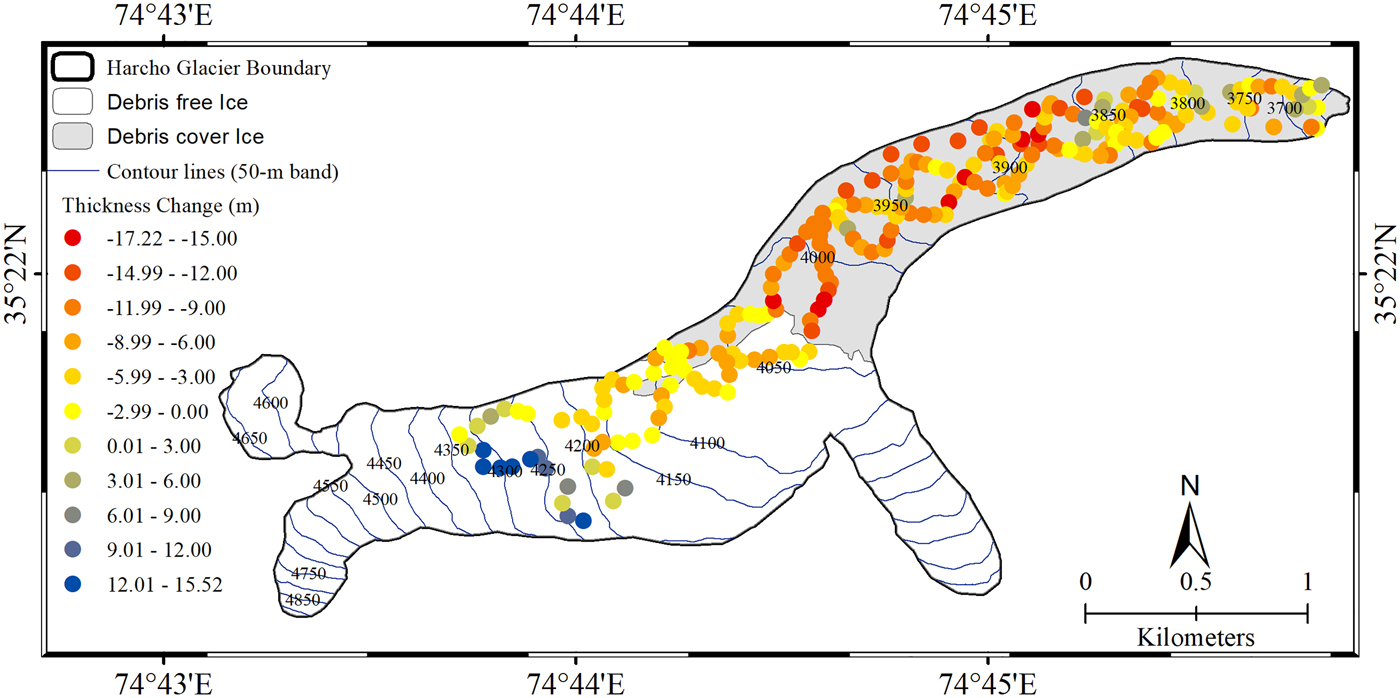
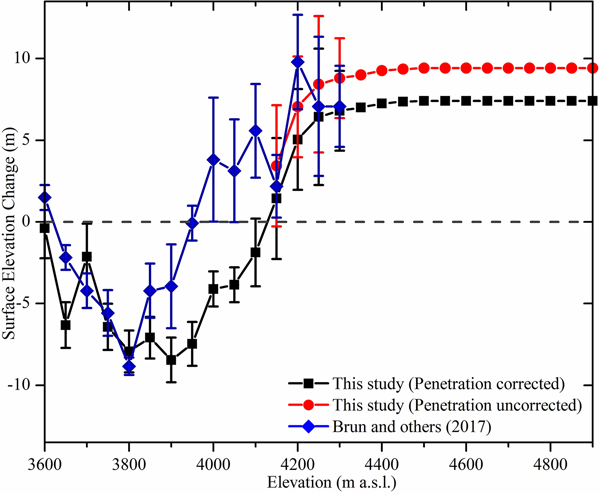
By comparing the differences in the measured dGPS data and the SRTM data, we estimated the glacier surface elevation changes, ranging between −17.2 and +15.5 m. More than 50% of the observed glacier surface elevation changes varied within ±7 m. The calculated glacier surface elevation changes are inhomogeneous in each of the elevation zones along the glacier. The thick debris-covered terminus exhibits slight surface elevation lowering with significant heterogeneity (Figs 3, 4). Most of the debris-covered part shows a negative surface elevation change. However, the elevation changes vary positively from the middle to the upper (clean ice) zone of the glacier. A general negative surface elevation change characterizes the debris-covered ablation zone (from the terminus up to 4200 m a.s.l., as shown in Fig. 3), whereas positive changes occur in the clean ice portions of the glacier.
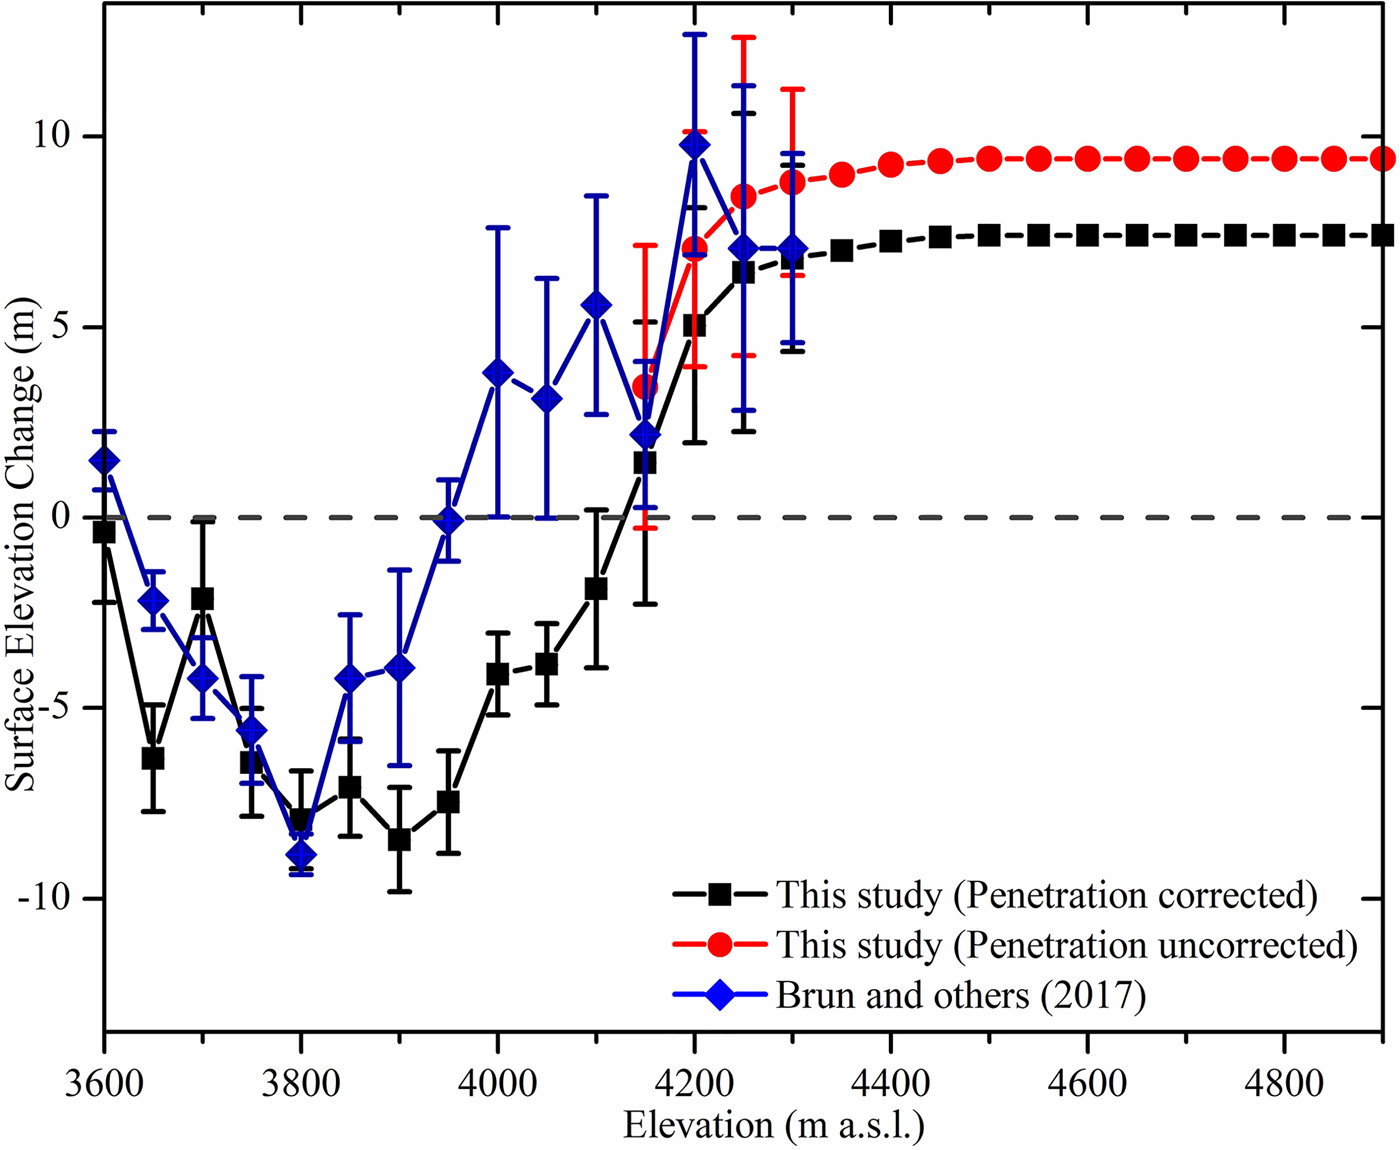
Harcho glacier surface elevation changes (m) in each 50-m elevation bin from the terminus to the top of the glacier. Error bars are derived from the uncertainties described in section 3.4, scaled according to the sample size in each bin. The line without error bars shows extrapolated surface elevation change (m).
Map of the glacier surface elevation change (m) between 1999 and 2016 at all measured points on Harcho glacier. 50-m elevation contour lines are overlaid on the glacier. The debris-covered part of the glacier is shown with a grey background, and the debris-free zone is in white.
For the GPS-surveyed lower and mid sections of the glacier, the average annual elevation change relative to the SRTM DEM before penetration correction was −0.20 ± 0.18 m a−1, and after correction was −0.22 ± 0.19 m a−1. Extrapolating the height changes to cover the entire glacier, the mean annual surface elevation change was −0.10 ± 0.09 m a−1 during 1999–2016. Conversions of the surface elevation change to the mass balance for the entire glacier based on the standard average density assumption (850 ± 60 kg m−3) before penetration correction produce values of −0.05 ± 0.07 m w.e.a−1 which is close to the penetration-corrected mass balance −0.08 ± 0.07 m w.e. a−1 during the study period. Figure 3 shows the mean elevation changes from the terminus to the top of the glacier with 50 m elevation bins for each observed interval. The map in Figure 4 shows the spatial distribution of the surface elevation changes of each measured location. Based on a comparison of a historical topographic map from 1934 at a scale of 1: 50 000 (Finsterwalder, Reference Finsterwalder1937) with the QuickBird satellite data from 2016, the glacier terminus has retreated 368 m (Fig. 5).
Sketched map based on a comparison of the historical topographic map and recent QuickBird image of the Harcho glacier showing the change in terminus position between 1934 and 2016.
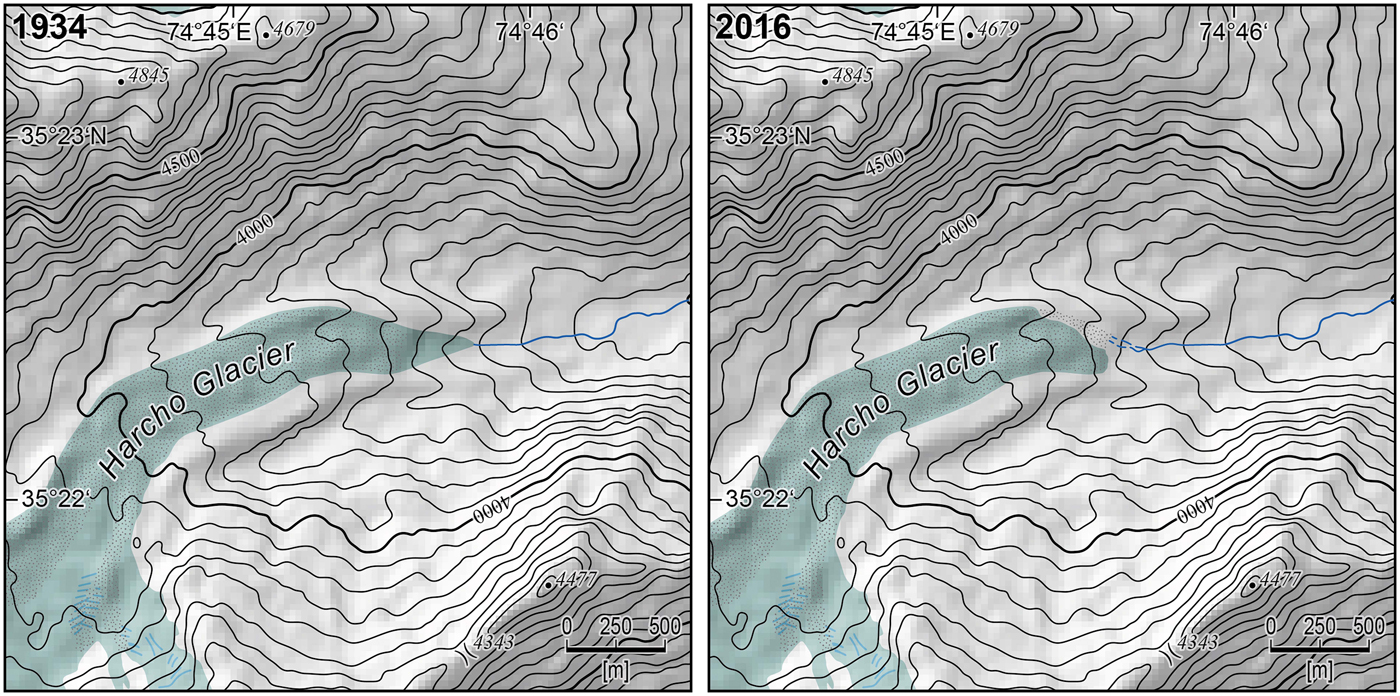
Table 1 presents the annual average mass balance of 19 glaciers (≥2 km2) derived by Brun and others (Reference Brun, Berthier, Wagnon, Kääb and Treichler2017) for 2000–2016. These glaciers cover ~60% of the total glaciated area of the Astore Basin. The annual mass balance of these glaciers was estimated using ASTER DEMs, and vary between −0.35 ± 0.29 and +0.32 ± 0.26 m w.e. a−1. The area-weighted average annual mass balance of all these glaciers is almost zero in the study period. Eleven of the observed 19 glaciers show negative mass balance. The largest glacier (the Toshain glacier, with an area 44.48 km2) shows a negative mass balance in contrast to the slight positive mass balance of glaciers with more than 10 km2. Seven of the nine glaciers with area <3 km2 show a negative mass balance, while only four of the remaining ten glaciers (>3 km2) show negative mass balance. These results suggest that most of the small glaciers (<3 km2) are losing mass. In addition, the direct observation of the Harcho glacier confirmed minor mass loss compared with almost equivalent results of insignificant mass change within the uncertainty range derived from ASTER DEM over the observed period.
Mass balance of glaciers in the Astore Basin (area ≥ 2 km2) estimated by Brun and others (Reference Brun, Berthier, Wagnon, Kääb and Treichler2017)
Lat, Lon, Zmin and Zmax are Latitude, Longitude, Minimum elevation and Maximum elevation (a.s.l.), respectively.
5. DISCUSSION
The lack of mass-balance measurements and the paucity of ground data hinders our understanding of current glacier behaviour in the northwestern Himalaya (Phillips and others, Reference Phillips2000; Shroder and others, Reference Shroder, Bishop, Copland and Sloan2000; Schmidt and Nüsser, Reference Schmidt and Nüsser2009; Hewitt, Reference Hewitt2011; Muhammad and Tian, Reference Muhammad and Tian2016; Nüsser and Schmidt, Reference Nüsser and Schmidt2017), leading to ambiguous future projections. Previous studies in the area did not investigate mass balances but instead focused on changes in terminus positions, ablation zones, formation of rock glaciers and the impact of monsoons on glaciers, and most are limited to the more accessible glaciers in the Astore Basin, such as Sachen and Chungphare (Farhan and others, Reference Farhan, Zhang, Ma, Guo and Ma2015; Muhammad and Tian, Reference Muhammad and Tian2016; Nüsser and Schmidt, Reference Nüsser and Schmidt2017). This study deals with a relatively small nonsurging glacier that is adjacent to Sachen, with similar topography and debris cover but no history of ground measurements in the literature.
To the best of our knowledge, this is the first remote-sensing and ground-based data comparison for mass-balance measurements between 1999 and 2016 in the north-western Himalaya, using well-suited geodetic methods. One-time data are freely available for the oldest near-global comparatively high-resolution remote-sensing SRTM DEM, thereby providing the initiative to obtain further field-based mass-balance measurements in the region. The selection of debris-covered glacier enables us to understand the impact of debris cover on surface elevation change. These results were also compared to validate the mass balance derived for 19 individual glaciers (≥2 km2 area) from ASTER DEMs in the same period (Brun and others, Reference Brun, Berthier, Wagnon, Kääb and Treichler2017). Terminus position change was observed for an extended period between 1934 and 2016.
The north-western Himalayan Mountains are adjacent to the Karakoram Mountains, and several recent studies have suggested balanced glacier conditions or slight mass losses in Karakoram glaciers (Cogley, Reference Cogley2012; Kääb and others, Reference Kääb, Treichler, Nuth and Berthier2015; Bolch and others, Reference Bolch, Pieczonka, Mukherjee and Shea2017; Zhou and others, Reference Zhou, Li and Li2017). Our elevation change observations for the rough glacier surface from the terminus to ~3850 m a.s.l. reveal a locally heterogeneous pattern, with a relatively smooth transition from thinning to thickening going from debris-covered to clean ice in the middle to upper portions of the glacier (Fig. 3). At the transition from the debris-covered to debris-free part (~4050 m a.s.l.), the surface elevation change was −0.26 m a−1 and −0.20 m a−1, respectively (the debris-free part showed surface elevation change of −0.12 m a−1 before SRTM C-band penetration correction).
The interpolated full-glacier and penetration-corrected mass balance of −0.08 ± 0.07 m w.e. a−1 is the lowest in the Himalaya but similar to recent findings in the Karakoram. This is likely to be due to regional climatic similarities to the adjacent Karakoram region, where glacial changes are also small. These estimates contrast in particular with the rapidly thinning glaciers in the central and eastern Himalaya. Observations of glaciers in Spiti-Lahaul (to the east of the study region, in the western Himalaya) show a mass loss of −0.7 to −0.8 m w.e. a−1 between 1999 and 2004 (Berthier and others, Reference Berthier2007). The recent mass-balance estimates for this region during 2003–08 and 1999–2011 show significantly negative results, that is −0.49 ± 0.12 and −0.53 ± 0.16 m w.e. a−1 (Gardelle and others, Reference Gardelle, Berthier, Arnaud and Kääb2013; Kääb and others, Reference Kääb, Treichler, Nuth and Berthier2015), respectively, but are lower than observations from earlier periods. In addition, the glaciers of both the Astore Basin and the Kang Yatze Massif in Ladakh experienced rapid retreating trends, with area losses of 14% (0.3% a−1), between 1969 and 2010 (Schmidt and Nüsser, Reference Schmidt and Nüsser2012). Similarly, the mass loss in the eastern Himalaya (Eastern Nyainqentanglha) is −1.34 ± 0.29 m w.e. a−1, which was the most negative in the Himalaya between 2003 and 2009 (Kääb and others, Reference Kääb, Treichler, Nuth and Berthier2015). This study estimated precise glacier changes and might be helpful in future water resource and hazard management (Tian and others, Reference Tian2017). Further temporal and spatial extensions of the study are necessary to improve our understanding of glaciers in the western part of the Himalayan and Karakoram ranges.
Our ground observations help reduce the uncertainty in glacier mass balance and allows for comparison and evaluation with earlier findings. The spatial distribution of surface elevation changes within each 50 m elevation contour in our field-based results of Harcho glacier agree within their uncertainties with the remote-sensing estimates by Brun and others (Reference Brun, Berthier, Wagnon, Kääb and Treichler2017) (Fig. 3), though the uncertainties are significant on the glacier scale. The disagreement in height change in the central part of glacier (Fig. 3) suggests that bias is present in either the SRTM DEM or ASTER results used in this study. The use of dGPS helped to reduce the uncertainty in the estimated mass balance. Most of the uncertainty in our results is due to the use of SRTM as one-time data, which could be reduced using repeated dGPS surveys for mass-balance studies. Considering the uncertainty in our results, we expect that Harcho glacier experienced a slight mass loss rather than gain as derived by Brun and others (Reference Brun, Berthier, Wagnon, Kääb and Treichler2017).
As well as observing both thinning and thickening on one glacier, we note that the mass balance of neighbouring glaciers in the Astore Basin observed by Brun and others (Reference Brun, Berthier, Wagnon, Kääb and Treichler2017) is also heterogeneous. The largest glacier (Toshain) shows the second most negative mass balance in contrast to the observed slightly positive mass balance of other large glaciers. Recent observations in the ablation zone of the nearby Sachen glacier agree with the results of this study (Muhammad and Tian, Reference Muhammad and Tian2016). The extensive debris coverage and the combined climate effects of the westerlies and South Asia monsoon (similar to the Karakoram glacial setting) are the most likely reasons for the limited glacier retreat in the western Himalaya. These changes are also consistent with recent insignificant changes in temperature and precipitation records reported in the Astore Basin (Muhammad and Tian, Reference Muhammad and Tian2016).
6. CONCLUSIONS
This study estimates the mass balance of Harcho glacier in the northwestern Himalaya using comparisons of dGPS and SRTM 30 m DEM data covering the period between 1999 and 2016. The results are compared with mass-balance estimates derived by Brun and others (Reference Brun, Berthier, Wagnon, Kääb and Treichler2017). The surface elevation changes of the Harcho glacier show complex patterns from the terminus to the top. The changes vary heterogeneously in the lower part up to 3800 m a.s.l., exhibit relatively smooth and significant thinning up to 4200 m a.s.l. and transition to thickening in the upper parts. Extrapolation to the full glacier area indicates a slight overall thinning and a mass loss of −0.08 ± 0.07 m w.e. a−1 during the study period. These results are more negative than those derived from Brun and others (Reference Brun, Berthier, Wagnon, Kääb and Treichler2017) using ASTER DEM, that is +0.03 ± 0.24 m w.e. a−1. However, our ground observations have lower uncertainty relative to those from remote sensing alone (Brun and others, Reference Brun, Berthier, Wagnon, Kääb and Treichler2017). These changes suggest that glaciers in the north-western Himalaya are also slightly losing mass and are comparable with the adjacent Karakoram region over the 17 years (1999–2016). As our study covers ~60% of the glaciers in the Astore Basin, some uncertainty may remain for the entire basin. Long-term changes suggest that the slight changes in recent years (Muhammad and Tian, Reference Muhammad and Tian2016) are in contrast to substantial losses in the past. In addition, future measurements in comparison with historical stereo images (Hexagon), elevation data (e.g. SRTM, etc.) and stereo images (e.g. ASTER) will minimize uncertainties and help to extend glacier observations in the region.
ACKNOWLEDGEMENTS
This work is funded by the National Natural Science Foundation of China (grant no. 41530748, 41671072, and no. 41761144075). We acknowledge the freely available, recently released SRTM 30 m elevation data from http://www.earthexplorer.usgs.gov, provided courtesy of NASA JPL, and the Sentinel-2 satellite data, provided by the European Space Agency at http://www.scihub.copernicus.eu/dhus/#/home. We also acknowledge Fanny Brun for providing mass-balance results of glaciers in the Astore Basin. We are thankful to the scientific editor Hamish Pritchard and four anonymous reviewers for their constructive review. We are also thankful to Kenneth Hewitt and Graham Cogley for their valuable suggestions on the early version of the manuscript. The first author also acknowledges funding to perform field surveys in the Astore Valley, north-western Himalaya, northern Pakistan.
AUTHOR CONTRIBUTIONS
Sher Muhammad and Lide Tian designed the study. Sher Muhammad performed the analyses and wrote the manuscript. Marcus Nüsser provided historical photos and the sketch map. Lide Tian and Marcus Nüsser commented on and edited the manuscript.
CONFLICTS OF INTEREST
The authors declare no conflict of interest.


 Open access