


Introduction
Spotted stem borer, Chilo partellus (Crambidae: Lepidoptera), is one of the Chilo species that feeds on a wide range of cereals in the tropical regions (Achiri et al., Reference Achiri, Atakan and Pehlivan2022). It causes 18–25% yield losses in crops like maize and sorghum in Asian and African continents (Dhaliwal et al., Reference Dhaliwal, Jindal and Mohindru2015). C. partellus is sporadic in nature and highly influenced by the environment (Khadioli et al., Reference Khadioli, Tonnang, Muchugu, Ong’Amo, Achia, Kipchirchir, Kroschel and Le Ru2014). In many cases, the C. partellus genotypes identified as either resistant or tolerant in one region turn susceptible in other locations, indicating a combination of genotype × environment (G × E) interactions among wide geographical areas (Dhillon et al., Reference Dhillon, Tanwar, Kumar, Hasan, Sharma, Jaba and Sharma2021). It is also reported with huge physiological variability, such as diapause and non-diapausing populations (Dhillon et al., Reference Dhillon, Hasan, Tanwar, Jaba, Singh and Sharma2020), and post-diapause developmental stages with altered reproductive physiology (Dhillon and Hasan, Reference Dhillon and Hasan2018). Genetic polymorphism is also reported when diapause and non-diapause C. partellus strains within and across geographical regions were crossed (Dhillon and Hasan, Reference Dhillon and Hasan2018). This kind of mating behaviour also influenced the population build-up of C. partellus (Dhillon et al., Reference Dhillon, Tanwar, Hasan and Bhadauriya2022).
The phenotypic variation in insects is mainly due to their distinct geographic habitants, where the genetic exchange among the cohabitants and their interactions makes a unique gene pool rather than a common genetic make-up (Singer and McBride, Reference Singer and McBride2012; James et al., Reference James, Cooke, Brunet, Lumley, Sperling, Fortin, Quinn and Sturtevant2015). Thus, the research exploration for the identification of resistant sorghum genotype against insect pests revealed that the resistant or tolerant source identified at one location was found susceptible at other places (Sharma et al., Reference Sharma, Dhillon, Pampapathy and Reddy2007). India has huge, diverse climatic conditions, and the C. partellus larvae have been recorded to undergo both hibernation and aestivation in northern and southern regions, respectively. Besides, the non-diapause strains also exhibit different larval phenotypes (Dhillon et al., Reference Dhillon, Hasan, Tanwar and Bhadauriya2017). Because of dynamic climatic conditions, change in cropping systems, and high-dose insecticide applications, the C. partellus populations adapt themselves through host shift, change in feeding behaviour, reproductive physiology, ecological adaptation, behavioural pattern, and genetic drift in their population (Sau et al., Reference Sau, Chandrakumara, Tanwar and Dhillon2022). Therefore, the comprehensive knowledge of the genetic make-up and its variations among the insect pest populations from different geographical regions is a prerequisite for conceptualising the sustainable pest management strategy (Geetharajalakshmi et al., Reference Geetharajalakshmi, Subramanian, Shanmugasundaram and Mohankumar2006; Murali et al., Reference Murali, Hilda, Ramakrishnan, Ganesh, Bhuvaragavan and Janarthanan2021). In this regard, the molecular markers are considered an important and valuable tool for assessing the genetic variability at the population level (Ojha et al., Reference Ojha, Jalali, Poorani and Murthy2016).
Among the various molecular markers, the mitochondrial genes play a major role because of their high copy number in each cell, which enables faster amplification (Gissi et al., Reference Gissi, Iannelli and Pesole2004). In addition, features like maternal inheritance with few genetic recombination, conserved composition, and an intron-less region make them a highly preferred choice for evolutionary research rather than the markers targeting nuclear gene (Padwal et al., Reference Padwal, Chakravarty and Srivastava2022). Besides, the availability of a wide range of primers for the mitochondrial gene amplification from both invertebrate and vertebrate phyla establishes the mitochondrial gene as a good target for species identification in animals (Yang et al., Reference Yang, Tan, Wang, Xue, Guan, Huang and Li2014; Elyasigorji et al., Reference Elyasigorji, Izadpanah, Hadi and Zare2023). Among the mitochondrial genes, the cytochrome oxidase I (COI) gene was found to be very essential in differentiating cryptic species among the population (Shashank et al., Reference Shashank, Naveena, Rajgopal, Elliott, Sreedevi, Sunil and Meshram2022), as well as in intraspecific diversity assessment (Sun et al., Reference Sun, Dong, Gao, Su, Qian, Bai, Zhang and Cong2015; Chakravarty et al., Reference Chakravarty, Padwal and Srivastava2021), because of its huge size and high nucleotide substitution rate (De Mandal et al., Reference De Mandal, Chhakchhuak, Gurusubramanian and Kumar2014).
Because of high physiological variations, phenotypic plasticity, and G × E interactions, the C. partellus exhibits inconsistent responses to the source of resistance across diverse geographical locations. Therefore, studying the genetic structure and population diversity is essential to understand these reasons for diverse geographical adaptations, and in turn, it will help to develop the practices for sustainable pest management. Besides, the mitochondrial DNA (mtDNA) markers, particularly those encoding cytochrome b (Cytb), cytochrome c oxidase subunits I and II (COI and COII), and 16S rRNA, are widely used to assess genetic diversity due to their high mutation rates, maternal inheritance, and limited recombination potential for assessing intraspecific variation and cryptic diversity in C. partellus. Thus, the present study was undertaken to trace the genetic variability among different agroclimatic zones of C. partellus populations from India based on multilocus mtDNA markers.
Materials and methods
Insect collection and population maintenance
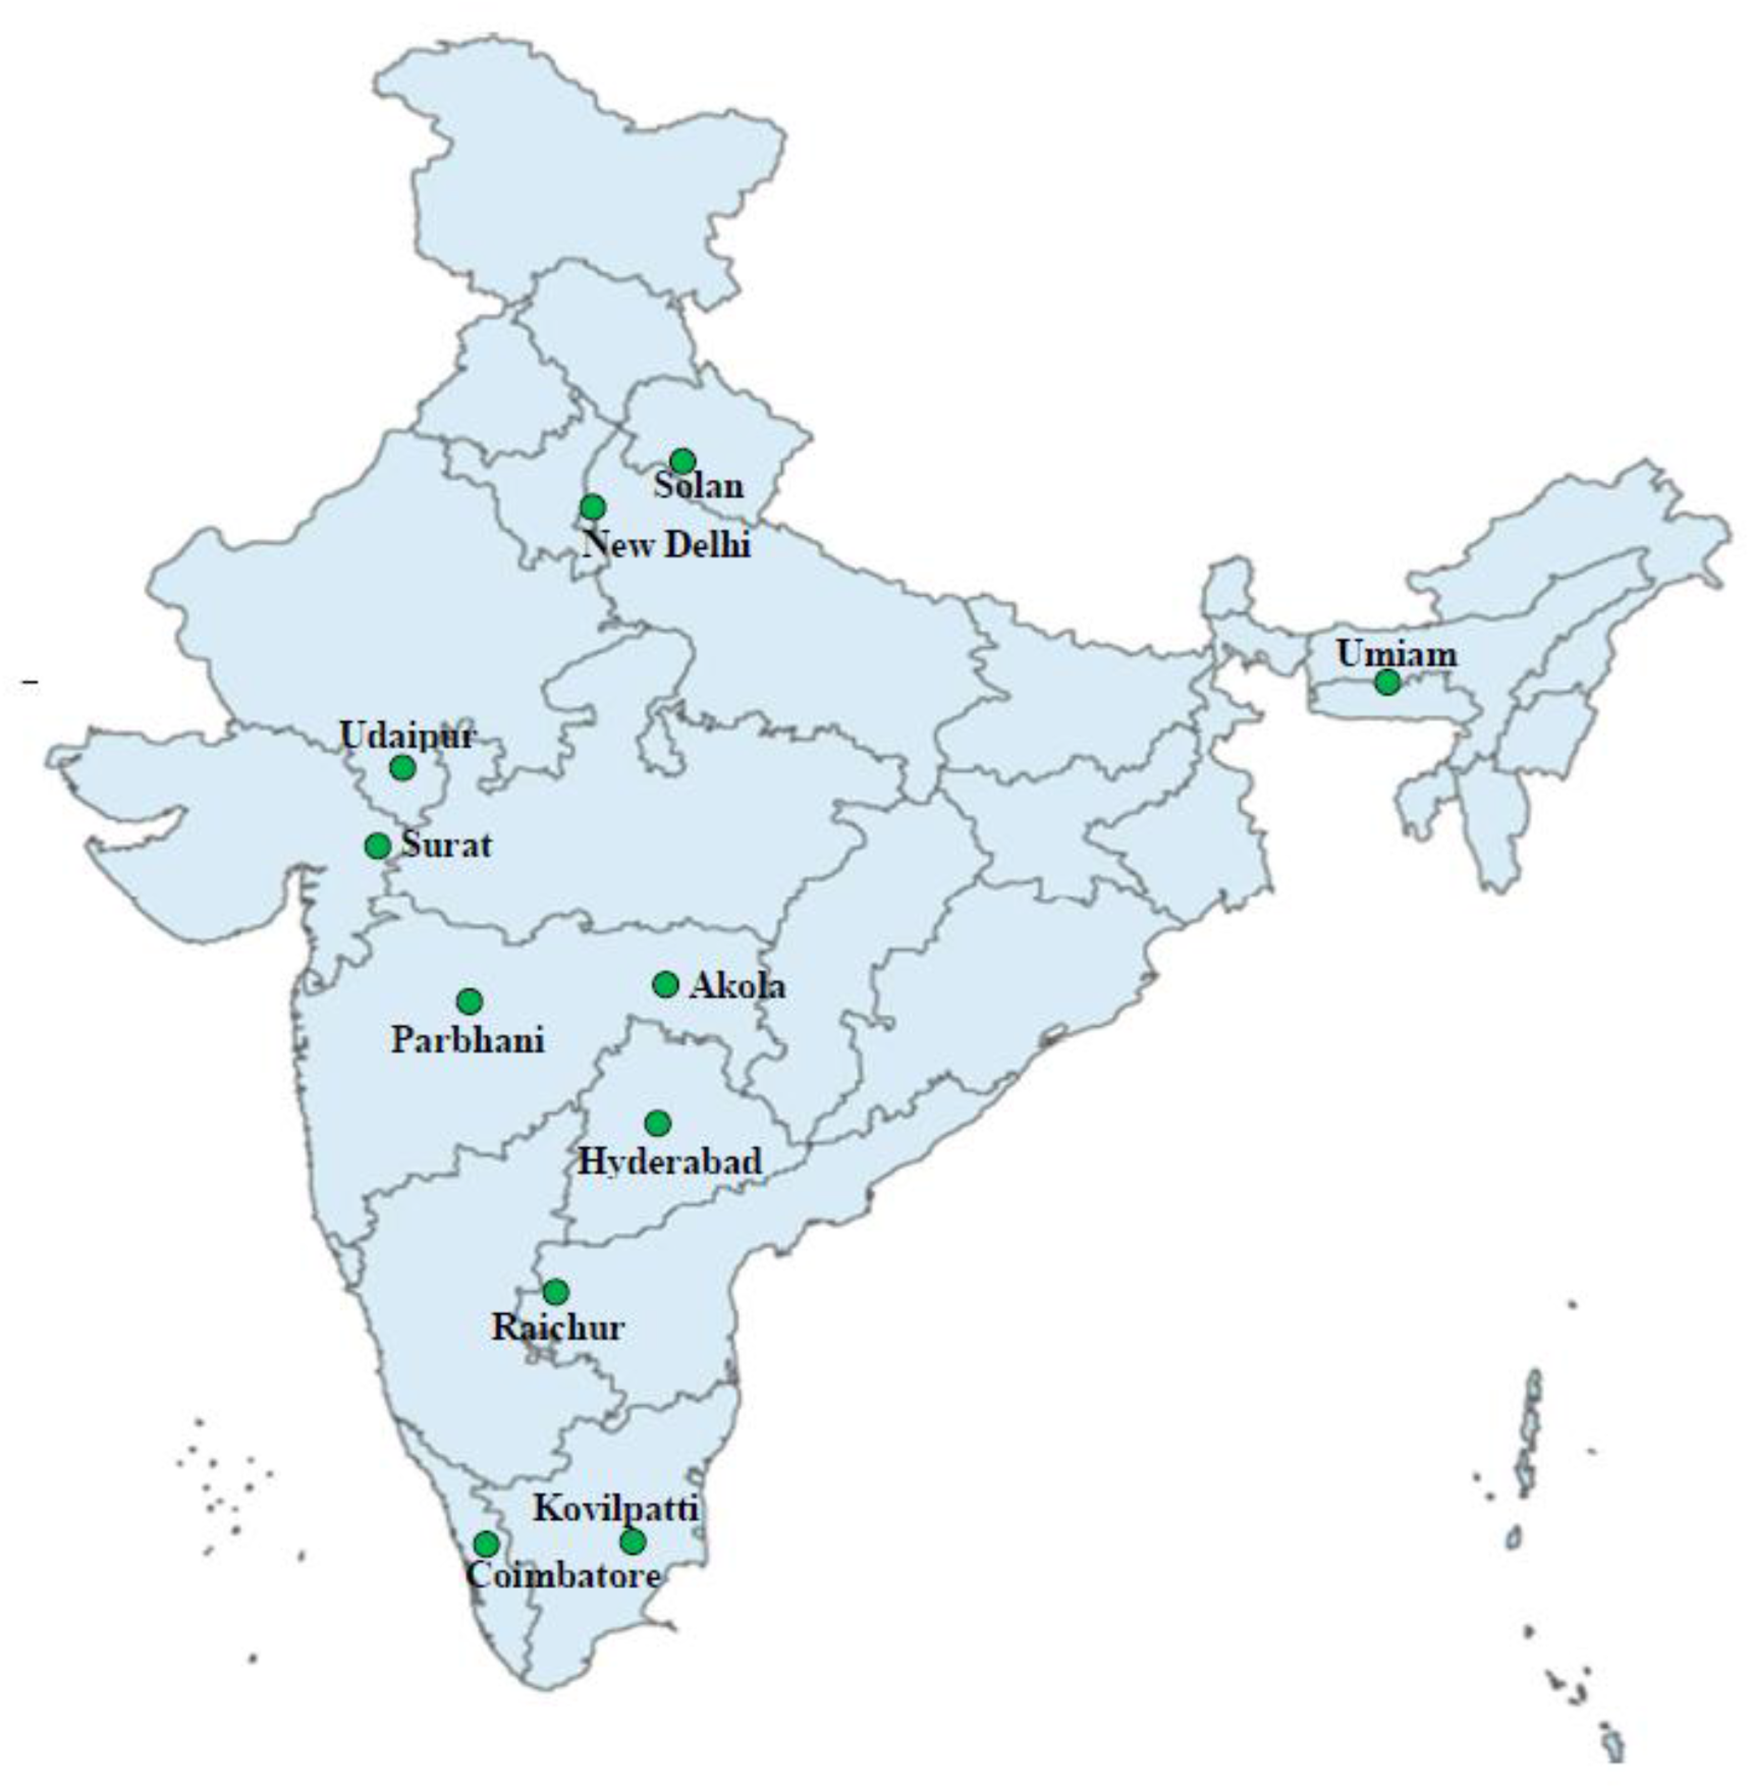
The larvae of C. partellus were collected from the maize fields in 11 different geographical regions of India, i.e. New Delhi (NCT Delhi), Solan (Himachal Pradesh), Umiam (Meghalaya), Udaipur (Rajasthan), Surat (Gujarat), Akola and Parbhani (Maharashtra), Hyderabad (Telangana), Raichur (Karnataka), Kovilpatti (Tamil Nadu), and Coimbatore (Tamil Nadu) as depicted in the map (Fig. 1) between February 2015 and June 2017. The field-collected C. partellus populations were reared separately on the green stalks of maize genotype (Basi Local) under controlled laboratory conditions (temperature: 27 ± 1°C, relative humidity: 65 ± 5%, and 12 h of each light and dark cycle) at the insect bioassay laboratory in the ICAR-Indian Agricultural Research Institute, New Delhi, India. The adults were paired singly, and the third instar F1 generation larvae thus obtained were used for the present study on molecular diversity among C. partellus populations collected across India. The larvae were starved for 4 h and stored at −80°C prior to molecular studies.
Population of Chilo partellus collected from the different geographical regions of India.

Figure 1 Long description
A map of India highlighting specific locations with green dots. The marked locations are New Delhi in the north, Solan in Himachal Pradesh, Umiam in Meghalaya, Udaipur in Rajasthan, Surat in Gujarat, Parbhani and Akola in Maharashtra, Hyderabad in Telangana, Raichur in Karnataka and Kovilpatti and Coimbatore in Tamil Nadu. Each location is labeled with its name.
DNA isolation and amplification
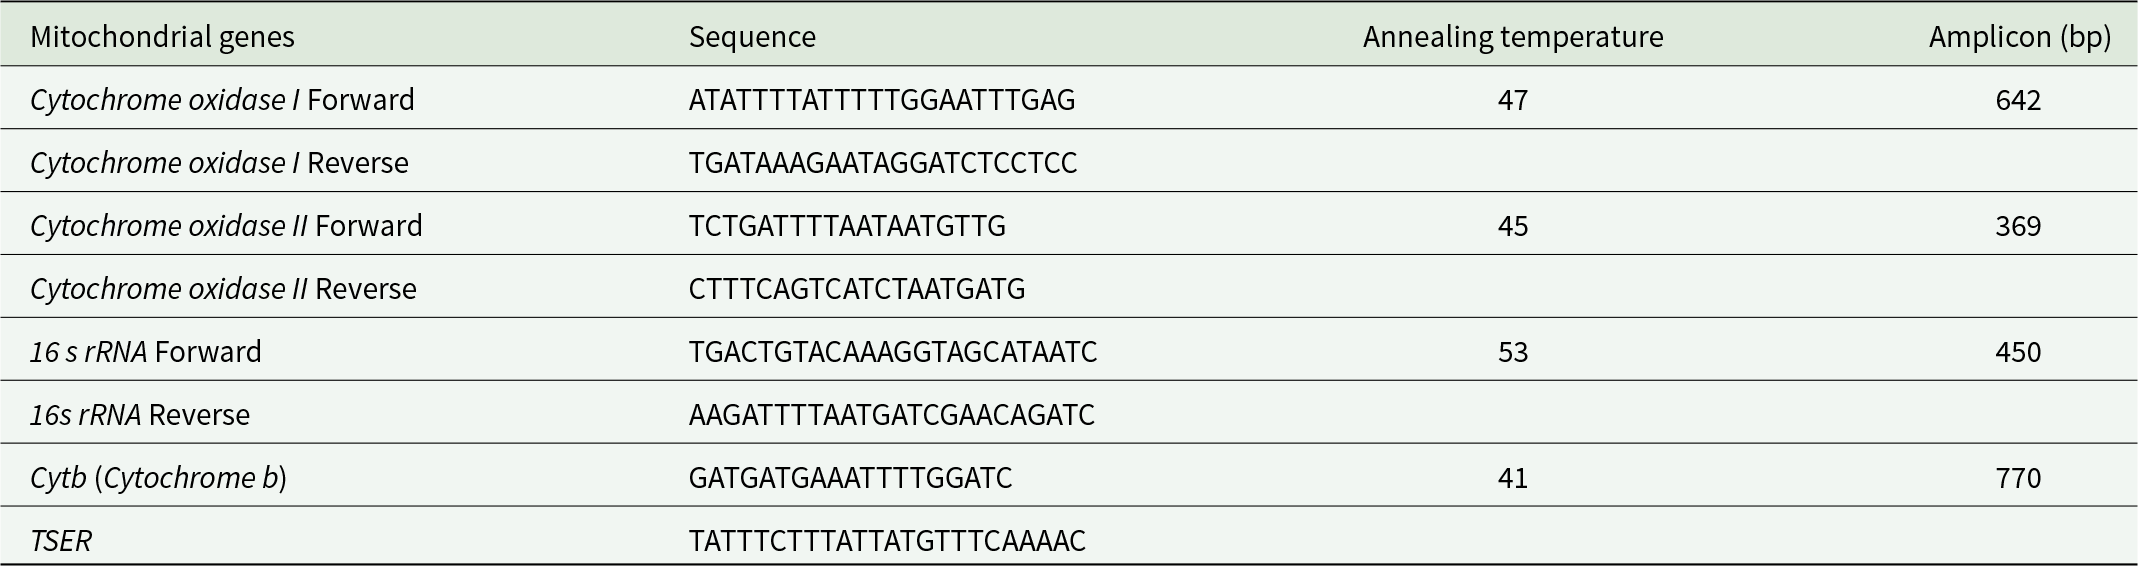
The genomic DNA was isolated using the InstaGeneTM Matrix Genomic DNA isolation kit, following the manufacturer’s protocol. The quantification of DNA samples was conducted by UV spectrophotometry (Elico® SL191), and the quality was checked on 0.8% (w/v) agarose gel. The polymerase chain reaction (PCR) was performed to amplify the different mitochondrial gene sequences using the gene-specific primers (Table 1). The target gene fragments were amplified using the Thermo Scientific Veriti. For the COI gene, the DNA fragments are amplified using 1 μL of template DNA in a 20 μL total PCR mixture with COI primers (50 pmol) and 35 amplification cycles, following the programme: denaturation at 95℃ for 45 sec, annealing: 47℃ for 40 sec, and chain elongation: 72℃ for 60 sec. For COII gene, the DNA fragments are amplified using 1 μL of template DNA in 20 μL of total PCR mixture using COII primers (50 pmol) and 35 amplification cycles with the following programme: denaturation: 95℃ for 45 sec, annealing: 45℃ for 40 sec, and chain elongation: 72℃ for 60 sec. For the 16S rRNA gene, the DNA fragments are amplified using 1 μL of template DNA in 20 μL of total PCR mixture using 16S rRNA primers (50 pmol) and 35 amplification cycles with the following programme: denaturation: 95℃ for 45 sec, annealing: 46℃ for 30 sec, and chain elongation: 72℃ for 30 sec. For Cytb gene, the DNA fragments are amplified using 1 μL of template DNA in 20 μL of total PCR mixture using Cytb primers (50 pmol) and 35 amplification cycles with the following programme: denaturation: 95° C for 45 sec, annealing: 46° C for 40 sec, and chain elongation: 72° C for 60 sec. In all the genes, the initial preheating for 5 min at 94°C and the final extension for 1 min at 72°C were followed. All the amplified products were examined on 1% agarose gel and purified using GeneJET Gel Extraction Kit (Thermo Scientific).
Primer details employed in the present study

Table 1 Long description
This table provides details on mitochondrial gene primers used in a study, including their sequences, annealing temperatures, and amplicon sizes. Cytochrome Oxidase I and II, 16s rRNA, and Cytochrome B are the genes examined. Cytochrome B has the largest amplicon size of 770 base pairs, with an annealing temperature of 41 degrees Celsius, while Cytochrome Oxidase II has the smallest amplicon size of 369 base pairs at 45 degrees Celsius. The annealing temperatures range from 41 to 53 degrees Celsius, indicating variability in primer binding conditions. The data suggests a focus on optimizing primer conditions for effective amplification of mitochondrial genes.
Sanger sequencing of target gene fragments
The amplified PCR products were sequenced using Sanger’s method in the ABI 3730 automated DNA analyser at SciGenom Labs Pvt Ltd. (Cochin, India). Unincorporated PCR primers and dNTPs were removed from PCR products using the Montage PCR Cleanup Kit (Millipore). The PCR product was re-sequenced using gene-specific primers (Table 1). Sequencing reactions were performed using an ABI PRISM® BigDyeTM Terminator Cycle Sequencing Kit with AmpliTaq® DNA polymerase (FS enzyme; Applied Biosystems). Single-pass sequencing was performed on each template primer. The fluorescent-labelled fragments were purified from the unincorporated terminators with an ethanol precipitation protocol. The samples were resuspended in distilled water and subjected to electrophoresis in an ABI 3730xl sequencer (Applied Biosystems).
Sequence analyses
The sequences were imported into FASTA format for alignment and trimming in ClustalW algorithm by setting default parameters in the MEGA X software application package (Tamura et al., Reference Tamura, Stecher, Peterson, Filipski and Kumar2021). The raw forward and reverse Sanger sequencing reads were quality-checked and trimmed prior to assembly. Contig assembly was performed using the CAP3 programme, wherein overlapping reads were merged to generate high-quality consensus sequences (contigs). These consensus contig sequences were subsequently verified based on homologous sequences using nBLAST in NCBI (https://www.ncbi.nlm.nih.gov/). All high-quality consensus sequences generated in this study were submitted to GenBank, for accession numbers (PZ350974, PZ350975, PZ350976, PZ350977, PZ350978, PZ350979, PZ350980, PZ350981, PZ350982, PZ350983, and PZ350984). The haplotype diversity was determined using the DnaSP 5.10.1 software package (Librado and Rozas, Reference Librado and Rozas2009). Furthermore, to ascertain demographic expansion, neutrality tests like Tajima’s D (Tajima, Reference Tajima1989), Fu’s F (Fu, Reference Fu1997), and mismatch distribution analysis (Rogers and Harpending, Reference Rogers and Harpending1992) were also performed with DnaSP 5.10.1. The average nucleotide base composition and the overall mean genetic distance were also calculated. For understanding the genetic structure, analysis of molecular variance (Excoffier et al., Reference Excoffier, Smouse and Quattro1992) and pairwise Fst values were computed using Arlequin 3.5 (Excoffier and Lischer, Reference Excoffier and Lischer2010). The level of significance was determined with 1,000 permutation replicates. The raw sequence reads were quality-checked prior to alignment, and bases with a Phred quality score below Q20 were trimmed to ensure accuracy of downstream analyses. A total of five individuals per population were analysed for each mitochondrial marker, resulting in a balanced dataset across all 11 populations. Thus, the final dataset comprised 55 sequences per gene (5 individuals × 11 populations) for COI, COII, Cytb, and 16S rRNA, which were used for subsequent phylogenetic, haplotype, and population genetic analyses.
Phylogenetic analysis
Mitochondrial gene sequences of C. partellus representing four loci, viz., Cytb, COI, COII, and 16S rRNA from 11 different populations of India were imported into MEGA 11 (Molecular Evolutionary Genetics Analysis; Tamura et al., Reference Tamura, Stecher, Peterson, Filipski and Kumar2021). Multiple sequence alignments were performed independently for each gene using the MUSCLE (Multiple Sequence Comparison by Log-Expectation) algorithm in MEGA. The aligned sequences were exported into MEGA format (.meg). The poor-quality reads and ambiguous bases were trimmed before final analysis. Phylogenetic reconstruction was performed separately for each mitochondrial gene to assess locus-specific evolutionary signals. Trees were inferred using the Maximum Likelihood (ML) method with the best-fit nucleotide substitution model selected based on the Bayesian Information Criterion. Bootstrap analysis with 2,000 replications was conducted to evaluate node support. The resulting phylogenies were visualised in a circular layout, with branches colour coded by gene marker, such as Cytb (green), COI (black), COII (blue), and 16S rRNA (red). Bootstrap values were represented in proportional node symbols, enabling comparative assessment of phylogenetic robustness across loci.
Haplotype network construction
The previously aligned MEGA files were converted to NEXUS format using DnaSP v6.12.03 (DNA Sequence Polymorphism) software. The NEXUS files were manually edited to ensure PopART (Population Analysis with Reticulate Trees) compatibility by adding geographic trait information (latitude and longitude coordinates), implementing binary trait coding for location data and formatting trait labels according to PopART specifications. Haplotype networks were constructed using PopART version 1.7 (Leigh et al., Reference Leigh, Bryant and Nakagawa2015). The edited NEXUS files for each gene were imported into PopART, and haplotype networks were generated using the Median-Joining algorithm. The networks were visualised with different node colours for each geographic location, with node sizes proportional to haplotype frequency and branch lengths representing the number of mutations between haplotypes.
Results
Mitochondrial marker amplification and sequence alignment
Four mitochondrial loci, such as COI, COII, Cytb, and 16S rRNA, were successfully amplified and sequenced from different geographical populations (Fig. 1) using gene-specific primers (Table 1). The amplified fragment sizes ranged from 369 bp (COII) to 770 bp (Cytb), with consistent amplification across populations, indicating high primer specificity and sequence quality suitable for downstream phylogenetic and haplotype analyses. Multiple sequence alignments of COI, COII, 16S rRNA, and Cytb genes (Fig. S1–S4) confirmed high sequence quality, correct reading frames for protein-coding genes, and accurate identification of substitution and indel sites. No stop codons or frameshift mutations were detected, indicating amplification of functional mitochondrial sequences rather than nuclear mitochondrial pseudogenes.
Phylogenetic structure among C. partellus populations of India
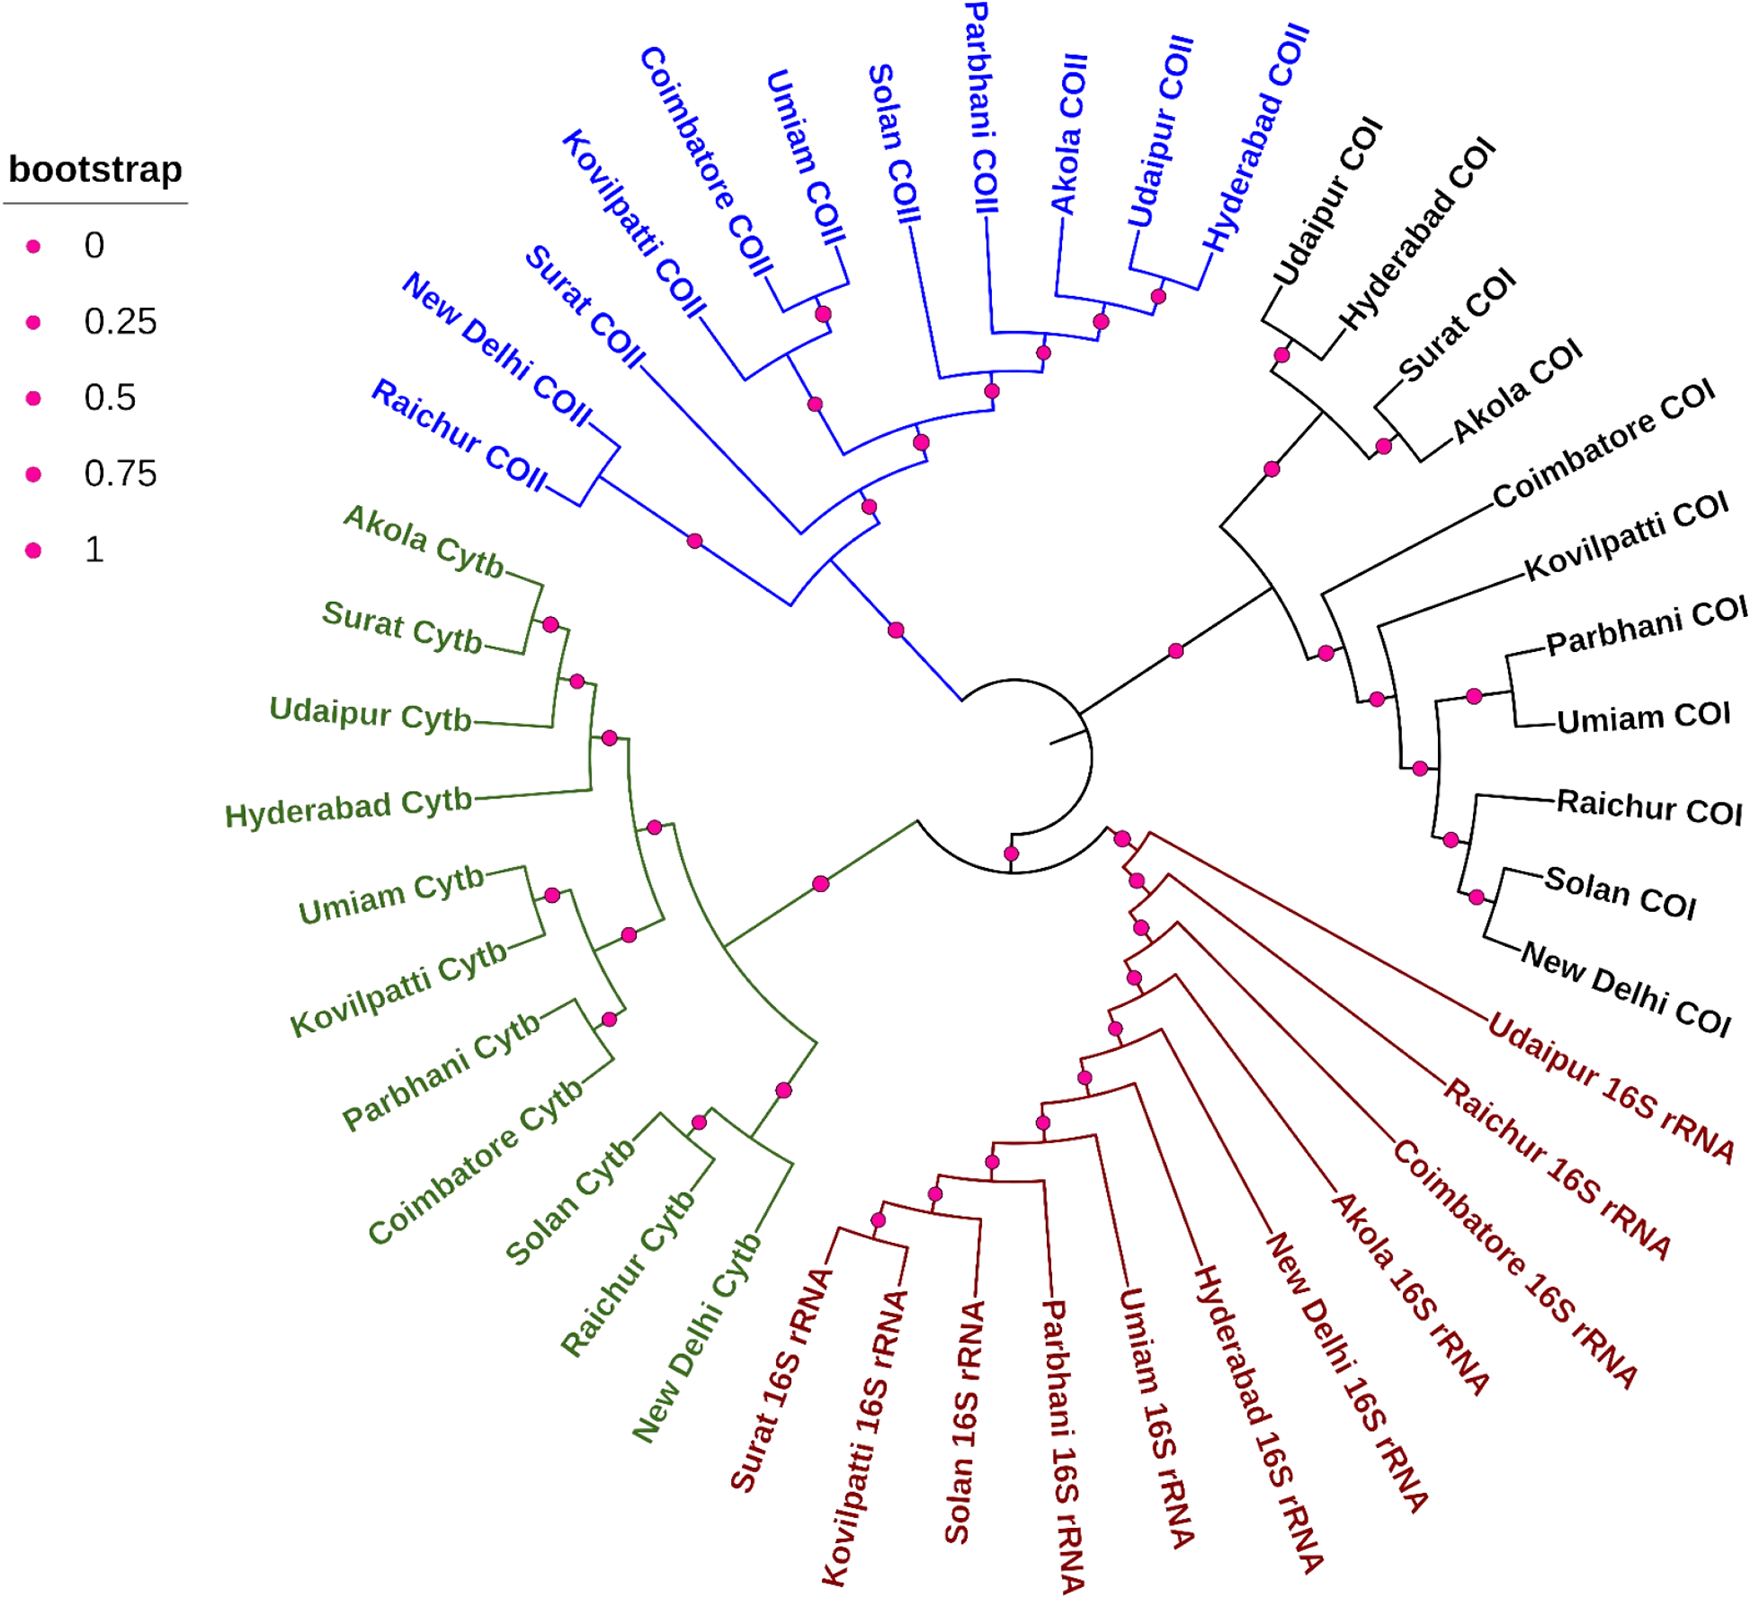
ML phylogenetic analyses based on individual mitochondrial genes revealed moderate genetic structuring among C. partellus populations in India (Fig. 2). Across all four markers, populations did not form strictly location-specific monophyletic clades; instead, partial geographic clustering with shared lineages was evident. The COI and COII phylogenies showed shallow divergence with several populations from geographically distant regions clustering together, suggesting recent common ancestry or ongoing gene flow. Cytb and 16S rRNA trees provided slightly better resolution, with some regional grouping observed; however, bootstrap support indicated only moderate differentiation. Overall, the phylogenetic patterns suggest a single, broadly connected genetic lineage of C. partellus in India, shaped by historical dispersal and contemporary migration.
Phylogenetic relationships among Chilo partellus populations in India inferred from mitochondrial gene sequences. Maximum Likelihood trees were constructed using four mitochondrial markers: cytochrome b (Cytb; green), cytochrome oxidase I (COI; black), cytochrome oxidase II (COII; blue), and 16S rRNA (red). Bootstrap analysis was performed with 1,000 replications, and node support is indicated by proportional circles at each node, where larger circle sizes represent higher bootstrap values (≥70% considered moderate support, ≥90% strong support). Populations from 11 geographic locations (Akola, New Delhi, Hyderabad, Umiam, Parbhani, Solan, Surat, Udaipur, Raichur, Coimbatore, and Kovilpatti) are included. The tree topology indicates moderate genetic structuring with shared lineages and partial geographic clustering across regions.

Figure 2 Long description
The image shows a phylogenetic tree illustrating the relationships among Chilo partellus populations in India. The tree is constructed using four mitochondrial markers: Cytochrome b (Cytb), Cytochrome Oxidase I (COI), Cytochrome Oxidase II (COII) and 16S rRNA. Each marker is represented by a different color: Cytb in green, COI in black, COII in blue and 16S rRNA in red. Populations from various geographic locations such as Akola, New Delhi, Hyderabad, Umiam, Parbhani, Solan, Surat, Udaipur, Raichur, Coimbatore and Kovilpatti are included. Bootstrap values are indicated by proportional circle sizes at each node, with larger circles representing higher bootstrap values. The tree topology suggests moderate genetic structuring with shared lineages and partial geographic clustering across regions.
The COI-based phylogeny (black clade) showed minimal genetic divergence among C. partellus populations, with most locations clustering tightly within a single lineage, indicating strong genetic cohesion and recent common ancestry across India. Most populations, including those from Akola, New Delhi, Hyderabad, Parbhani, Solan, Surat, Udaipur, Raichur, Coimbatore, Kovilpatti, and Umiam, grouped closely within a single major clade, supported by moderate to high bootstrap values at internal nodes. This pattern suggests a shared mitochondrial ancestry and highlights the effectiveness of COI as a species-level diagnostic marker rather than a highly resolving population-level marker.
The COII-based phylogeny (blue clade) exhibited slightly higher resolution among populations, with clearer separation of some regional groups. Populations from Raichur, Surat, and New Delhi formed a well-supported cluster, while southern populations (Coimbatore and Kovilpatti) appeared as closely related sister taxa. The Umiam population showed relative divergence, suggesting possible restricted gene flow or geographic isolation in the northeastern region. Bootstrap values were comparatively higher than Cytb for several nodes, highlighting COII as a robust marker for intraspecific phylogeography. These results suggest that COII captures regional structuring more effectively, possibly due to a higher substitution rate relative to Cytb.
The 16S rRNA tree (red clade) displayed greater internal divergence and deeper branching patterns compared to protein-coding genes. Distinct lineages were observed for Udaipur, Raichur, and Coimbatore, indicating accumulation of mutations over longer evolutionary timescales. Northern (New Delhi and Solan) and central populations (Akola and Parbhani) clustered together, while southern populations showed greater separation. Higher bootstrap support at deeper nodes reflects the conserved yet informative nature of 16S rRNA, making it suitable for detecting historical population differentiation. The 16S rRNA results indicate that while recent gene flow occurs, older population structuring events have also shaped current genetic patterns.
The Cytb (green clade) showed moderate genetic structuring, with populations from Akola, Hyderabad, New Delhi, Udaipur, Surat, Raichur, Parbhani, Solan, Umiam, Coimbatore, and Kovilpatti forming closely related but distinguishable subclades. The populations (Akola, Hyderabad, and Udaipur) clustered tightly, indicating shared haplotypes or recent common ancestry. Southern populations (Coimbatore and Kovilpatti) did not form a deeply divergent lineage, suggesting recent dispersal or demographic expansion rather than long-term isolation. Bootstrap support values were moderate, consistent with recent evolutionary divergence and limited accumulation of mutations in Cytb. It thus appears informative for detecting shallow population-level differentiation in C. partellus.
Haplotype network analysis
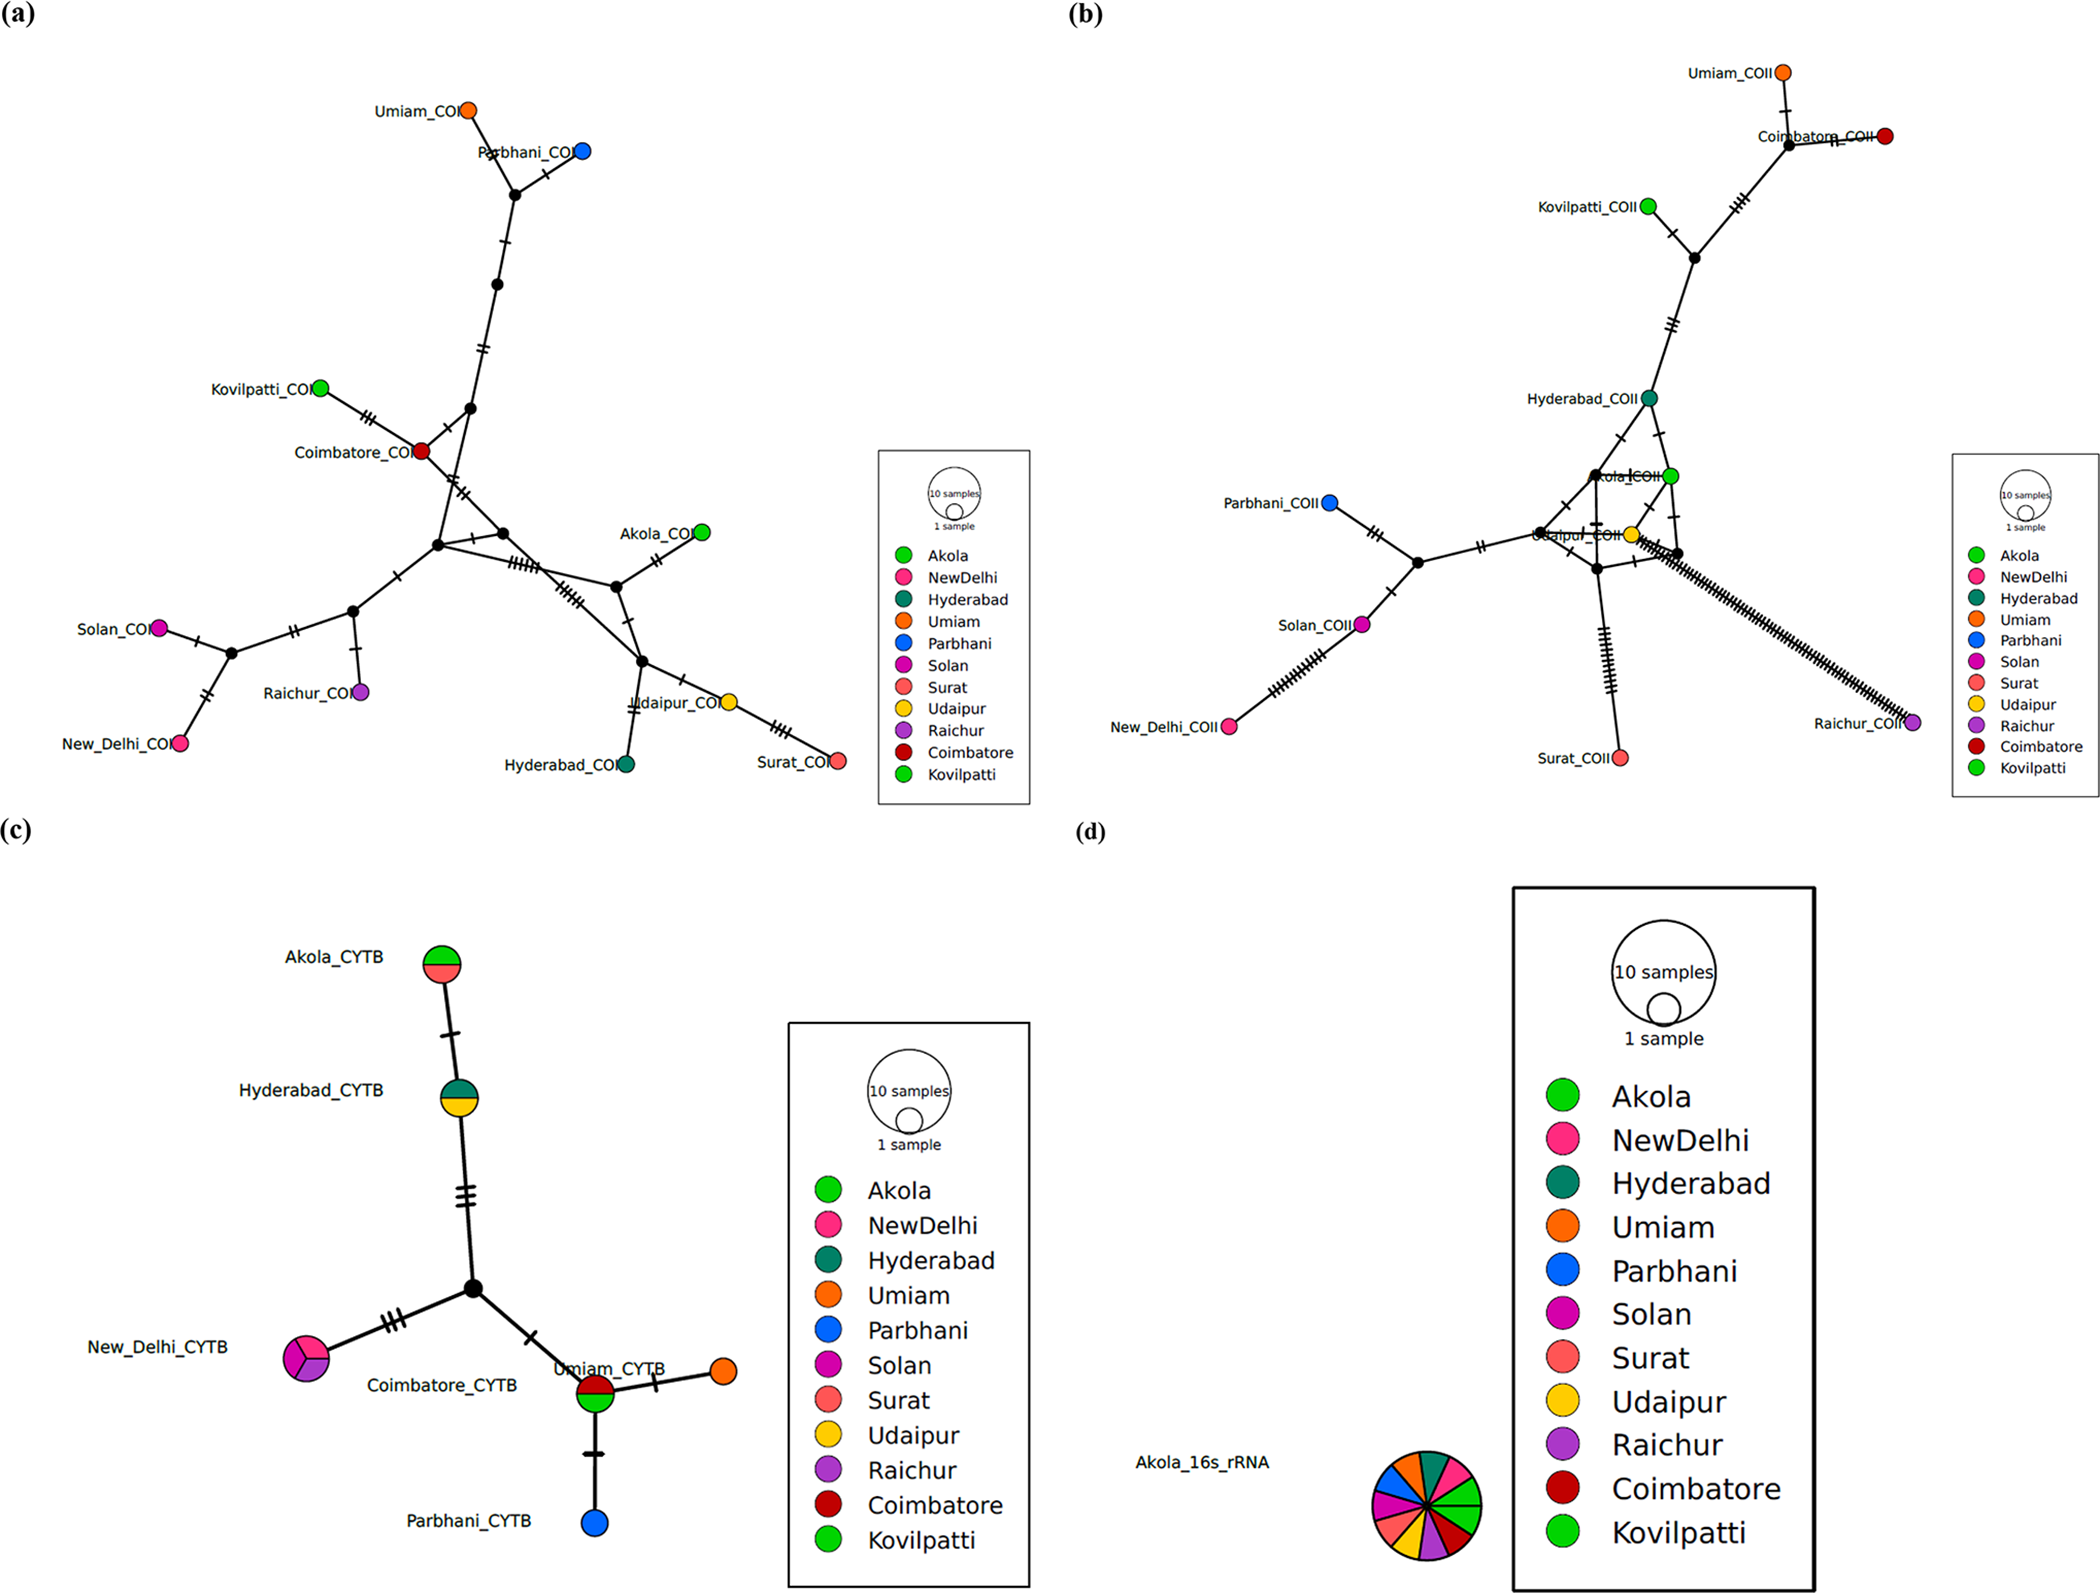
Haplotype networks constructed for each mitochondrial gene further supported the phylogenetic results (Fig. 3a–d). The COI haplotype network (Fig. 3a) was characterised by a dominant central haplotype shared across multiple populations, with several low-frequency derived haplotypes radiating from it. This starlike topology indicates recent population expansion and limited regional isolation. Similarly, COII haplotypes (Fig. 3b) displayed shallow mutational steps among haplotypes, with extensive sharing across geographic regions, reinforcing evidence for high gene flow. The Cytb network (Fig. 3c) showed relatively higher haplotype diversity, including population-specific haplotypes separated by multiple mutational steps, suggesting localised diversification in some regions. The 16S rRNA network (Fig. 3d) exhibited fewer haplotypes with short mutational distances, consistent with the conserved nature of this marker. Collectively, haplotype networks across all loci indicate low-to-moderate mitochondrial diversity, absence of deep phylogeographic breaks, and widespread haplotype sharing among Indian populations.
Haplotype networks of Chilo partellus populations based on mitochondrial gene sequences: (a) COI, (b) COII, (c) Cytb, and (d) 16S rRNA. Each circle represents a unique haplotype, with circle size proportional to haplotype frequency. Colours within circles correspond to different geographic populations. Lines connecting haplotypes represent single mutational steps, and small black nodes (if present) indicate hypothetical intermediate haplotypes not observed in the dataset. Starlike network patterns indicate recent population expansion and high gene flow, while the presence of multiple low-frequency haplotypes reflects ongoing mutation and diversification.

Figure 3 Long description
The image shows four haplotype networks of Chilo partellus populations based on mitochondrial gene sequences. Image A displays the COI haplotype network with circles representing unique haplotypes, sized by frequency and lines indicating single mutational steps. Image B shows the COII haplotype network with similar features. Image C illustrates the Cytb haplotype network and Image D presents the 16S rRNA haplotype network. Each network includes a legend with colors corresponding to different geographic populations, such as Akola, New Delhi, Hyderabad and others. Small black nodes indicate hypothetical intermediate haplotypes not observed in the dataset. The networks depict star-like patterns indicating recent population expansion and high gene flow, with multiple low-frequency haplotypes reflecting ongoing mutation and diversification.
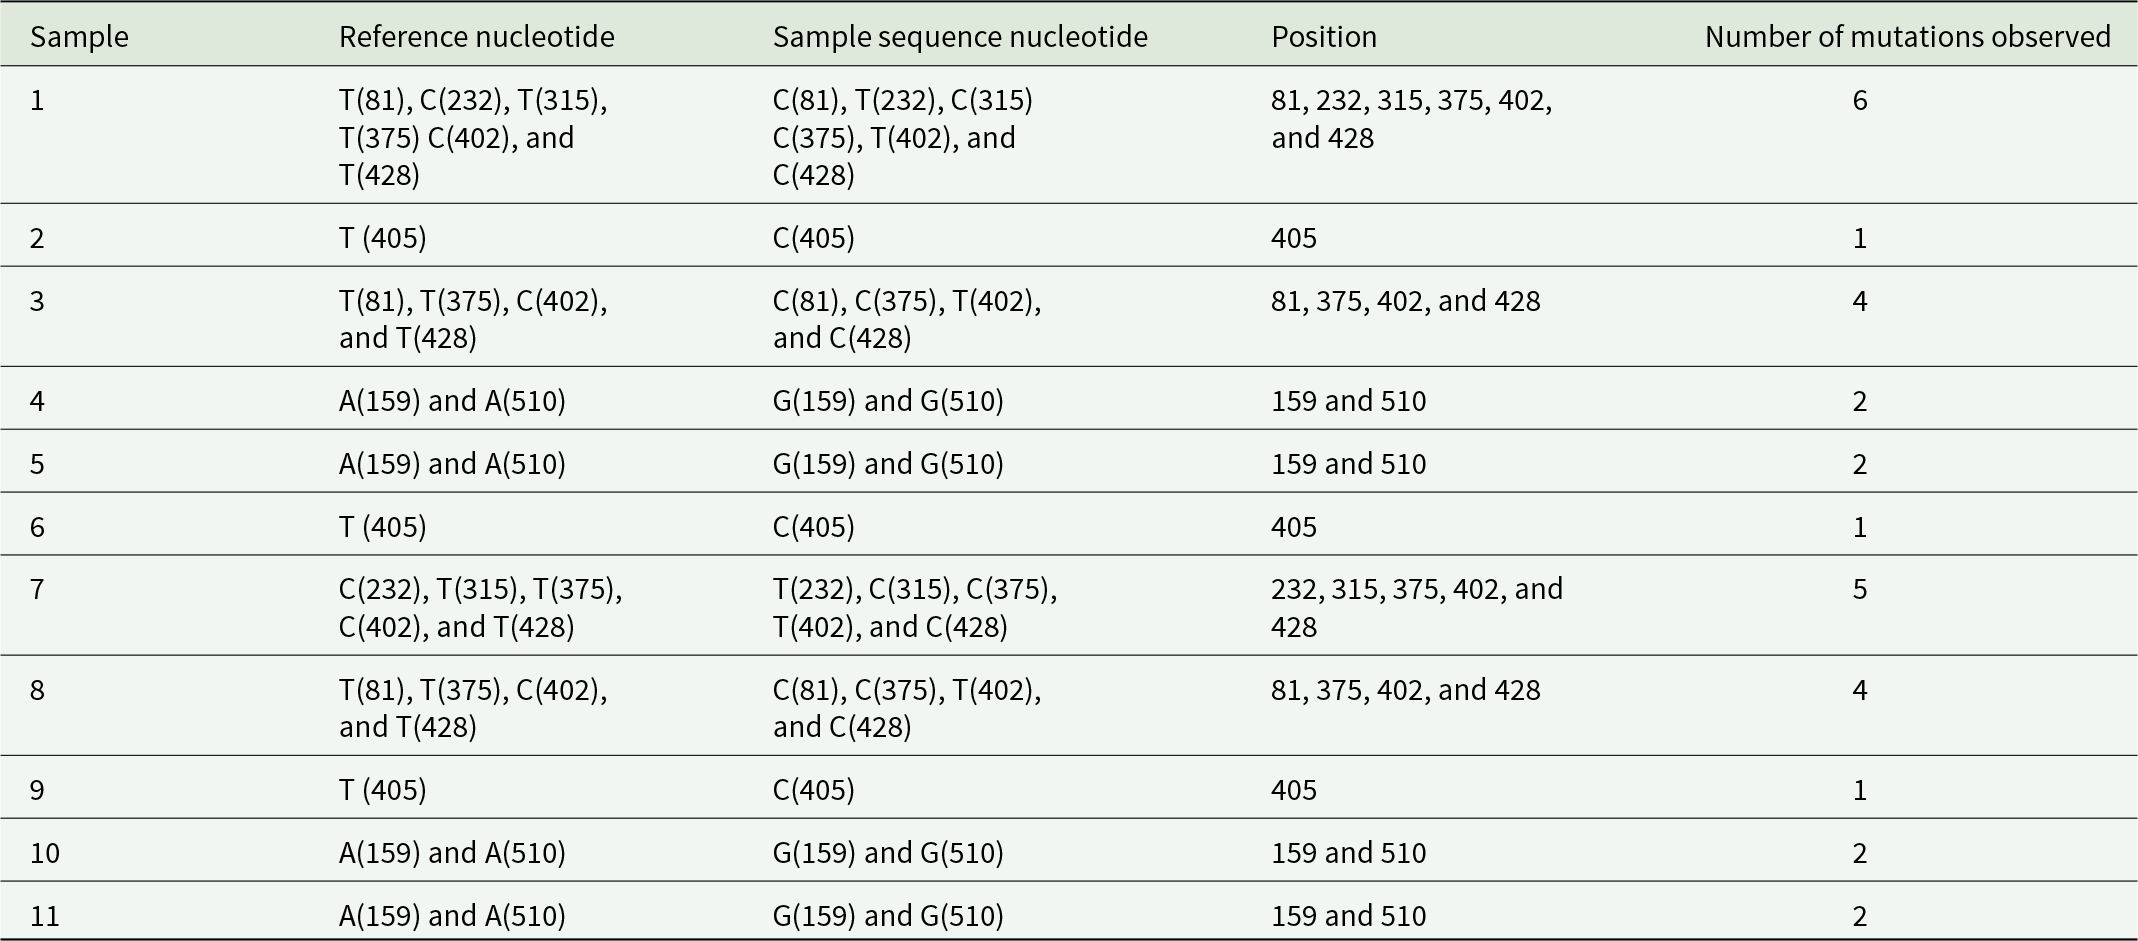
Nucleotide polymorphism in COI
Detailed nucleotide analysis of the COI gene revealed variable levels of point mutations across samples (Table 2). The number of mutations per sample ranged from one to six, with Sample 1 exhibiting the highest number of substitutions, while Samples 2, 6, and 9 showed the lowest mutation frequency. Several nucleotide positions (81, 159, 232, 315, 375, 402, 405, 428, and 510) were identified as polymorphic hotspots, exhibiting repeated substitutions across multiple samples. The observed substitutions were predominantly transitioning, consistent with the mutation patterns of mtDNA. These polymorphisms contributed to haplotype differentiation but did not result in strong population-specific signatures.
Nucleotide analysis for mutation checking in cytochrome oxidase subunit I

Table 2 Long description
The table analyzes nucleotide mutations in Cytochrome Oxidase subunit 1 across different samples. Sample 1 exhibits the highest mutation count with 6 changes, while samples 2, 6, and 9 show only 1 mutation each. Positions 81, 375, 402, and 428 are frequently mutated across multiple samples, suggesting these sites may be prone to changes. Samples 4, 5, 10, and 11 consistently show mutations at positions 159 and 510, indicating a pattern of alteration at these locations. The data highlights variability in mutation frequency and positions, which could be significant for understanding genetic stability and mutation impact in this subunit.
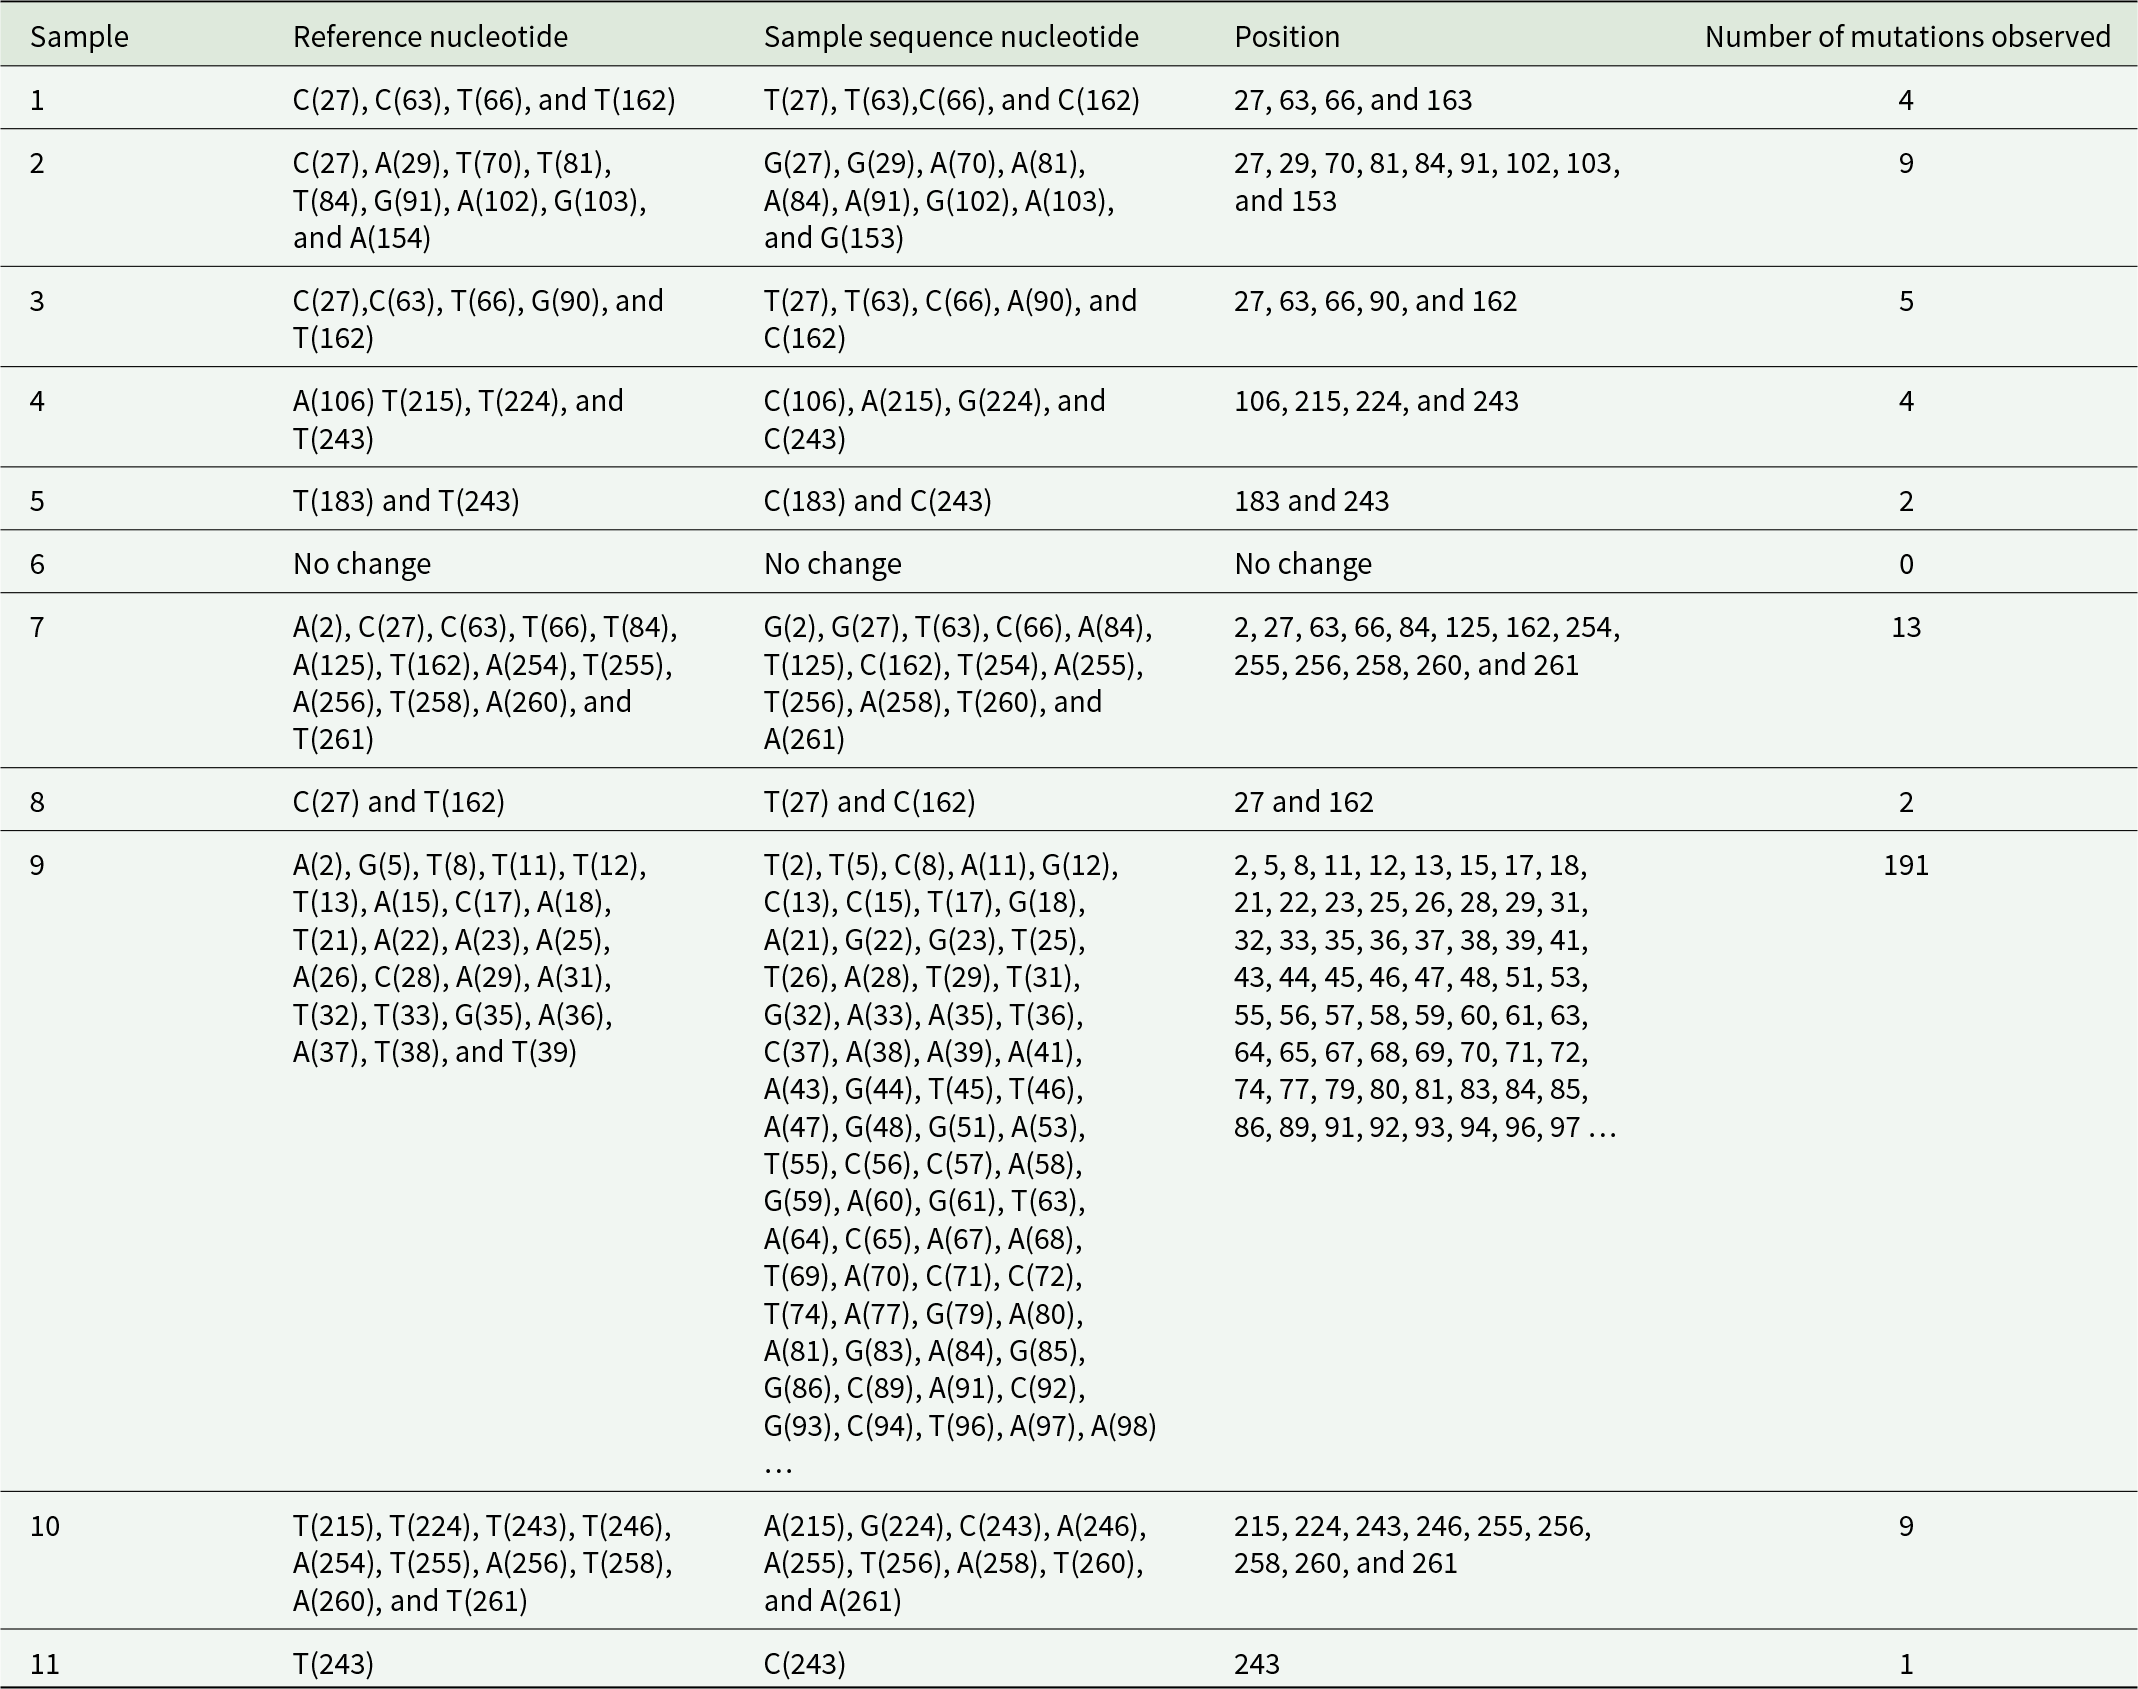
Nucleotide polymorphism in COII
COII gene analysis revealed greater variability compared to COI (Table 3). The number of mutations ranged from 0 to a maximum of 191 substitutions in Sample 9, indicating substantial divergence in this sample. In contrast, Sample 6 showed complete sequence conservation with no detectable mutations. Several positions, including 27, 63, 66, 84, 162, 215, 224, and 243, were frequently polymorphic across samples. The high mutation load observed in Sample 9 suggests either localised diversification or possible sequencing of a highly divergent haplotype. Overall, COII exhibited higher nucleotide diversity, making it informative for resolving fine-scale population variation.
Nucleotide analysis for mutation checking in cytochrome oxidase subunit II

Table 3 Long description
The table analyzes nucleotide mutations in Cytochrome Oxidase subunit 1I across different samples. Sample 9 exhibits the most mutations with 191 changes, indicating significant genetic variation. In contrast, Sample 6 shows no mutations, suggesting stability in its sequence. Other samples display varying mutation counts, with Sample 7 having 13 mutations and Sample 11 having just 1. The data highlights specific nucleotide positions where mutations occur, such as positions 27, 63, and 243, which are common across multiple samples. This variability in mutation frequency and location can provide insights into genetic stability and potential areas of interest for further research.
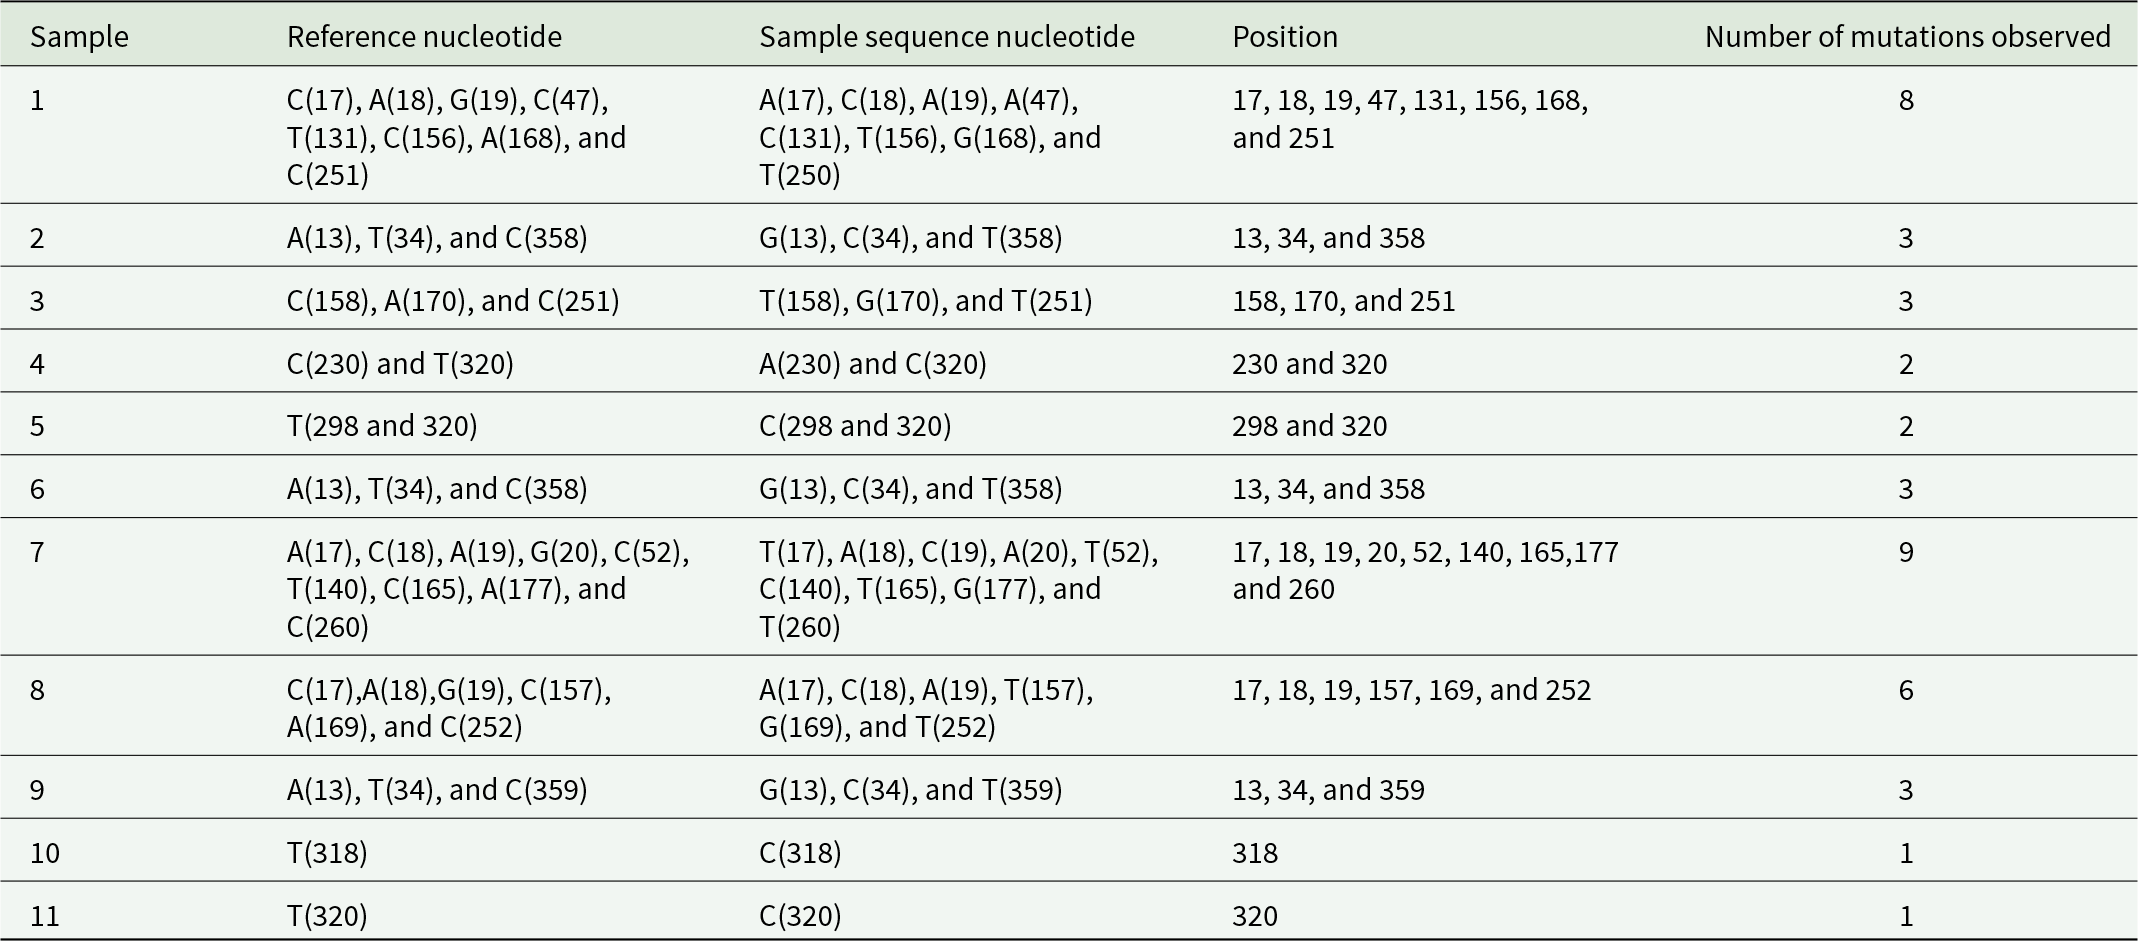
Nucleotide polymorphism in Cytb
Cytb exhibited the highest overall nucleotide variability among the four mitochondrial markers (Table 4). The number of mutations per sample ranged from one to nine, with Sample 7 showing the highest mutation frequency, while Samples 10 and 11 exhibited minimal variation. Polymorphic sites were distributed throughout the gene, with recurrent mutations at positions 13, 17–20, 34, 52, 140, 165, 177, 251, and 320. The relatively higher variability and longer sequence length of Cytb provided enhanced resolution in phylogenetic and haplotype analyses, supporting its utility for population genetic studies of C. partellus.
Nucleotide analysis for mutation checking in cytochrome b (Cytb)

Table 4 Long description
The table analyzes nucleotide mutations in Cytochrome b sequences across 11 samples, comparing reference and sample sequence nucleotides at specific positions. Sample 7 exhibits the highest mutation count with 9 mutations, while samples 10 and 11 show the least with only 1 mutation each. Most samples have mutations at multiple positions, with common positions being 17, 18, and 19. The data highlights variability in mutation frequency and positions, indicating diverse mutation patterns across samples. This variability suggests potential differences in genetic stability or environmental influences affecting the Cytochrome b gene.
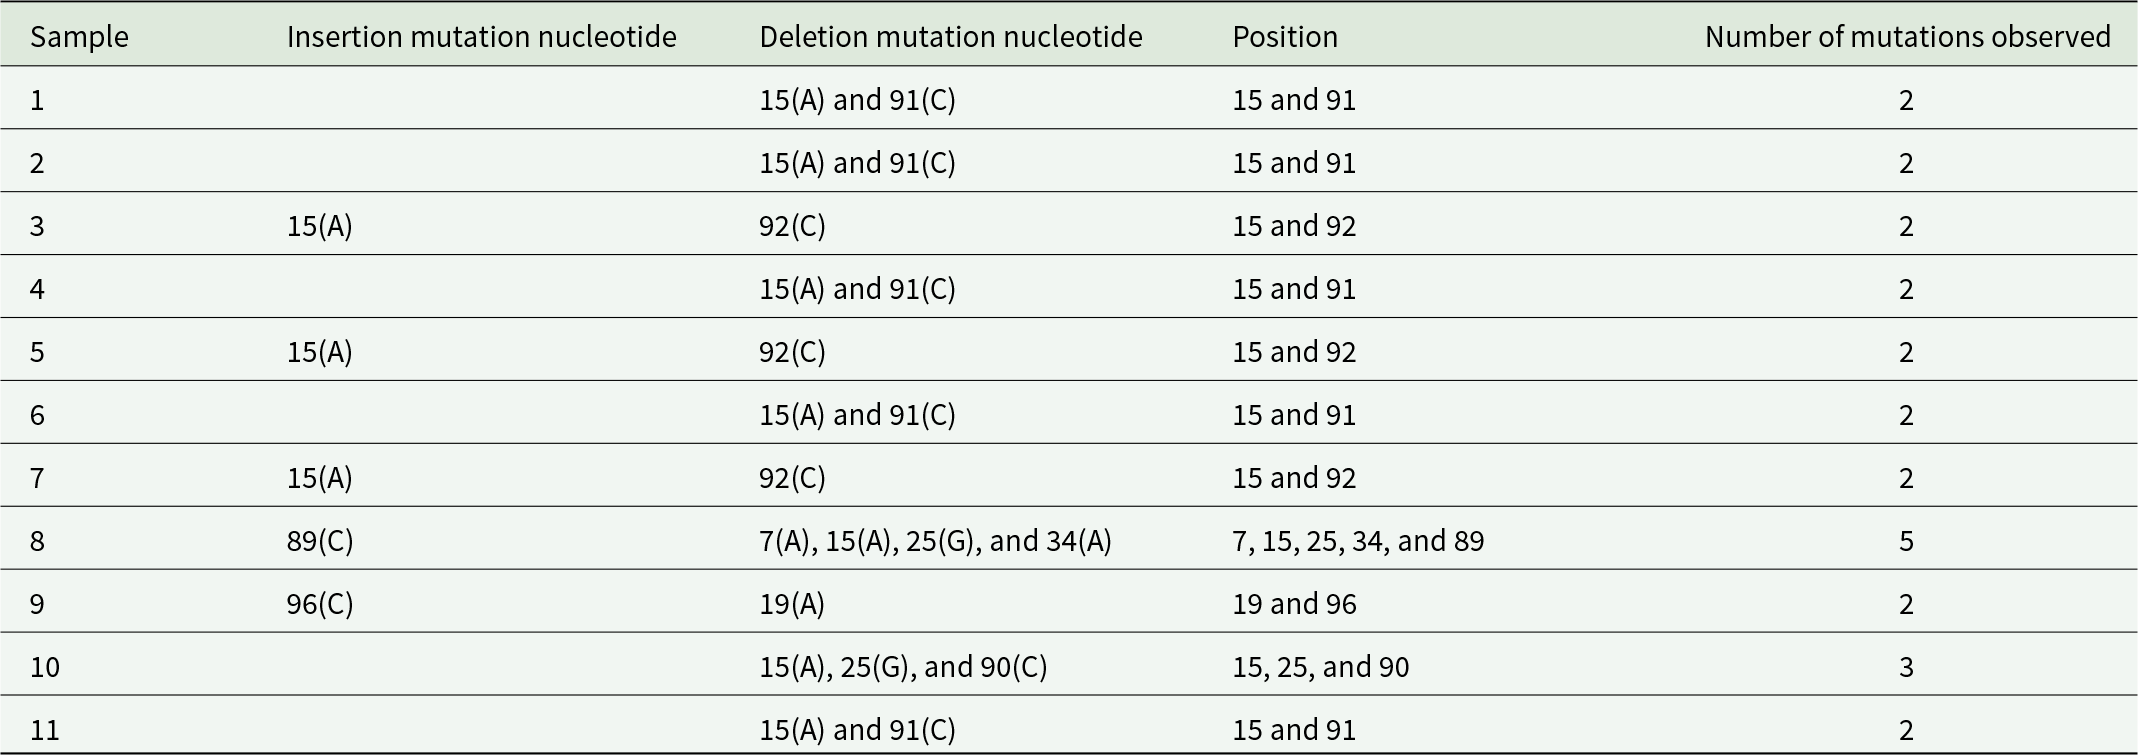
Insertion and deletion polymorphism in 16S rRNA
Unlike protein-coding genes, the 16S rRNA gene displayed both insertion and deletion mutations across populations (Table 5). Most samples showed deletions at positions 15 and 91, while others exhibited insertions at positions 89, 92, and 96. Sample 8 exhibited the highest number of indel mutations, including multiple deletions and a single insertion, whereas most other samples showed only two to three indel events. Despite these variations, the overall mutation frequency in 16S rRNA was low, reflecting its conserved functional role. These indel patterns contributed modestly to haplotype differentiation.
Nucleotide analysis for mutation checking in 16S rRNA

Table 5 Long description
The table analyzes nucleotide mutations in 16S rRNA across 11 samples, focusing on insertion and deletion mutations. Most samples exhibit two mutations, typically deletions at positions 15 and 91. Sample 8 stands out with five mutations, including an insertion at position 89 and deletions at positions 7, 15, 25, and 34. Samples 3, 5, and 7 show a pattern of insertion at position 15 and deletion at position 92. The data suggests a recurring mutation pattern at specific nucleotide positions, with variations in the number and type of mutations across samples.
Discussion
The present study employed multilocus mtDNA markers (COI, COII, Cytb, and 16S rRNA), which revealed low-to-moderate genetic differentiation and extensive haplotype sharing among C. partellus populations across India, indicating a largely genetically homogeneous population with weak phylogeographic structure. Similar patterns of shallow population divergence and low FST have been documented in other widely dispersed lepidopteran pest, Spodoptera litura, which exhibits high gene flow due to dispersal and continuous host availability (Hu et al., Reference Hu, Yang, Zhang, Zhang, Yu and Yang2023). Mitochondrial markers were selected based on their differential mutation rates and resolution power for population genetic analyses. Protein-coding genes such as COI and COII generally exhibit moderate to high substitution rates, making them suitable for detecting recent evolutionary divergence and intraspecific variation, with COII often providing slightly higher resolution than COI. The Cytb gene typically shows relatively higher nucleotide variability among mitochondrial loci, enhancing its ability to resolve fine-scale population structure. In contrast, the 16S rRNA gene is more conserved, with lower mutation rates, and is therefore useful for capturing deeper evolutionary relationships and ensuring phylogenetic stability. The combined use of these markers provides a comprehensive framework to assess both recent and historical population dynamics in C. partellus.
In the present study, the phylogenetic reconstructions failed to resolve region-specific lineages; clusters comprised populations from northern, southern, central, western, and northeastern India. Such panmictic structure is common in insect pests capable of long-distance movement and continuous host exploitation, where geographic barriers have minimal effects on genetic partitioning (Wang et al., Reference Wang, Li, Hoffmann, Cao, Gong, Song, Zhu and Wei2017). The absence of strong geographic isolation suggests frequent dispersal among Indian C. partellus populations, likely facilitated by contiguous cropping systems and human-mediated transport of plant material, paralleling findings in other pest systems where weak mitochondrial structure is linked to extensive gene flow and rapid demographic expansion (Liu et al., Reference Liu, He, Du, Zhang, Cai and Li2023).
Moderate locus-specific variability observed among the four markers reflects differences in evolutionary rates and resolution power of Cytb and COII, which generally exhibited higher nucleotide variability compared with COI and 16S rRNA. This trend mirrors findings in other insects where Cytb often provides greater resolution for population differentiation than COI alone (Chen et al., Reference Chen, Huang, Dai, Guo, Sun and Hong2019). COI remains valuable for species identification, but its limited intraspecific variability can reduce fine-scale discrimination power, and conserved regions such as 16S rRNA contribute fewer polymorphisms, though useful for cross-marker phylogenetic consistency (Chen et al., Reference Chen, Huang, Dai, Guo, Sun and Hong2019).
The starlike haplotype network topology, with a dominant central haplotype and several low-frequency derivatives, is characteristic of recent population expansion following a bottleneck or founder event. Similar network patterns have been reported for other insect pests experiencing rapid demographic growth and broad dispersal histories (Dash et al., Reference Dash, Golive, Parameswaran, Rath, Chatterjee, Mukherjee, Tripathy, Nayak, Mohapatra, Behera and Mohapatra2025). The presence of shared haplotypes across distant regions strongly suggests recent common ancestry and ongoing gene flow, whereas limited private haplotypes likely arise from localised microevolutionary changes rather than deep isolation.
Although C. partellus is believed to have originated in Asia and subsequently spread to Africa and other regions (Yonow et al., Reference Yonow, Kriticos, Ota, Van Den Berg and Hutchison2017), the lack of deeply divergent mitochondrial lineages within India argues against multiple independent introductions. Instead, these data support a scenario of one or a few ancestral introductions with subsequent rapid dispersal and genetic mixing across agro-ecological zones. This inference aligns with the invasive biology of other cosmopolitan pests, where strong gene flow erases historical phylogeographic signals shortly after expansion (Liu et al., Reference Liu, He, Du, Zhang, Cai and Li2023).
Anthropogenic factors such as the movement of infested produce, farm machinery, and seed stock likely further erode regional differentiation, enhancing gene flow and homogenising populations over large scales. The expansion of maize and sorghum cultivation into non-traditional areas may create ecological corridors facilitating rapid colonisation. These processes are consistent with observed weak genetic structure in other insect pests where human activity and ecological continuity enable dispersal beyond natural flight ranges (Liu et al., Reference Liu, He, Du, Zhang, Cai and Li2023). The high genetic connectivity among C. partellus populations implies that adaptive alleles (e.g. for insecticide resistance or host utilisation) may spread rapidly across regions, diminishing the effectiveness of localised management efforts. Consequently, area-wide integrated pest management strategies are preferable to region-specific approaches for sustainable control of this pest. Finally, while mitochondrial markers provide valuable insights into maternal lineages and historical demography, integration of nuclear markers such as microsatellites, Single Nucleotide Polymorphisms (SNPs), or genome-wide data will be critical for resolving contemporary gene flow and adaptive evolution, as demonstrated in other Lepidoptera population genomic studies (Anderson et al., Reference Anderson, Tay, McGaughran, Gordon and Walsh2016).
Overall, the present study reveals low-to-moderate mitochondrial genetic diversity and weak phylogeographic structuring among C. partellus populations across India, characterised by extensive haplotype sharing and shallow phylogenetic divergence. These patterns collectively indicate high gene flow and recent common ancestry, likely driven by the species’ dispersal ability, continuous host availability, and anthropogenic movement. The absence of strong geographic clustering suggests that regional barriers have limited influence on genetic differentiation, resulting in a largely panmictic population structure. Such genetic connectivity has important implications for pest management, as it may facilitate the rapid spread of adaptive traits such as insecticide resistance across regions. Therefore, area-wide management strategies are likely to be more effective than localised interventions. Additionally, while mitochondrial markers provided valuable insights into population history and maternal lineages, future studies incorporating nuclear genomic markers will further refine our understanding of fine-scale population dynamics and adaptive evolution. This study is based on mitochondrial markers, which reflect only maternal inheritance and may not fully capture genome-wide variation. Future studies incorporating nuclear markers such as SNPs and microsatellites will help to better resolve fine-scale population structure and gene flow. Further work incorporating global reference populations will be essential to reconstruct broader invasion routes and to predict pest dynamics under changing agroclimatic conditions.
Conclusion
The multilocus phylogenetic analysis demonstrates that C. partellus populations across India exhibit moderate genetic structure shaped by both recent dispersal and historical divergence. The complementary resolution provided by Cytb, COI, COII, and 16S rRNA underscores the importance of using multiple mitochondrial markers for accurate population genetic inference in migratory agricultural pests. Integration of phylogenetic trees, haplotype networks, and nucleotide polymorphism analyses across four mitochondrial loci consistently revealed low to moderate genetic differentiation among Indian populations of C. partellus. The widespread sharing of haplotypes, shallow phylogenetic divergence, and absence of strong geographic structuring suggest a common genetic origin with extensive gene flow, likely facilitated by host plant continuity, migratory behaviour, and anthropogenic movement across regions. While the present study provides important insights into the genetic structure and population dynamics of C. partellus using mitochondrial markers, future research should incorporate high-resolution nuclear markers such as SNPs and microsatellites, as well as genome-wide approaches. These complementary datasets will enable finer resolution of population structure, more accurate inference of contemporary gene flow, and identification of adaptive variation, thereby strengthening the development of effective and region-specific pest management strategies.
Supplementary material
The supplementary material for this article can be found at https://doi.org/10.1017/S0007485326101114.
Acknowledgements
Authors are thankful to the National Agricultural Science Fund (NASF), Indian Council of Agricultural Research (ICAR), New Delhi, India (NASF/ABP-5017/2016-17) for providing financial assistance. We also extend our gratitude to the ICAR – Indian Agricultural Research Institute (IARI), New Delhi, for the research facilities, resources, and guidance that enabled the successful completion of this work.
Author contributions
M.K.D.: Conceptualization, funding, methodology, supervision, and writing – review and editing. A.K.T. and J.J.: Methodology and investigation. K.A.: Data curation, data analysis, and writing – original draft. S.R.P. and S.P.G.: Data curation and formal analysis. All the authors approved the submitted version of the manuscript.
Financial support
This work was funded under the ICAR-NASF (NASF/ABP-5017/2016-17), New Delhi, India.
Competing interests
The authors have no relevant financial or non-financial interests to disclose.
Ethics approval and consent to participate
Not applicable.