

Introduction
The Centers for Disease Control and Prevention (CDC) released the Core Elements for Antibiotic Stewardship in Hospitals In 2014. This guide has been crucial in developing antimicrobial stewardship programs and optimizing antimicrobial use. In 2019, the CDC updated the Core Elements, emphasizing several interventions, including the importance of reporting antimicrobial use data to the National Healthcare Safety Network (NHSN). In 2022, the Core Elements were amended to include Priorities for Hospital Core Element Implementation. This amendment specified NHSN Antimicrobial Use (AU) Option reporting as a tracking priority 1 .
Tracking and reporting antimicrobial use to the NHSN Antimicrobial Use and Resistance (AUR) Module can provide valuable data for public health and antimicrobial stewardship at the state level. Additionally, the AU Option within the AUR Module enables facilities to benchmark antimicrobial usage and make meaningful comparisons, allowing them to identify areas for improvement and implement targeted interventions to optimize antimicrobial prescribing. The data obtained from NHSN supports public health surveillance and are shared with facilities to implement targeted patient interventions.
The Standardized Antimicrobial Administration Ratio (SAAR), an aggregate AU metric developed by NHSN, provides risk-adjusted comparisons of antimicrobial use between facilities Reference van Santen, Edwards and Webb2 . The SAAR is a ratio depicting observed to predicted antimicrobial use where a value of “1” represents observed use equal to predicted use Reference O’Leary, Edwards and Srinivasan3,4 . Predicted antimicrobial use is calculated using predictive models developed by the CDC and was applied to nationally aggregated 2017 adult and pediatric or 2018 neonatal AU data reported to NHSN from the same group of patient care location types. A SAAR of less than “1” indicates that observed antimicrobial use is less than predicted antimicrobial use, whereas a SAAR greater than “1” indicates observed use was greater than predicted use. SAAR ratios are available to facilities, health systems, and health departments through NHSN. The SAAR ratio utilizes days of therapy (DOT) as the primary metric to determine antimicrobial use reported by a facility for a specified category of antimicrobial agents. A total of 47 possible SAAR ratios are generated for 22 antimicrobial agent categories (7 adult, 8 pediatric, and 7 neonatal) and 17 specific NHSN location types (8 adult, 5 pediatric, and 4 neonatal) Reference O’Leary, Edwards and Srinivasan3,4 . As the number of facilities reporting nationally increases, the SAAR data quality for national benchmarking improves Reference O’Leary, Edwards and Srinivasan3 .
A 2011 hospital point prevalence study of healthcare-associated infections and antimicrobial use in 10 states, including Tennessee, revealed that half of patients admitted to a medical facility were prescribed at least one antimicrobial drug Reference Magill, Edwards and Beldavs5 . Researchers conducted a follow-up study in 2015 and surveyed the same facilities, finding no differences in AU prevalence in the adult population compared to 2011 Reference Magill, O’Leary and Ray6 . To further track antimicrobial use, Tennessee implemented various measures, including requiring submission to the AU Option using a phased-based approach in 2018 based on facility size 7 . Beginning in 2022, large facilities were required to report to NHSN, followed by medium and small facilities in 2023 and 2024, respectively. Additionally, in August 2023, the Centers for Medicare and Medicaid Services (CMS) added NHSN reporting to the AUR Module as a requirement for participating facilities in the Medicare Promoting Interoperability Program for calendar year 2024 8 .
The current study is the first in Tennessee to describe SAAR trends utilizing the NHSN AU option and aims to describe antimicrobial use in Tennessee from 2017 through 2023.
Methods
Tennessee has access to hospital AU Option data through an NHSN User Group. From 2017 to 2023, acute care and critical access facilities uploaded data monthly to NHSN.
AU rates were defined by antimicrobial days of therapy (DOT) per 1000 days present (DP) (DOT/1000 DP), where an antimicrobial day represents the administration of any amount of a specific antimicrobial in a calendar day. Antimicrobial days were then aggregated by antimicrobial agent for each facility and unit location. Reference Magill, O’Leary and Ray6 . The statewide SAAR was computed as the ratio of the total aggregated DOT to the predicted total antimicrobial use. AU rates and SAAR data were further aggregated based on geographic regions and facility bed sizes, enabling meaningful comparisons and identification of potential variations.
Acute care facility sizes used in this study are categorized as small (<100 beds), medium (100–250 licensed beds), and large (>250 beds licensed beds) hospital groups. Critical access hospitals are included in the small hospital category. Based on the NHSN location unit mapping, unit locations are divided into four separate units: adult critical care units (ICU), medical/surgical units (WARD), step-down (STEP), and hematology-oncology units (ONC). All adult ICU units, including cardiac, surgical, medical, etc., are included in the ICU category. All units meeting the criteria for each of the four categories are pooled in their respective categories. Antimicrobial agents included in each SAAR category analyzed in this study are previously described by the CDC in the NHSN protocol 4 .
Descriptive statistics and ANOVA tests were computed using SAS Version 9.4 for analysis and data summarization. Tableau was used for data visualization. The data for this report were collected on February 15, 2024.
Results
Data from January 2017 to December 2023 showed that 97 different healthcare facilities in Tennessee had submitted at least one month of data into the NHSN AU Option. Only facilities reporting facilitywide inpatient (FACWIDEIN) AU data were included in this study.
The number of reporting facilities reporting to the NHSN AUR Module increased between 2017 and 2023 from 25 to 95, respectively (Table 1). In 2023, the number of facilities reporting by bed size was 42 small/critical access hospitals, 30 medium-sized hospitals, and 23 large hospitals. During this same period, the statewide average rate of antimicrobial use increased from 593 DOT/1000 DP to 621 DOT/1000 DP (P = .0478). Table 1 provides detailed information on each category’s AU rate, SAAR values and the total number of facilities reporting FACWIDEIN data per year.
Overall AU rate and SAAR values, 2017 – 2023

Abbreviations: AU = antimicrobial use; DOT = days of therapy; DP = days present; BSHO = broad-spectrum antibacterial agents predominantly used for hospital-onset infections; BSCA = broad-spectrum antibacterial agents predominantly used for community-acquired infections; GramPos = antibacterial agents predominantly used for resistant Gram-positive infections; antibacterial agents posing the highest risk for Clostridioides difficile infection; Antifungal = antifungal agents predominantly used for invasive candidiasis; NSBL = narrow-spectrum beta-lactam agents.
The All-Antibacterial SAAR values remained near 1.0, indicating that observed antimicrobial use was relatively equal to predicted antimicrobial use (Table 1). Between 2019 and 2020, SAAR values for all categories except broad-spectrum antibacterial agents predominantly used for community-acquired infections (BSCA) decreased while the overall AU rate increased. The broad-spectrum antibacterial agents predominantly used for hospital-onset infections (BSHO) SAAR significantly declined from 1.14 to 1.07 (P = .01) from 2019 to 2020. No other significant changes were observed between consecutive years for BSCA or BSHO agents. The greatest change in the SAAR values was observed for antibacterial agents predominantly used for resistant Gram-positive infections (GramPos) (1.12 in 2017 to 1.0 in 2020; P = .01). For antibacterial agents posing the highest risk for Clostridioides difficile infection (CDI), observed use was consistently higher than predicted from 2017 to 2023. Antifungal agents predominantly used for invasive candidiasis (Antifungal) and narrow-spectrum beta-lactam agents (NSBL) use was consistently lower than predicted for 2017 to 2023. However, a significant increase (.79 to .88; P = .02) in the predicted use of antifungal agents for invasive candidiasis was observed between 2020 and 2021.
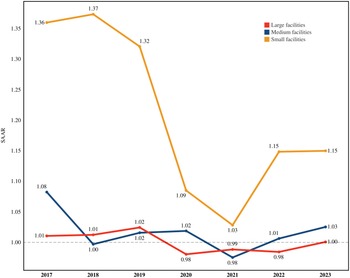
SAAR trends for the All-Antibacterial agent category based on facility bed size (Figure 1) were analyzed. Based on the NHSN SAAR baselines, small facilities utilized antibiotic agents more than predicted from 2017 to 2023. The All-Antibacterial SAAR values of small facilities decreased significantly from 2017 to 2023, with a marked decrease between 2018 and 2021. During this time, there was a statistically significant difference of 0.34 in the SAAR value (1.37 to 1.03; P > .0001). In contrast, medium and large facilities showed minor fluctuations in the SAAR, which remained close to 1.0 from 2017 to 2023.
SAAR trends by facility bed-size for all-antibacterial agents, 2017–2023. SAAR trends for 2017–2023 for all-antimicrobial agents were evaluated for facilities based on bed size. Small facilities, <100 licensed beds (yellow line); medium facilities, 100 – 250 licensed beds (blue line); large facilities, >250 licensed beds (red line). Each data point represents a SAAR value. A SAAR of 1.0 represents observed use equal to predicted use and is represented with a dashed gray line. Abbreviation: SAAR = standardized antimicrobial administration ratio.

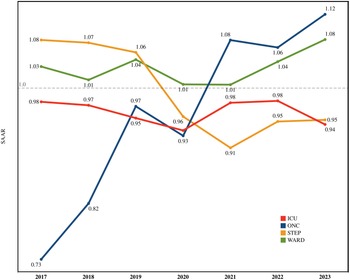
The SAAR values for the all-antimicrobial agents category were also evaluated based on patient locations: ICU, ONC, STEP, and WARD (Figure 2). The SAAR trends varied based on patient care locations. From 2017 to 2023, the ONC SAAR had the most significant increase among the location categories (0.73 to 1.12; P value<.0001). The WARD SAAR values remained close to 1.0 during this time, with a slight drop in 2018, 2020, and 2021 and a slight increase in 2023. The STEP SAAR values significantly decreased from 2017 to 2023 from 1.08 to 0.95, respectively (Pvalue = .0012). The ICU SAAR values remained under 1.0 from 2017–2023, with minor fluctuations.
SAAR trends by patient location, 2017–2023. All-antibacterial SAAR values for the following NHSN patient care locations were evaluated: ICU (red line), ONC (blue line), STEP (yellow), and WARD (green). Each data point represents a SAAR value. A SAAR of 1.0 represents observed use equal to predicted use and is represented with a dashed gray line. Abbreviations: SAAR = standardized antimicrobial administration ratio; ICU = intensive care unit; ONC = hematology-oncology; STEP = step-down; WARD = medical/surgical.

Since no significant changes were observed in all-antimicrobial SAAR values for the ICU, the ICU data was further evaluated to determine if there were any changes in SAAR values based on the antimicrobial category (Table 2). From 2017 to 2023, SAAR values for BSCA, Antifungal, and NSBL in the ICU locations remained lower than predicted. Conversely, the SAAR values for BSHO and GramPos were slightly above the predicted value for five years (2017, 2018, 2019, 2021, 2022) and four years (2017, 2018, 2021, 2022). The antibacterial agents posing the highest risk for the Clostridioides difficile (CDI) category remained consistently above the predicted value, peaking in 2020 at 1.20.
ICU SAAR values by antimicrobial category, 2017–2023

ICU SAAR values for antimicrobial categories. The highlighted sections indicate a SAAR value greater than the predicted value (>1.00).
Abbreviations: SAAR = standardized antimicrobial administration ratio; BSHO = broad-spectrum antibacterial agents predominantly used for hospital-onset infections; BSCA = broad-spectrum antibacterial agents predominantly used for community-acquired infections; GramPos = antibacterial agents predominantly used for resistant Gram-positive infections; antibacterial agents posing the highest risk for Clostridioides difficile infection; Antifungal = antifungal agents predominantly used for invasive candidiasis; NSBL = narrow-spectrum beta-lactam agents.
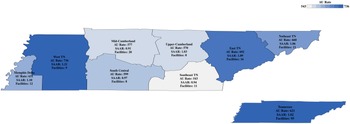
Tennessee is divided geographically into eight Emergency Medical Service (EMS) regions (Figure 3). The five most populated counties and their corresponding EMS Regions are Shelby (Memphis Delta), Nashville-Davidson (Mid-Cumberland), Knox (East Tennessee), Hamilton (Southeast Tennessee), and Rutherford (Mid-Cumberland) 9 . The most recent year of available data, 2023, was used to investigate geographic changes in AU rate and all-antibacterial agent SAAR among state regions (Figure 3).
Emergency medical service (EMS) regions of Tennessee. Tennessee is divided into eight emergency medical services (EMS) regions, as shown in Figure 3. Abbreviations: EMS, = emergency medical service; TN, = Tennessee; AU rate = antimicrobial use in days of therapy/1000 days present; SAAR = standardized antimicrobial administration ratio.

West Tennessee exhibited the highest AU rate at 736 DOT per 1000 days present, while Southeast Tennessee had the lowest AU rate of 543 DOT per 1000 days present in 2023 (P < .0001). Additionally, Northeast TN, East TN, and the Memphis Delta had AU rates above the statewide AU rate of 621. South Central, Upper-Cumberland, Mid-Cumberland, and Southeast TN AU rates fell below the statewide average.
West Tennessee also had the highest SAAR for All Antibacterial agents at 1.21. Memphis Delta, East Tennessee, Upper Cumberland, and Northeast Tennessee displayed SAAR values greater than predicted, as did the Tennessee Statewide, at 1.02. South Central, Mid-Cumberland, and Southeast Tennessee SAAR values were less than predicted.
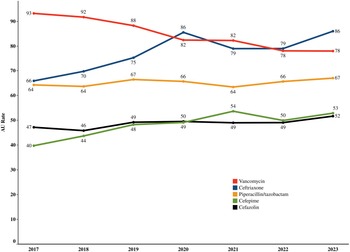
Lastly, the most used antimicrobials were identified based on AU rates for 2017 to 2023 (Figure 4). The antimicrobial agents with the highest use during this period were vancomycin, ceftriaxone, piperacillin/tazobactam, cefepime, and cefazolin. In 2023, these five antimicrobials represented 54% of total antimicrobial use in Tennessee.
AU rates for the top 5 most utilized antimicrobial agents. The most common antimicrobial agents used from 2017 – 2023 were vancomycin (red line), ceftriaxone (blue line), piperacillin/tazobactam (yellow line), cefepime (green line) and cefazolin (black line). Abbreviations: AU = antimicrobial use.

Although vancomycin use and the AU rate remained high during this period, a significant decrease in the AU rate was observed from 2017 to 2023 (P = .0001). In contrast, ceftriaxone use increased from 2017 (66 DOT/1000 DP) to 2023 (86 DOT/1000 DP) P = .7061). Although this change was not statistically significant, it is still worth noting. Furthermore, ceftriaxone use exceeded vancomycin use in 2020, 2022, and 2023. Piperacillin/tazobactam utilization was relatively consistent from 2017 to 2023 (64 to 67 DOT/1000 DP). Cefepime and cefazolin AU rates increased from 40 to 47 DOT/1000 DP in 2017 to 53 and 52 DOT/1000 DP in 2023, respectively.
Discussion
This study provides the first comprehensive assessment and analysis of statewide AU rate and SAAR data reported by facilities to NHSN. While these data are state-specific, they can serve as a model for other states and jurisdictions to analyze and describe their antimicrobial use data. The analysis indicates a significant increase in the AU rate from 2017 through 2023. Following the 2022 Tennessee reporting requirement, 97 of 117 (∼83%) registered NHSN facilities reported at least one month of data into the AU Option by January 2024. A total of 97 unique facilities contributed data, while 95 facilities were reporting as of January 2024. This upward trend in reporting was highlighted by the CDC, noting a total of 1,222 acute care hospitals across the United States contributed at least one month of AU data to NHSN for adult SAAR locations in 2019 compared to 2,007 facilities in 2022 10,11 . In Tennessee, external reporting was postponed until a sufficient number of facilities contributed. This approach aimed to offer a more comprehensive insight into their antimicrobial use. By ensuring a robust data set, the state can improve monitoring, enhance decision-making and refine data analysis. Ultimately, this initiative is designed to bolster public health response and better equip health authorities to address antimicrobial stewardship. A prior study evaluating statewide antimicrobial use evaluated 36 facilities in South Carolina and discussed their experience in distributing statewide comparative SAAR analyses to facilities Reference Winders, Antosz and Al-Hasan12 . Our study offers a detailed examination of statewide trends in AU rates and SAAR in Tennessee, a state with high antimicrobial use, identifying areas that require improved antimicrobial stewardship efforts.
During the observed period, agents for BSHO infections were utilized more than predicted. This suggests either a greater burden of hospital-onset infections or an overuse of broad-spectrum (antipseudomonal) agents. The COVID-19 pandemic between March 2020 and May 2023 may have influenced AU and SAAR trends during this time Reference Sarker, Roknuzzaman, Nazmunnahar, Shahriar, Hossain and Islam13,Reference Winders, Bailey and Kohn14 . According to the 2022 CDC special report, COVID-19: US Impact on Antimicrobial Resistance, approximately half of hospitalized patients received ceftriaxone during the pandemic. This aligns with our study’s findings, indicating increased ceftriaxone use from prepandemic levels (Figure 4) 15 . Additionally, an observational cohort study conducted in 17 South Carolina hospitals from March to June 2020 reported a significant 16.4% increase in BSHO agent use among facilities that admitted COVID-19 patients Reference Winders, Bailey and Kohn14 . In contrast, our study demonstrated a decrease in BSHO SAAR from 2019 to 2020 when comparing the complete calendar years (Table 1). Multiple factors may have contributed to these trends, including the influx of complex COVID-19 patients in ICUs and disruptions to normal antimicrobial stewardship practices. Additionally, the South Carolina study only evaluated the first 3 months of the pandemic, while the changes observed in Tennessee were seen between calendar years 2019 and 2020.
When evaluating the All-Antibacterial SAAR for facilities based on bed size, notable variations emerge. Small facilities tend to have SAAR values greater than 1.0, indicating days of therapy exceeded predictions, while medium and large facilities generally utilize antibiotics as predicted. Several factors could contribute to this observation, such as differences in resource allocation or the availability of stewardship expertise. Additionally, the fewer number of patients admitted to smaller facilities allows for greater fluctuation in antimicrobial use. These findings highlight the need for enhanced antimicrobial stewardship efforts and improved tracking of AU in small facilities in Tennessee.
An analysis of the SAAR values reveals notable differences among various unit types. Oncology units experienced the most significant change in the All-Antibacterial SAAR; however, this may be attributed to the limited number of facilities reporting on oncology units from 2017 to 2018. In contrast, the combined group of critical or intensive care units used antibacterial agents less than predicted for the entire period, while medical/surgical ward units were at or above the predicted levels of usage. These trends may necessitate further stewardship efforts to identify underlying patterns. The most pronounced change observed at the unit level was in step-down units, which utilized antibacterial agents more than predicted until 2020 when their utilization fell below the expected levels. This shift may also be connected to the COVID-19 pandemic, as the surge in patients with respiratory symptoms requiring advanced care likely impacted unit mapping.
The only SAAR types greater than 1.00 during the period were BSHO, GramPos, and CDI. The use of antibacterial agents at high risk for CDI was greater than predicted for the entire period. This SAAR category also has antibacterial agents in several other categories. Further study could evaluate CDI rates with antibacterial usage.
Geographic variations in AU rate and SAAR showed that the highest use of antimicrobial agents occurred in West TN in 2023 followed by East TN. Additional analysis of the types and sizes of facilities in these regions may assist in pinpointing the areas requiring improvement in antimicrobial use.
The strengths of this study include the high percentage of Tennessee facilities reporting data to NHSN, which allows for a large data set to illustrate statewide antimicrobial use following the reporting requirement. Additionally, the time frame analyzed reveals trends before, during and after the COVID-19 pandemic, enabling observations of changes over time.
However, this study has several limitations. First, NHSN does not collect patient-level data, making it impossible to determine the appropriateness of antimicrobial use. Moreover, antimicrobial resistance data was not included in this study, so it cannot provide insights into any correlation with broad-spectrum antimicrobial use. The NHSN data only reflects inpatient antimicrobial use, excluding outpatient settings such as emergency departments and clinics. Additionally, during the study period, the number of antimicrobials changed as new agents were introduced to the market and others were removed and the number of reporting facilities increased. Ninety-one antimicrobial agents were included in the AUR module in 2017. By December of 2023, 13 agents were added and 11 were removed from the AUR Module 4 . This slight change in antimicrobial agents eligible for reporting may have contributed to changes in AU and SAAR data for facilities or the state. The total number of reporting facilities increased significantly throughout the study period, likely due to improved accessibility of reporting, which may have contributed to changes in the antimicrobial use rate. Specifically, the number of facilities with oncology units is lower than that of the overall facilities, which may lead to greater variability in SAAR rates for those units. Finally, the SAAR metric is only used in the United States, which complicates international comparisons.
As a state health department, our ability to implement interventions at the facility level is limited. In Tennessee, we provide facilities with quarterly feedback and analysis. An AU Data Quality Report identifies data errors that impact reporting, allowing for corrections. The SAAR Reports compare a facility’s SAAR data to similar-sized facilities within the state, organized by SAAR category type and unit location. These reports promote discussions between stewardship personnel at the state and facility levels.
Future analysis of NHSN data should include the Antimicrobial Resistance Option to evaluate trends in resistance patterns in relation to antimicrobial use. Additionally, capturing patient-level data in NHSN could allow for analysis of new metrics such as social determinants of health or specific diagnostic tools. As NHSN develops new metrics and updates the baselines for SAARs, future studies should assess their impact on statewide antimicrobial use.
Financial support
The Antimicrobial Stewardship Program of the Tennessee Department of Health Healthcare-Associated Infections and Antimicrobial Stewardship Program received funding for this project from the Epidemiology and Laboratory Capacity Cooperative Agreement (Federal Grant # NU51CK000367) and the Strengthening HAI/AR Program Capacity Cooperative Agreement (Federal Grant # NU50CK000528).
Competing interests
All authors report no conflicts of interest relevant to this article.



 Open access

