


1. Introduction
Explicit and implicit performance incentives, as well as mutually beneficial opportunities for voluntary cooperation, coexist in many contractual and organizational settings. Explicit incentives (‘pay for performance’) and implicit incentives (strategic incentives enabled in repeated interactions) appeal to an agent’s self-interest to exert high effort. Empirical and (field) experimental evidence (e.g., Anderhub, Gächter & Königstein, Reference Anderhub, Gächter and Königstein2002; Bandiera, Barankay & Rasul, Reference Bandiera, Barankay and Rasul2005; Gächter, Huang & Sefton, Reference Gächter, Huang and Sefton2016; Lazear, Reference Lazear2000; Shearer, Reference Shearer2004) shows that effort behavior is often consistent with predictions of self-interest-based incentive theory. However, a large body of experimental evidence from trust games, gift-exchange games, and public goods games also shows that many people are willing to cooperate voluntarily – that is, to act against their self-interest to benefit others (for surveys, see, e.g., Bowles, Reference Bowles2016; Chaudhuri, Reference Chaudhuri2011; Drouvelis, Reference Drouvelis2021; Fehr & Charness, Reference Fehr and Charness2024; Fehr & Fischbacher, Reference Fehr and Fischbacher2003; Fehr & Schurtenberger, Reference Fehr and Schurtenberger2018; Gintis, Bowles, Boyd & Fehr, Reference Gintis, Bowles, Boyd and Fehr2005). If both motivations – following explicit material incentives as set out in contracts and institutions and voluntary cooperation as motivated by social preferences – are behaviorally relevant and coexist in many economic relationships (e.g., Bewley, Reference Bewley1999; Fehr & Falk, Reference Fehr and Falk2002), the question arises how they influence agents’ effort choices.
In this article, we study how incentives affect voluntary cooperation in the form of high levels of social value-enhancing effort choices. In naturally occurring contractual relations, present and past experience with incentives and trust-based voluntary cooperation coexist and might influence effort choice. Our goal is to separate the channels of present and past experience with incentives, as well as experience with trust-based voluntary cooperation, using a systematic and highly comparable series of eight laboratory gift-exchange experiments with designs inspired by previous evidence on the consequences of incentives for voluntary cooperation.
We are guided by three main questions. First, how does the presence of explicit incentives influence voluntary cooperation when incentives alone cannot achieve efficiency? Second, does the experience of explicit incentives have ‘spillover effects’ on subsequent voluntary cooperation even when there are no explicit incentives present anymore? Third, how does experience with voluntary cooperation before being exposed to incentive contracts influence crowding-out in the presence of incentives and their possible spillover effects on behavior under contracts without incentives?
Some answers to the first two questions already exist in the literature (see, e.g., Bowles, Reference Bowles2008; Bowles & Polania-Reyes, Reference Bowles and Polania-Reyes2012), but the evidence does not come from comparable designs. For instance, laboratory evidence from gift-exchange market games (e.g., Fehr & Gächter, Reference Fehr and Gächter2002), trust games (e.g., Bohnet, Frey & Huck, Reference Bohnet, Frey and Huck2001), or common pool resource games (e.g., Cardenas, Stranlund & Willis, Reference Cardenas, Stranlund and Willis2000) suggests that the presence of incentives may crowd out voluntary cooperation. Similarly, evidence from laboratory public goods games (e.g., Falkinger, Fehr, Gächter & Winter-Ebmer, Reference Falkinger, Fehr, Gächter and Winter-Ebmer2000) and field evidence (e.g., Burks, Carpenter & Goette, Reference Burks, Carpenter and Goette2009; Gneezy & Rustichini, Reference Gneezy and Rustichini2000) suggest that incentives can have spillover effects on subsequent performance even after they have been abolished. To our knowledge, little is known about our third question. Our goals therefore are (i) to use the power of a comparable set of laboratory gift-exchange experiments to provide answers to the three questions posed above and (ii) to provide a unified econometric framework that explains effort choice in terms of incentives and positive and negative reciprocity, which are well-established behavioral motivations (e.g., Fehr & Gächter, Reference Fehr and Gächter2000).
The core argument explaining why incentives may crowd out voluntary cooperation is as follows. The psychological sources of cooperation are social preferences like concerns for fairness and equity, reciprocity and guilt aversion, loyalty and goodwill, or social norms and social esteem (all formalized in various theories).Footnote 1 By contrast, explicit incentives are, by design, a direct appeal to people’s self-interest and, therefore, in conflict with other-regarding concerns. Incentives might also convey mistrust and trigger ‘control aversion’ (e.g., Falk & Kosfeld, Reference Falk and Kosfeld2006; Schmelz & Bowles, Reference Schmelz and Bowles2021; Schmelz & Ziegelmeyer, Reference Schmelz and Ziegelmeyer2020; Ziegelmeyer, Schmelz & Ploner, Reference Ziegelmeyer, Schmelz and Ploner2012). The general point is that trust contracts and incentive contracts send psychologically conflictual signals to which agents may react differently.
There are at least three reasons why we believe that our research questions are important. First, the presence of explicit incentives in otherwise incomplete contracts raises the question whether ‘material interests’ and the ‘moral sentiments’ as expressed in voluntary cooperation are separable, that is, whether incentives and voluntary cooperation are independent of the levels of the other: Can we add voluntary cooperation on top of what incentives induce the agent to do, or do incentives per se influence the extent of cooperation agents are willing to exert? More precisely, a failure of separability occurs if, under a given contract, voluntary cooperation – actual effort exceeding best-reply effort – is different than the voluntary cooperation agents are willing to provide under a comparable trust contract.
As Bowles and Hwang (Reference Bowles and Hwang2008) argue, separability is an often-invoked assumption, but the psychological differences between incentives and voluntary cooperation suggest separability might not hold. If separability fails (suggested by Bowles, Reference Bowles2008, Reference Bowles2014, Reference Bowles2016; Bowles & Polania-Reyes, Reference Bowles and Polania-Reyes2012), incentives may be overused or underused, which has implications for mechanism design (e.g., Bowles & Hwang, Reference Bowles and Hwang2008; for a discussion of these issues in a broader context, see Besley & Ghatak, Reference Besley and Ghatak2018; Kranton, Reference Kranton2019).
Second, in many economic relationships, agents might have past experience with trust and reciprocity and/or with explicit incentives, either because of policy changes within an organization or because of different regimes agents might experience when moving to organizations with different incentive policies. Specifically, the experience of explicit incentives may have spillover effects on voluntary cooperation even if explicit incentives are no longer present. This possibility is suggested by literature on history dependence and learning (e.g., Cooper & Kagel, Reference Cooper, Kagel, Kagel and Roth2016; Cooper & Stockman, Reference Cooper and Stockman2011; Rand & Peysakhovich, Reference Rand and Peysakhovich2016). Because explicit incentives are salient appeals to self-interest, self-interested behavior may carry over into situations requiring voluntary cooperation even if explicit incentives are no longer present.Footnote 2 Similarly, principals’ experience with agents’ effort choices might influence their subsequent offered contracts. More precisely, history dependence in voluntary cooperation occurs if effort under a given trust contract is influenced by a previously experienced trust or incentive contract. History dependence may therefore support or hinder voluntary cooperation: If people experience voluntary cooperation, it may become salient and thereby support cooperation; similarly, experience with incentive contracts may make self-interest more salient, thereby undermining voluntary cooperation.
Finally, studying the behavioral consequences of performance incentives is important because, fundamentally, many real-world contracts are incomplete, which leaves important aspects unregulated and therefore non-enforceable. As has long been noted, voluntary cooperation is necessary to ensure efficiency under contractual incompleteness (see, e.g., Akerlof, Reference Akerlof1982; Bewley, Reference Bewley1999; Bowles, Reference Bowles2003, Reference Bowles2016; Ellingsen, Reference Ellingsen2024; Fehr, Goette & Zehnder, Reference Fehr, Goette and Zehnder2009; Fehr, Klein & Schmidt, Reference Fehr, Klein and Schmidt2007; Williamson, Reference Williamson1985). Reciprocity-based voluntary cooperation can be a ‘contract enforcement device’ (Fehr, Gächter & Kirchsteiger, Reference Fehr, Gächter and Kirchsteiger1997), which, however, might be in conflict with performance incentives.
In summary, many contractual relationships require voluntary cooperation for their efficient fulfillment. Given this, the behavioral consequences of explicit incentives as appeals to self-interest – both their contemporaneous impact and their spillover effect – may depend on the salience of self-interest and be moderated by the experience people have with voluntary cooperation. Our experiments are designed to systematically test these arguments.
Our analyses are based on laboratory gift-exchange experiments (for surveys, see Charness & Kuhn, Reference Charness, Kuhn, Ashenfelter and Card2011; Cooper & Kagel, Reference Cooper, Kagel, Kagel and Roth2016; Fehr et al., Reference Fehr, Goette and Zehnder2009).Footnote 3 The gift-exchange game is a two-player game in which a principal offers a fixed wage to an agent. The agent can accept or reject the wage offer. If the agent accepts, they choose an effort level. Effort is costly for the agent and beneficial for the principal. Efficiency requires maximal effort, whereas a self-interested agent will provide minimal effort irrespective of the accepted wage (no voluntary cooperation). Numerous experiments refute this prediction and demonstrate the relevance of voluntary cooperation – wages and effort are positively correlated even in one-shot games.Footnote 4 We replicate this finding in a version of the gift-exchange game we call the ‘Trust contract.’ This will provide the necessary benchmark for the comparisons we are mainly interested in.
The explicit incentives take the form of either a ‘Fine contract’ – that is, a contractually agreed wage reduction in case actual effort falls short of the desired effort or (in different experiments) a ‘Bonus contract,’ where the agent receives a contractually agreed additional wage payment if the actual effort is at least as high as the desired effort. Both contracts induce the same material incentives and hence any behavioral difference is a framing effect.
We design the set of feasible contracts such that the maximally enforceable effort (by means of incentive-compatible contracts) is substantially less than the efficient level. Thus, there is room for efficiency-enhancing voluntary cooperation beyond the maximally enforceable level. Our design also allows for an easy distinction between incentive-compatible and non-incentive-compatible (NIC) contracts; the latter are directly comparable to Trust contracts that are NIC by design.
Our research strategy is based on eight experiments organized in three sets. Some of our design elements are inspired by past research, and we will explain the connection in Sections 3 and 4. In the first set of three experiments, we establish some basic facts about history dependence and failure of separability. We investigate how voluntary effort provision is affected (i) after agents experienced explicit incentives (measuring history dependence) and (ii) while agents are exposed to Bonus or Fine contracts (measuring separability).
In the second set of two experiments, we investigate how experience with Trust contracts before being exposed to Bonus or Fine contracts affects behavior under incentives and after incentives. Experience with Trust contracts is an interesting contextual variable because the psychology of Trust contracts might set an important reference point before being exposed to incentives. Experience with Trust contracts before being exposed to incentives may blunt the salience of incentives and their focus on self-interest.
The third set of three experiments investigates how implicit incentives coming from repeated interaction affect history effects and separability observed in the first two sets of experiments, where we randomly change pairings across iterations to avoid confounds of separability issues with strategic incentives. Implicit incentives, which allow for sequential reciprocity across rounds of interactions, are arguably a very important feature of many ongoing relationships, and therefore it is important to understand how they, together with the explicit incentives, affect effort behavior.
Our most important results are as follows. We find that the experience of explicit incentives spills over to situations without incentives by ‘crowding out’ voluntary cooperation. This result establishes that the behavioral consequences of incentives can extend beyond their immediate presence. This effect is largest in repeated relationships, which otherwise strongly increase effort compared to one-shot interactions. Incentives also crowd out voluntary cooperation in the presence of incentives: There is no voluntary cooperation beyond the level induced by incentive-compatible contracts, even though agents are willing to provide higher levels without incentive-compatible contracts. Our econometric analysis shows that crowding-out mostly happens due to reduced wages and not due to changed wage–effort relationships.
2. The stage games and benchmark solutions
2.1. The games
Our tools are gift-exchange games (Fehr & Gächter, Reference Fehr and Gächter2002; Fehr et al., Reference Fehr, Gächter and Kirchsteiger1997), summarized in Table 1, and incentive games inspired by Anderhub et al. (Reference Anderhub, Gächter and Königstein2002) and adapted for present purposes. Each game has three stages. The principal first offers the agent a contract. In the Trust game, the contract comprises a fixed wage w and a desired effort ed (effort can also be interpreted as output). Desired effort can be seen as a minimal form of communication with which the principal sends a message about what they expect from the agent.Footnote 5 The contract must obey the restrictions  $1 \leq {e^d} \leq 20$ and $- 700 \leq w \leq 700$ in integers (negative wages are allowed because in a benchmark solution (see Section 2.2), wages can become negative). In the Fine and Bonus game, the contract, in addition to w and ed, also specifies a fine or bonus (see Table 1).
Games and parameters

Effort cost: c(e) = 7e – 7; Payoff if contract rejected: 0 for both.
Second, the agent can accept or reject the contract. If the agent rejects, the game ends and both earn nothing. If the agent accepts, he or she enters the third stage and chooses effort e in integers (where  $1 \leq e \leq 20$). The agent is not restricted by ed. This reflects contractual incompleteness because ed is not enforceable. The stage game ends after the effort choice.
In all games, the principal’s return from effort is 35e and the agent’s cost function is increasing and, for simplicity, linear in effort: c(e) = 7e – 7. Each player knows the rules, including all payoff functions, and is informed about all choices made in the game.
In the Trust game, the offered contract only consists of w, ed. Because w cannot be conditioned on effort, we refer to this game as the ‘Trust game.’ The principal earns 35e – w and the agent earns w – c(e).
The offered contract in the Fine game consists of w, ed, f, where f represents a fine (it can be interpreted as an announced wage reduction if e < ed). The principal can announce one of four lump-sum fine levels: f ∊ {0, 24, 52, 80}. If e is less than ed, f is subtracted from the agent’s wage and the principal’s wage bill is reduced accordingly. If e is greater than or equal to ed, the fine is not imposed.
In the Bonus game, the offered contract contains w, ed, b, where b is a bonus (an announced wage increase if e ≥ ed) with b ∊ {0, 24, 52, 80}. If e is greater than or equal to ed, the bonus is added to the agent’s payoff and subtracted from the principal’s payoff. If e is less than ed, the bonus is not due.
We use lump-sum Fine and Bonus as incentives because they are simple and easy to understand. Moreover, they have attractive properties for our purposes, as we show in Section 2.2.
2.2. Stage game benchmark solutions for money-maximizing agents
Trust game: A money-maximizing agent will choose e = emin = 1 irrespective of w and therefore the principal will offer the wage that just ensures the agent’s acceptance: w = 1 (or w = 0). The resulting payoffs are 34 money units for the principal and 1 money unit for the agent. This solution is inefficient because the efficient surplus is 567 at e = emax = 20.
Fine game and Bonus game: In choosing effort, the agent must consider two alternatives, e equals ed or e equals 1. Effort e greater than ed is suboptimal since it causes higher cost without increasing payment. Conditional on e lower than ed, minimal effort e equals 1 is best because Fine and Bonus payments are independent of e. Hence, the optimal effort level is:
 \begin{align}{e^*} = \left\{ {\begin{array}{*{20}{l}}\!\!
{{e^d}{\text{ if }}w - c({e^d}) \geq w - f - c(1)\,\,\, \Leftrightarrow \,\,\,f \geq c({e^d}){\text{ or }}w + b - c({e^d}) \geq w - c(1)\, \Leftrightarrow \,b \geq c({e^d});{\text{ }}} \\
\!\!{1{\text{ otherwise}}{\text{.}}}
\end{array}} \right.\nonumber\\ \end{align}
\begin{align}{e^*} = \left\{ {\begin{array}{*{20}{l}}\!\!
{{e^d}{\text{ if }}w - c({e^d}) \geq w - f - c(1)\,\,\, \Leftrightarrow \,\,\,f \geq c({e^d}){\text{ or }}w + b - c({e^d}) \geq w - c(1)\, \Leftrightarrow \,b \geq c({e^d});{\text{ }}} \\
\!\!{1{\text{ otherwise}}{\text{.}}}
\end{array}} \right.\nonumber\\ \end{align}Notice that the best-reply efforts are the same in the Fine game and the Bonus game; any behavioral difference for a given contract is therefore due to a framing effect.
The agent’s best-reply function (1) is the incentive-compatibility constraint for the principal’s contract design problem. For each level of f or b, a maximal level of desired effort exists that satisfies f and b are greater than or equal to c(ed). Given our parameters, the maximally enforceable effort is 12. Before choosing effort, the agent must accept an offered contract. With the parameters from Table 1, it is optimal for the principal to set w such that the agent is just compensated for his or her effort cost c(e*); furthermore, the solution to the principal’s problem is f and b = 80, ed = 12 and wf = c(12) = 77 or wb = b – c(12) = –3 (where wf (wb) denotes the wage in the Fine (Bonus) game). Accordingly, the agent will accept the contract and choose e equals 12. This solution is more efficient than the solution without incentives, but it does not generate the maximal surplus (the surplus is 343 money units, which goes entirely to the principal).
We set the maximally enforceable effort under incentive-compatible contracts at 12 because this leaves room for voluntary cooperation beyond what incentives can achieve. This design feature reflects contractual incompleteness that characterizes many real-world contracts, even if some aspects can be contractually regulated. By allowing for different Fine and Bonus levels (including zero), we give the principal the possibility to set the strength of the incentives he or she wants to apply to the agent (we included zero because there is evidence that deliberately abstaining from using incentives when incentives could have been used induces more cooperation; Fehr & List, Reference Fehr and List2004; Fehr & Rockenbach, Reference Fehr and Rockenbach2003). Moreover, different combinations of f, b, and ed that satisfy the incentive-compatibility constraint can induce different best-reply efforts, and this variation allows for a sharper test of whether agents choose best-reply efforts than a more restricted (e.g., binary) set would have allowed for.
Also notice that if the offered contract violates incentive compatibility, e* equals 1, like in the Trust game. This property will be important in our analysis because it makes Trust contracts and NIC contracts directly comparable.
3. Research questions, experimental design, and procedures
3.1. Research questions and experimental design
Table 2 lists our eight between-subjects experiments. Here, we only describe our experiments; we discuss our behavioral hypotheses in Section 4.
Main research questions and experimental design
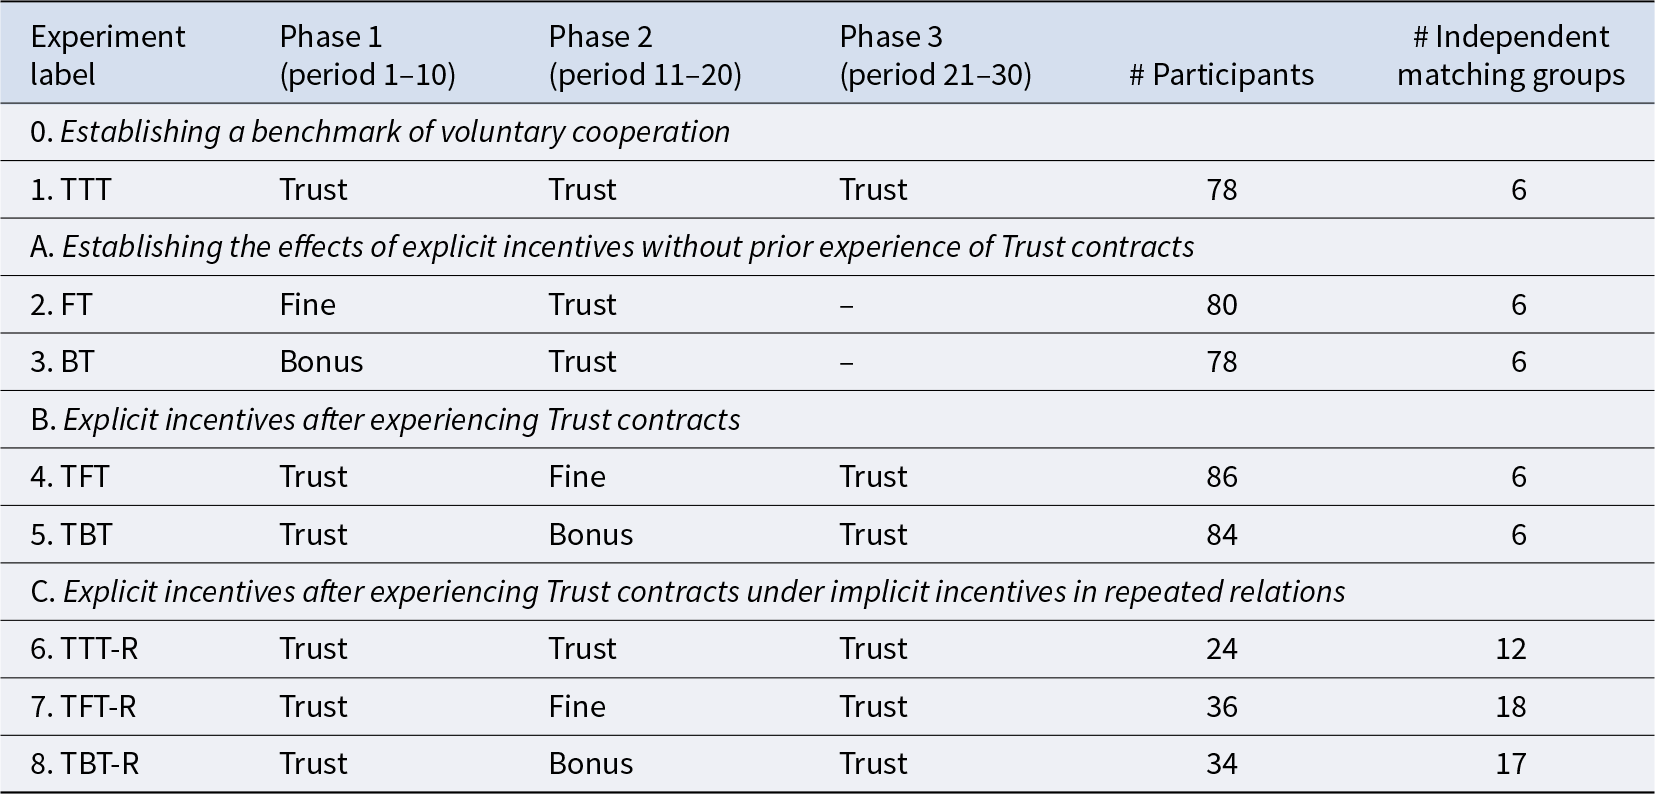
Experiments #1 to #5 are one-shot interactions (‘Strangers’), whereas experiments #6 to #8 are run as repeated games in fixed pairs (‘Partners,’ indicated by the suffix -R). The two-phase experiments are a conceptual replication of Fehr and Gächter (Reference Fehr and Gächter2002).
Experiment #1 is TTT, our benchmark. In TTT, participants play three phases, each of which comprises ten one-shot Trust games played in randomly matched pairs. If effort is higher than predicted according to the benchmark solution (i.e., e > e*), we refer to this as ‘voluntary cooperation.’ This is a standard gift-exchange experiment (see, e.g., Fehr et al., Reference Fehr, Gächter and Kirchsteiger1997; Fehr, Kirchler, Weichbold & Gächter, Reference Fehr, Kirchler, Weichbold and Gächter1998), adapted for our purposes and repeated over thirty periods. Because we observe behavior under Trust contracts across three phases of ten periods each, TTT allows us to observe whether learning leads to the erosion of voluntary cooperation across the phases or whether history dependence (as triggered by the experience of gift-exchange contracts in phase 1) can also lead to stable gift-exchange in later phases.
Against the TTT benchmark, we conduct three sets of experiments. The first set of experiments (the two-phase experiments #2 and #3, labeled FT and BT in panel A in Table 2) are a conceptual replication of similar two-phase experiments by Fehr and Gächter (Reference Fehr and Gächter2002). These experiments aim at (i) measuring the impact of explicit incentives on effort choices, (ii) investigating how incentives affect effort choice with and without incentive-compatible contracts and without prior experience of Trust contracts before being exposed to incentive contracts, (iii) studying a spillover effect of experiencing explicit incentives on effort choice in subsequent Trust contracts and (iv) measuring the role of framing (Fine vs. Bonus contracts). To avoid confounds with strategic incentives, participants play 1-shot experiments in 2 phases of 10 periods each. In phase 1, principals can design either Fine or Bonus contracts (in between-participants treatments), whereas in phase 2 (within-participants), only Trust contracts are feasible. Notice that FT and BT allow us to isolate the behavioral consequences of explicit incentives both while they are present (in phase 1) and after they have been abolished (in phase 2) when the behavioral salience of explicit incentives is unconfounded with prior experience of gift exchange under Trust contracts.
The second set of experiments (#4 and #5 in panel B, labeled TFT and TBT, respectively) extends the basic setting of experiments #2 and #3 (with their respective research questions) by adding a prior experience with gift exchange under Trust contracts. Therefore, TFT and TBT allow for the study of how a history of experience with Trust contracts (in phase 1) influences behavior under incentive contracts (in phase 2) and subsequent Trust contracts (in phase 3).
The third set of experiments is finitely repeated games with the same Partner in all phases (#6 to #8 in panel C, labeled TTT-R, TFT-R, and TBT-R, respectively). These experiments add implicit incentives to the designs and research questions of experiments #4 and #5. There are theoretical and empirical reasons why there are implicit (i.e., strategic) incentives to cooperate: If selfishness and rationality are not common knowledge, cooperation can be sequentially rational (Kreps, Milgrom, Roberts & Wilson, Reference Kreps, Milgrom, Roberts and Wilson1982). Bounded rationality can also lead to cooperation (Selten & Stoecker, Reference Selten and Stoecker1986). Previous experimental evidence also suggests that cooperation in repeated games of cooperation (including gift-exchange games) is higher than in one-shot games (e.g., Brown, Falk & Fehr, Reference Brown, Falk and Fehr2004; Embrey, Fréchette & Yuksel, Reference Embrey, Fréchette and Yuksel2018; Falk, Gächter & Kovacs, Reference Falk, Gächter and Kovacs1999; Reuben & Suetens, Reference Reuben and Suetens2012).
3.2. Procedures
We conducted 20 sessions at the University of St. Gallen (Switzerland) with a total of 500 participants (first-year undergraduates of business, economics, or law). We recruited participants by drawing a random selection from a database of volunteer participants and invited them by email. In a typical session, 28 participants were present at the same time.
After arrival at the lab, participants read the instructions (see Appendix A; the same for all) and then were asked to answer control questions on payoff calculations. The experiment did not start before all participants had answered all questions. Roles were assigned at random and fixed throughout the session. We explained that all decisions would be anonymous during the whole experiment. At the beginning of each session, we told participants that there would be different parts and that they would learn about them one after the other.
The experiments were computerized and conducted with ‘z-Tree’ (Fischbacher, Reference Fischbacher2007). Participants were separated by partitions and matched anonymously. In sessions with random matching, we formed 2 independent matching groups of 14 participants each. Participants were not informed about the matching groups and were told they would be randomly matched with another person in the room. Participants also never learned the identity of their opponent. Each session lasted two hours. Participants earned on average CHF 45 (approximately €30 at the time of the study).
4. Hypotheses
There is ample evidence for voluntary cooperation under Trust contracts even with Stranger matching (see, e.g., Cooper & Kagel, Reference Cooper, Kagel, Kagel and Roth2016; Drouvelis, Reference Drouvelis2021; Fehr & Charness, Reference Fehr and Charness2024; Fehr & Gächter, Reference Fehr and Gächter1998; for overviews). This violates the assumption of selfish (money-maximizing) rationality, which predicts that effort and offered wage are minimal in one-shot games as well as finitely repeated games. However, if one assumes social preferences, a ‘trust-reciprocity’ or ‘gift-exchange’ mechanism is possible (Akerlof, Reference Akerlof1982; shown in, e.g., Berg, Dickhaut & McCabe, Reference Berg, Dickhaut and McCabe1995; Fehr, Kirchsteiger & Riedl, Reference Fehr, Kirchsteiger and Riedl1993; Fehr et al., Reference Fehr, Gächter and Kirchsteiger1997): The principal offers a substantial fixed wage trusting that the agent will respond in kind by choosing an above-minimal effort level.
A positive wage–effort relationship is a well-established empirical regularity that we expect to replicate with Stranger and Partner matching (see, e.g., Brown et al., Reference Brown, Falk and Fehr2004; Falk et al., Reference Falk, Gächter and Kovacs1999; Gächter & Falk, Reference Gächter and Falk2002). In Partner matching, some trust by the principal is necessary in the beginning, but in later periods the principal as well as the agent might respond in kind to each other’s previous choice. We refer to this as the ‘sequential reciprocity’ mechanism. We expect sequential reciprocity across periods to be more powerful than one-shot trust reciprocity in inducing higher wages and obtaining higher effort conditional on wage.
We also expect to find strong behavioral effects of explicit incentives (e.g., Anderhub et al., Reference Anderhub, Gächter and Königstein2002; Dickinson, Reference Dickinson1999; Dickinson & Villeval, Reference Dickinson and Villeval2008; Gächter et al., Reference Gächter, Huang and Sefton2016). In our setting, the higher the fines or bonuses are, the higher the effort will be because the higher effort is the best reply provided the contract is set up to be incentive compatible (Section 2.2). Our design allows for a sharp test of best-reply predictions because contracts can be incentive-compatible or not. If a contract is not incentive compatible, e* equals 1 regardless of other features of the contract (the same as for Trust contracts; see equation (1)). If a contract is incentive compatible, there are 12 possible best-reply effort levels, and we can compare behavior against them.
Assuming we replicate these well-established psychological mechanisms, we investigate how explicit incentives interact with voluntary cooperation under Trust contracts. We focus on three main dimensions of this question: (i) How does the experience of incentive contracting influence voluntary cooperation in subsequent Trust contracting? (ii) How do explicit incentives affect effort choices when contracts are or are not incentive compatible? (ii) How does experience with Trust contracts before being exposed to incentive contracts change the results obtained to questions (i) and (ii)?
Regarding our first main question, we consider the effects induced by history dependence and learning. For instance, in the context of a step-level public goods game, Cooper and Stockman (Reference Cooper and Stockman2011) have shown that cooperation was influenced by experience in the first half of the experiment that manipulated either monetary concerns or fairness concerns (see also Cooper & Kagel, Reference Cooper, Kagel, Kagel and Roth2016). The paths of cooperation were different depending on the starting experience, but behavior converged over time. In our context, prior experience with Trust contracts can create a different history dependence than prior experience with incentive contracts. According to evidence on cooperation in gift-exchange games, in our TTT setting, to which we will compare FT/BT and TFT/TBT, agents’ effort choices will only depend on the wage offer. This should hold at least for phase 1, whose length of ten periods is comparable to most gift-exchange experiments. If phase 1 of TTT creates a precedence of gift exchange, history dependence in TTT may result in a wage–effort relationship that is stable in phases 2 and 3. By contrast, if agents in phase 1 of FT/BT learn their self-regarding incentives, gift exchange may dissipate, and effort in phase 2 of FT/BT may approach minimal levels.
There are three reasons why prior experience with incentive contracts can create a different history dependence than prior experience with Trust contracts: First, because an incentive contract appeals to the agent’s self-interest by communicating the monetary consequences for the agent of complying and violating the contract, it could shift agents’ attention to monetary incentives, thereby inducing a larger fraction of agents to choose minimal effort. Second, experience with incentive contracts might induce agents who still cooperate voluntarily to respond with somewhat lower effort – that is, it might weaken the reciprocal wage–effort relationship. Third, prior experience with incentive contracts, and the consequences this has for agents, could diminish principals’ trust in the agents’ willingness to respond in kind. Consequently, the principal might offer lower wages, which in turn reduces the agent’s effort response. Thus, our first hypothesis is:
Hypothesis 1 Compared to experiencing Trust contracts, experiencing incentive contracts reduces the amount of voluntary cooperation under subsequent Trust contracting.
We refine our first hypothesis depending on different experimental conditions as follows: We predict lower effort in phase 2 of treatments FT and BT than in phase 2 of TTT (Hypothesis 1a). The reason is that the explicit incentives of phase 1 of FT/BT may focus the agent on their self-interest, which then spills over into phase 2, whereas agents in phase 1 of TTT likely experience gift exchange where history dependence sustains gift exchange in phase 2 as well. Similarly, we predict smaller effort in phase 3 of TFT and TBT (after experiencing incentives in phase 2) than in phase 3 of TTT (Hypothesis 1b).
Because in TFT and TBT, participants can experience cooperation under Trust contracts in phase 1, we predict higher effort levels in phase 3 of TFT and TBT than in phase 2 of FT and BT (Hypothesis 1c). The reason is that in TFT/TBT, the salience of self-interest in phase 2 is now potentially moderated by the experience of gift exchange in phase 1. Finally, we predict lower effort levels in phase 3 of treatments TFT-R and TBT-R than in phase 3 of TTT-R (Hypothesis 1d).
Since the main hypothesis hinges fundamentally on reciprocal behavior, documented amply in previous gift-exchange experiments, we formulate:
Hypothesis 2 Under Trust contracting, effort choices respond reciprocally to the offered wage.
Specifically, a higher wage offer by the principal will reduce the probability of rejecting the contract (Hypothesis 2a; also found by Anderhub et al., Reference Anderhub, Gächter and Königstein2002) and the probability of minimal effort given the contract has been accepted (Hypothesis 2b). Furthermore, given the contract has been accepted and effort is higher than minimal, effort correlates positively with wage (Hypothesis 2c). These effects will be at least as strong under Partner matching than under Stranger matching because in Partner matching, strategic incentives (sequential reciprocity) across periods exist, and they will likely strengthen reciprocity.
We also expect that explicit incentives strongly influence effort in our settings (see, e.g., Anderhub et al., Reference Anderhub, Gächter and Königstein2002; Gächter et al., Reference Gächter, Huang and Sefton2016) and formulate this as our third hypothesis:
Hypothesis 3 Stronger monetary incentives induce higher effort.
We also investigate whether the framing of incentives as fine or bonus is important. Existing evidence is mixed. For instance, Fehr and Gächter (Reference Fehr and Gächter2002) and Fehr et al. (Reference Fehr, Klein and Schmidt2007) find that, in settings similar to ours, bonus contracts induce higher efforts than fine contracts. de Quidt, Fallucchi, Kölle, Nosenzo and Quercia (Reference de Quidt, Fallucchi, Kölle, Nosenzo and Quercia2017) find mixed evidence for framing effects in a small survey of the existing literature and find no difference between Fine and Bonus contracts in their real-effort experiment. Hence, because our design is closest to two studies that find evidence for contract framing, we formulate the following:
Hypothesis 4 Framing incentives as fine or bonus matters. Effort will be higher under Bonus contracts than under Fine contracts.
Finally, with incentive contracts, issues of incentive compatibility and whether the offered contract satisfies the agent’s participation constraint arise. We expect that agents will reject contracts that violate the participation constraint. Regarding our second main question, because incentive contracts appeal to agents’ self-interest, we expect that incentive contracts diminish (‘crowd out’) voluntary cooperation both when they are incentive compatible and when they are not (in which case they are incentive equivalent to Trust contracts; see, e.g., Fehr & Gächter, Reference Fehr and Gächter2002). In other words, we expect separability to fail. We thus have formulated the following hypothesis:
Hypothesis 5 Under Stranger matching, contracts that do not satisfy the participation constraint are rejected (Hypothesis 5a). Accepted incentive contracts induce an effort level that is at least as large as the theoretical best-reply effort implied by selfish rationality (Hypothesis 5b) but lower voluntary cooperation (the difference between effort and best-reply effort) than in Trust contracts (Hypothesis 5c). We also predict that NIC contracts – which are incentive equivalent to Trust contracts – perform worse than incentive-compatible contracts and comparable Trust contracts (Hypothesis 5d).
Because real-world relationships are often ongoing with the same partners, we study all issues raised above in a Stranger versus Partner comparison. Based on (i) the theoretical argument that strategic incentives in the form of sequential reciprocity available in Partner but not in Stranger should increase cooperation in Partner cooperated to Stranger, and (ii) evidence consistent with (i) (Falk et al., Reference Falk, Gächter and Kovacs1999; Gächter & Falk, Reference Gächter and Falk2002), we predict:
Hypothesis 6 Partner matching induces higher effort than Stranger matching.
In the data analyses we elaborate further on these hypotheses and specify the subsets of data we use to study them.
5. Results
This results section is structured as follows. Before we investigate our hypotheses (see Section 4), we start by providing an overview of mean statistics of wages, bonus and fine, desired and actual effort, and profits across the three main contract types of Trust, Fine, and Bonus contracts, as well as the two matching protocols Strangers and Partners, followed by an initial analysis of the main treatment outcomes in terms of average effort levels (Section 5.1). Section 5.2 investigates the behavioral mechanisms behind effort after experiencing Fine or Bonus contracts, and Section 5.3 studies determinants of effort choice under Fine and Bonus contracts, distinguishing whether the contracts are incentive compatible or not. Section 5.4 provides a comparison of treatments in terms of predicted effort choices.
5.1. A descriptive overview
5.1.1 Mean statistics by contract type and matching condition
Table 3 shows mean statistics for all experimental decisions taken by principals and agents, as well as the resulting profits for each type of contract and each matching condition. At this stage, we do not distinguish between phases. The purpose is to provide an overview of how the main treatment conditions affect the main decision variables in our experiment.
Mean statistics by contract type and matching condition
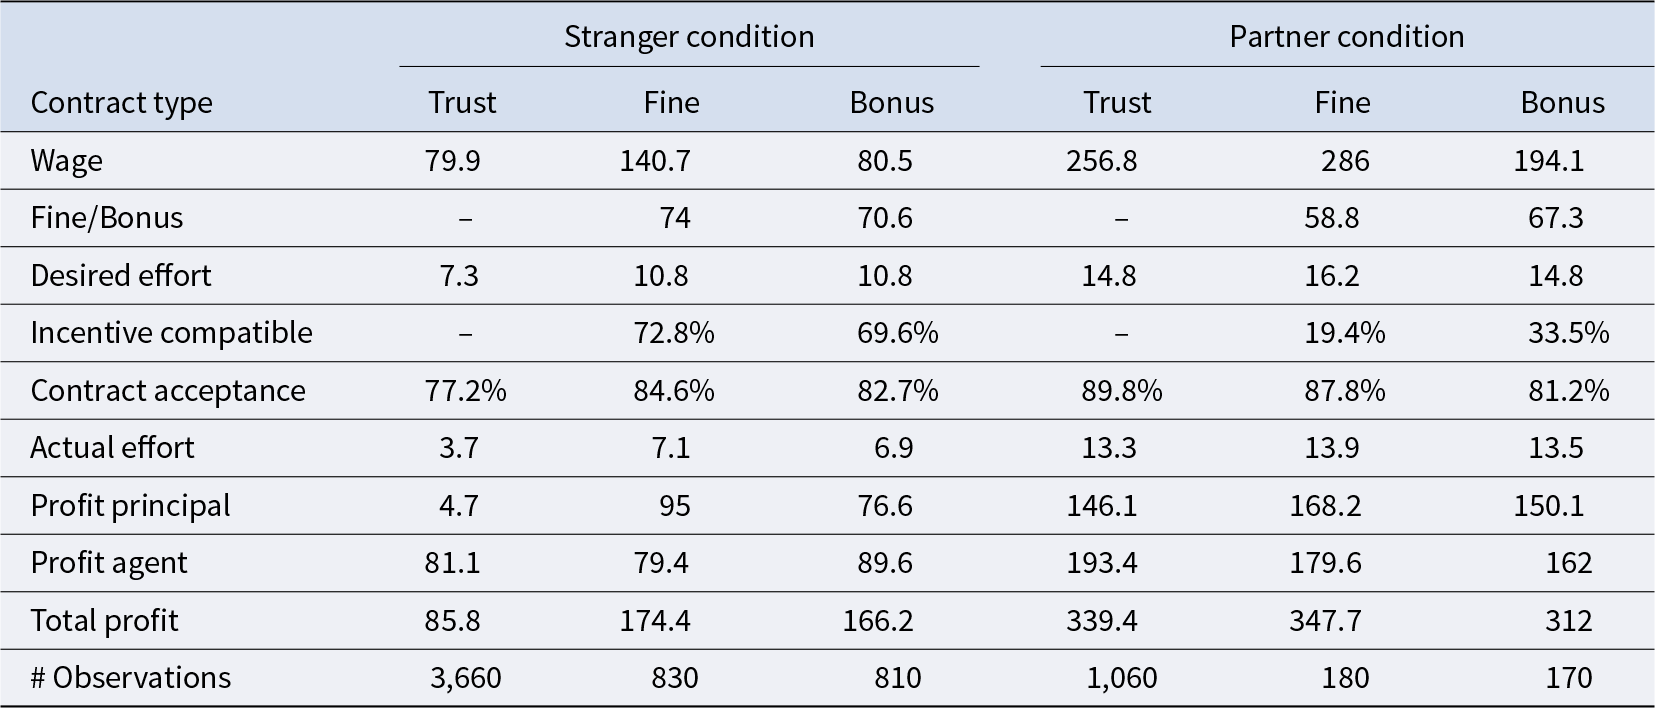
The data used here are all experimental decisions under the respective contract type (Trust, Fine, Bonus), separately displayed by matching protocol (Stranger, Partner).
Table 3 documents that wage, desired effort, actual effort, and profits are substantially higher under Partner rather than Stranger matching. Contract acceptance is 81.2% across conditions. Mean fine and bonus are 74 and 70.6 under Stranger conditions (and the rate of incentive-compatible contracts is 72.8% and 69.6%, respectively), indicating that if incentives are available, most principals choose high-powered incentives (recall that maximum incentives are 80). Furthermore, the mean fines and bonuses are smaller under Partner matching (means are 58.8 and 67.3), the rate of incentive-compatible contracts is much lower than in Stranger matching (19.4% and 33.5%), and the desired effort is above 14 in all Partner conditions. These facts reflect that explicit incentives are less important in repeated games than in one-shot games. Wages are higher for Fine contracts than Bonus contracts to compensate for the fact that a fine reduces payment while a bonus increases it. In Stranger, the effort is higher under Fine and Bonus contracts than under Trust contracting.
The relative increase of effort in incentive contracts is larger in Stranger than Partner, which suggests that explicit incentives are especially effective in short-term relationships. As expected, effort levels are substantially higher in Partner than Stranger. Interestingly, the profit share captured by principals is particularly low in Stranger Trust: It is only 5.5% (= 4.7/85.8), whereas the profit share of principals is 43% under Partner Trust and even higher with incentive contracts (Stranger and Partner). Thus, our gift-exchange games set a particularly hard task for the principal to achieve beneficial cooperation under Stranger conditions.
5.1.2 Effort by treatments and phases
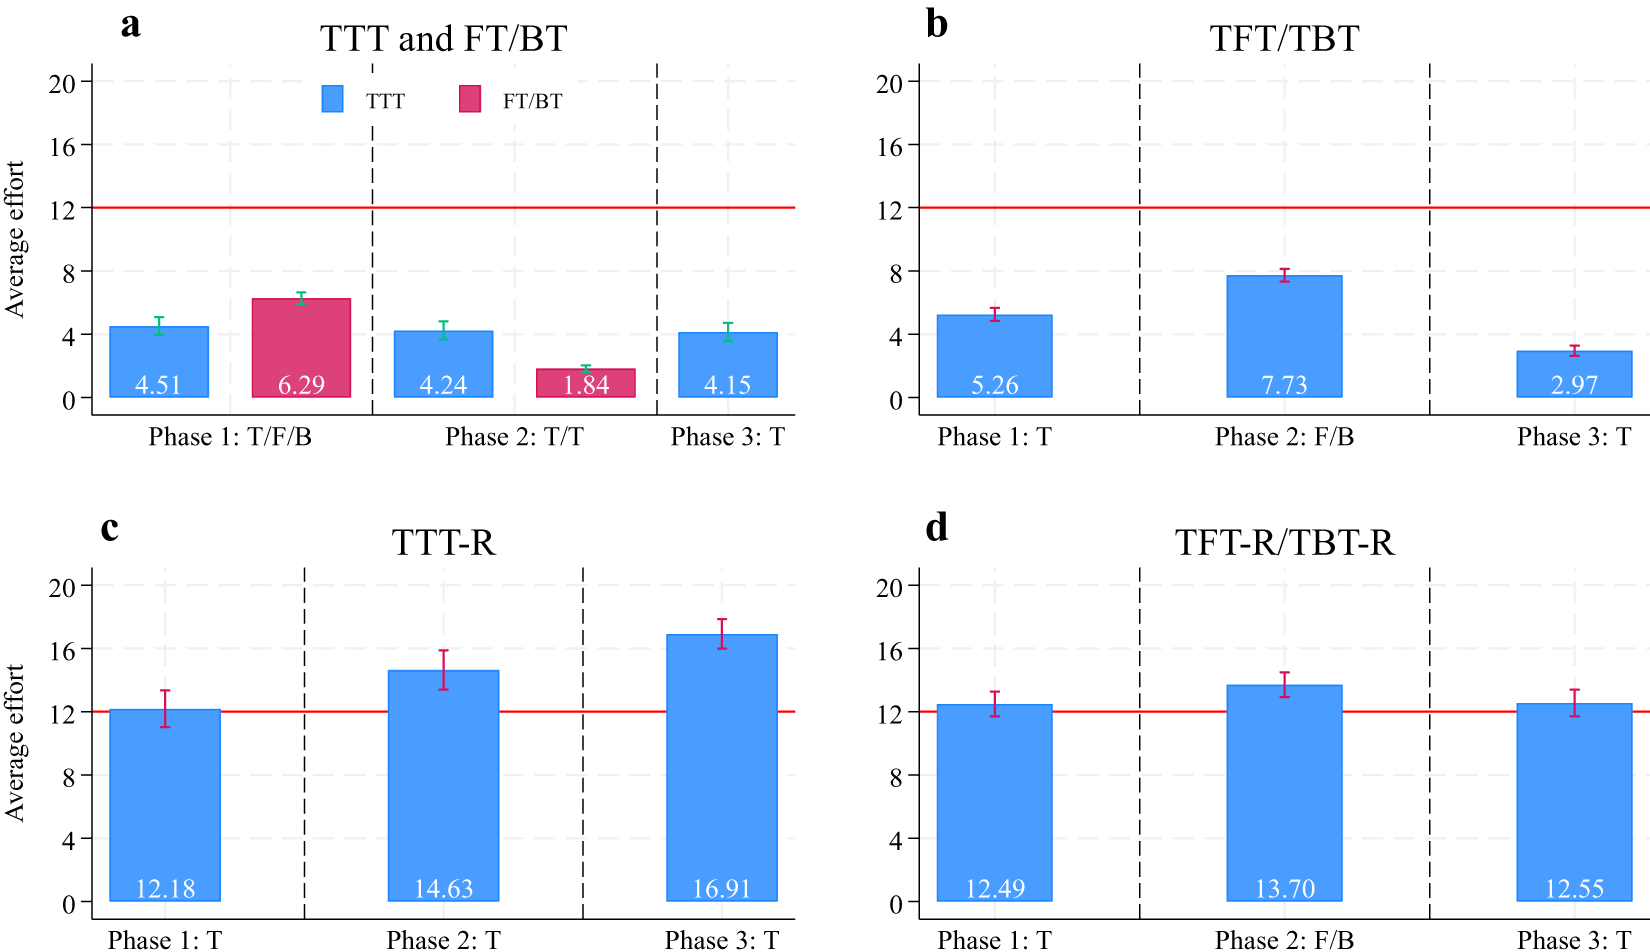
Figure 1 displays the mean effort levels of accepted contracts for each phase and main treatment. It serves to provide initial insights regarding our research questions, as outlined in Table 2. In Sections 5.2 and 5.3, we report detailed statistical tests in terms of the behavioral mechanisms that have produced the results documented in Fig. 1. As we will see, from the agents’ perspective, the behavioral mechanisms are positive reciprocity in the form of higher effort for higher wages, negative reciprocity in the form of choosing minimal effort (and rejecting contracts), and reacting to explicit and implicit incentives. For the principal, the main behavioral mechanism is the design of the offered compensation (OC) package.
Average effort across main experimental conditions. Panels a and b are the results of one-shot (‘Stranger’) matching and panels c and d of finitely repeated (‘Partner’) matching (indicated by the suffix -R). The horizontal line at effort equaling 12 indicates the benchmark of the theoretically maximal effort implementable by incentive contracts. the numbers in the bars are average effort levels. error bars are 95% confidence intervals. see Online Appendix Figure B1 for the average effort by period and type of incentive (Fine or Bonus contract)
In this subsection, we focus on effort levels and how they change across the various treatments. Here, we only report simple tests of whether changes in effort levels are significant (all are based on robust ordinary least squares (OLS) regressions clustered on independent matching groups of effort on relevant phase and treatment dummies); we will present more detailed regressions related to behavioral mechanisms in Sections 5.2 and 5.3.
Panels a and b of Fig. 1 depict the results from the Strangers conditions and panels c and d from the Partner conditions (indicated by the suffix -R). For the purposes of this overview, we pool the Fine and Bonus conditions because effort levels are not significantly different from each other in any condition (Table B1 in the Online Appendix, all p > .202).
Figure 1a reveals that average effort levels in the benchmark TTT condition are around 4.3, with a slight (but insignificant, p > .678) decline from 4.51 in phase 1 to 4.13 in phase 3. Incentives (available in phase 1 of conditions FT/BT) increase effort levels to 6.29, but this increase of 1.77 is rather modest and far off the theoretically predicted effort level of 12 (indicated by the horizontal lines in Fig. 1). Average effort in phase 2 of FT/BT, where no incentives are available any longer, is 1.84 whereas in phase 2 of TTT, average effort is 4.24. This decrease of 2.4 is significant (p = .009) and, as we will show in detail in Section 5.2, evidence for a crowding-out effect after experiencing incentive contracts.
In the conditions of TFT/TBT, illustrated in Fig. 1b, incentives are introduced in phase 2 after participants had the experience of Trust contracts in phase 1. Incentive contracts in phase 2 of TFT/TBT increase effort significantly after experiencing Trust contracts in phase 1 (from 5.26 in phase 1 to 7.73 in phase 2, p = .000). The average phase 2 effort of 7.73 in TFT/TBT is also significantly higher (p = .000) than the average effort of 6.29 in phase 1 of FT/BT – that is, without the prior experience of Trust contracts.Footnote 6 In phase 3 of TFT/TBT, the average effort is 2.98, which is lower than in phase 1 and phase 2. To gauge the change in effort that might be due to crowding out of effort after having experienced Trust and Fine/Bonus contracts, we compare the average effort in phase 3 of TFT/TBT (2.98) with the average effort in phase 3 of TTT (4.15): The average drop in effort is − 1.18. Compared to the effort reduction of 2.31 in the FT/BT experiments, the drop in effort is reduced almost by half and is insignificant (p = .200).
Figures 1c and 1d illustrate the power of implicit (that is, strategic) incentives in the form of sequential reciprocity, available in the repeated games of the Partner conditions TTT-R (panel c) and TFT-R, TBT-R (panel d), to significantly (p = .000) increase effort levels compared to the Stranger conditions (panels a and b). This result is consistent with previous evidence that shows the cooperation-enhancing effect of implicit (strategic) incentives available in repeated games compared to one-shot games where strategic incentives are absent (e.g., Falk et al., Reference Falk, Gächter and Kovacs1999; Gächter & Falk, Reference Gächter and Falk2002). Unlike in the Stranger conditions, effort levels exceed 12 in all phases and treatments of the Partner conditions. In contrast to TTT, in TTT-R, effort significantly increases across the three phases of TTT-R (p < .015 for phase 2-and phase-3 dummies).
The introduction of Fine or Bonus contracts in phase 2 of TFT-R/TBT-R (panel d) increases effort only insignificantly compared to phase 1 (p = .103), and effort in phase 3 of TFT-R/TBT-R is the same as effort in phase 1 (p = .925). Comparing effort in phase 3 of panel d (average effort of 12.55) with effort in phase 3 of panel c (average effort of 16.91) suggests a strong (and highly significant, p = .001) possible crowding-out effect in terms of foregone implicit cooperation of 4.36 after having experienced incentive contracts in phase 2.
In summary, regarding effort choices, this overview suggests three important results, which we aim to explain in terms of behavioral mechanisms in the remainder of this paper:
1. The experience of incentive contracts reduces effort in subsequent Trust contracts compared to the relevant experience with Trust contracts only. This drop in effort exists in FT/BT, TFT/TBT and TFT-R/TBT-R, but its effect size varies across settings.
2. Implicit incentives, available only under Partner matching, strongly increase effort compared to Stranger conditions.
3. Compared to Trust contracts, explicit incentives in the form of Fine or Bonus contracts increase effort under Stranger conditions but far less than theoretically predicted. In the presence of implicit incentives in the Partner conditions, explicit incentives do not increase effort compared to Trust contracts.
In the Section 5.2, we examine the details of the behavioral mechanisms behind these results. Two important mechanisms, shown in previous research on gift-exchange experiments, are trust and positive reciprocity: Principals offer wages above Nash-equilibrium wages (under money maximization; see Section 2), and agents respond with effort levels that increase in the wage offered (‘gift exchange’ e.g., Fehr et al., Reference Fehr, Kirchsteiger and Riedl1993, Reference Fehr, Gächter and Kirchsteiger1997; Hannan, Kagel & Moser, Reference Hannan, Kagel and Moser2002; see also Cooper & Kagel, Reference Cooper, Kagel, Kagel and Roth2016). Agents may also be motivated by negative reciprocity – that is, a willingness to punish principals if the OC is unfavorable for the agent (see Fehr & Gächter, Reference Fehr and Gächter2000) and also the large literature on rejections of unfair offers in ultimatum games (e.g., Güth & Kocher, Reference Güth and Kocher2014; Lin et al., Reference Lin, Brown, Imai, Wang, Wang and Camerer2020). Negative reciprocity may result in rejecting the contract or in choosing minimal effort after the contract has been accepted. We expect the mechanisms of trust and positive and negative reciprocity to be operative in our experiments as well. We focus on accepted contracts (1,265 out of 6,710 = 81.2% across all experiments) and study trust and positive and negative reciprocity in them.Footnote 7
5.2. Effort under trust contracts after experiencing incentive contracts
5.2.1. Trust by principals and agents’ reciprocal reward
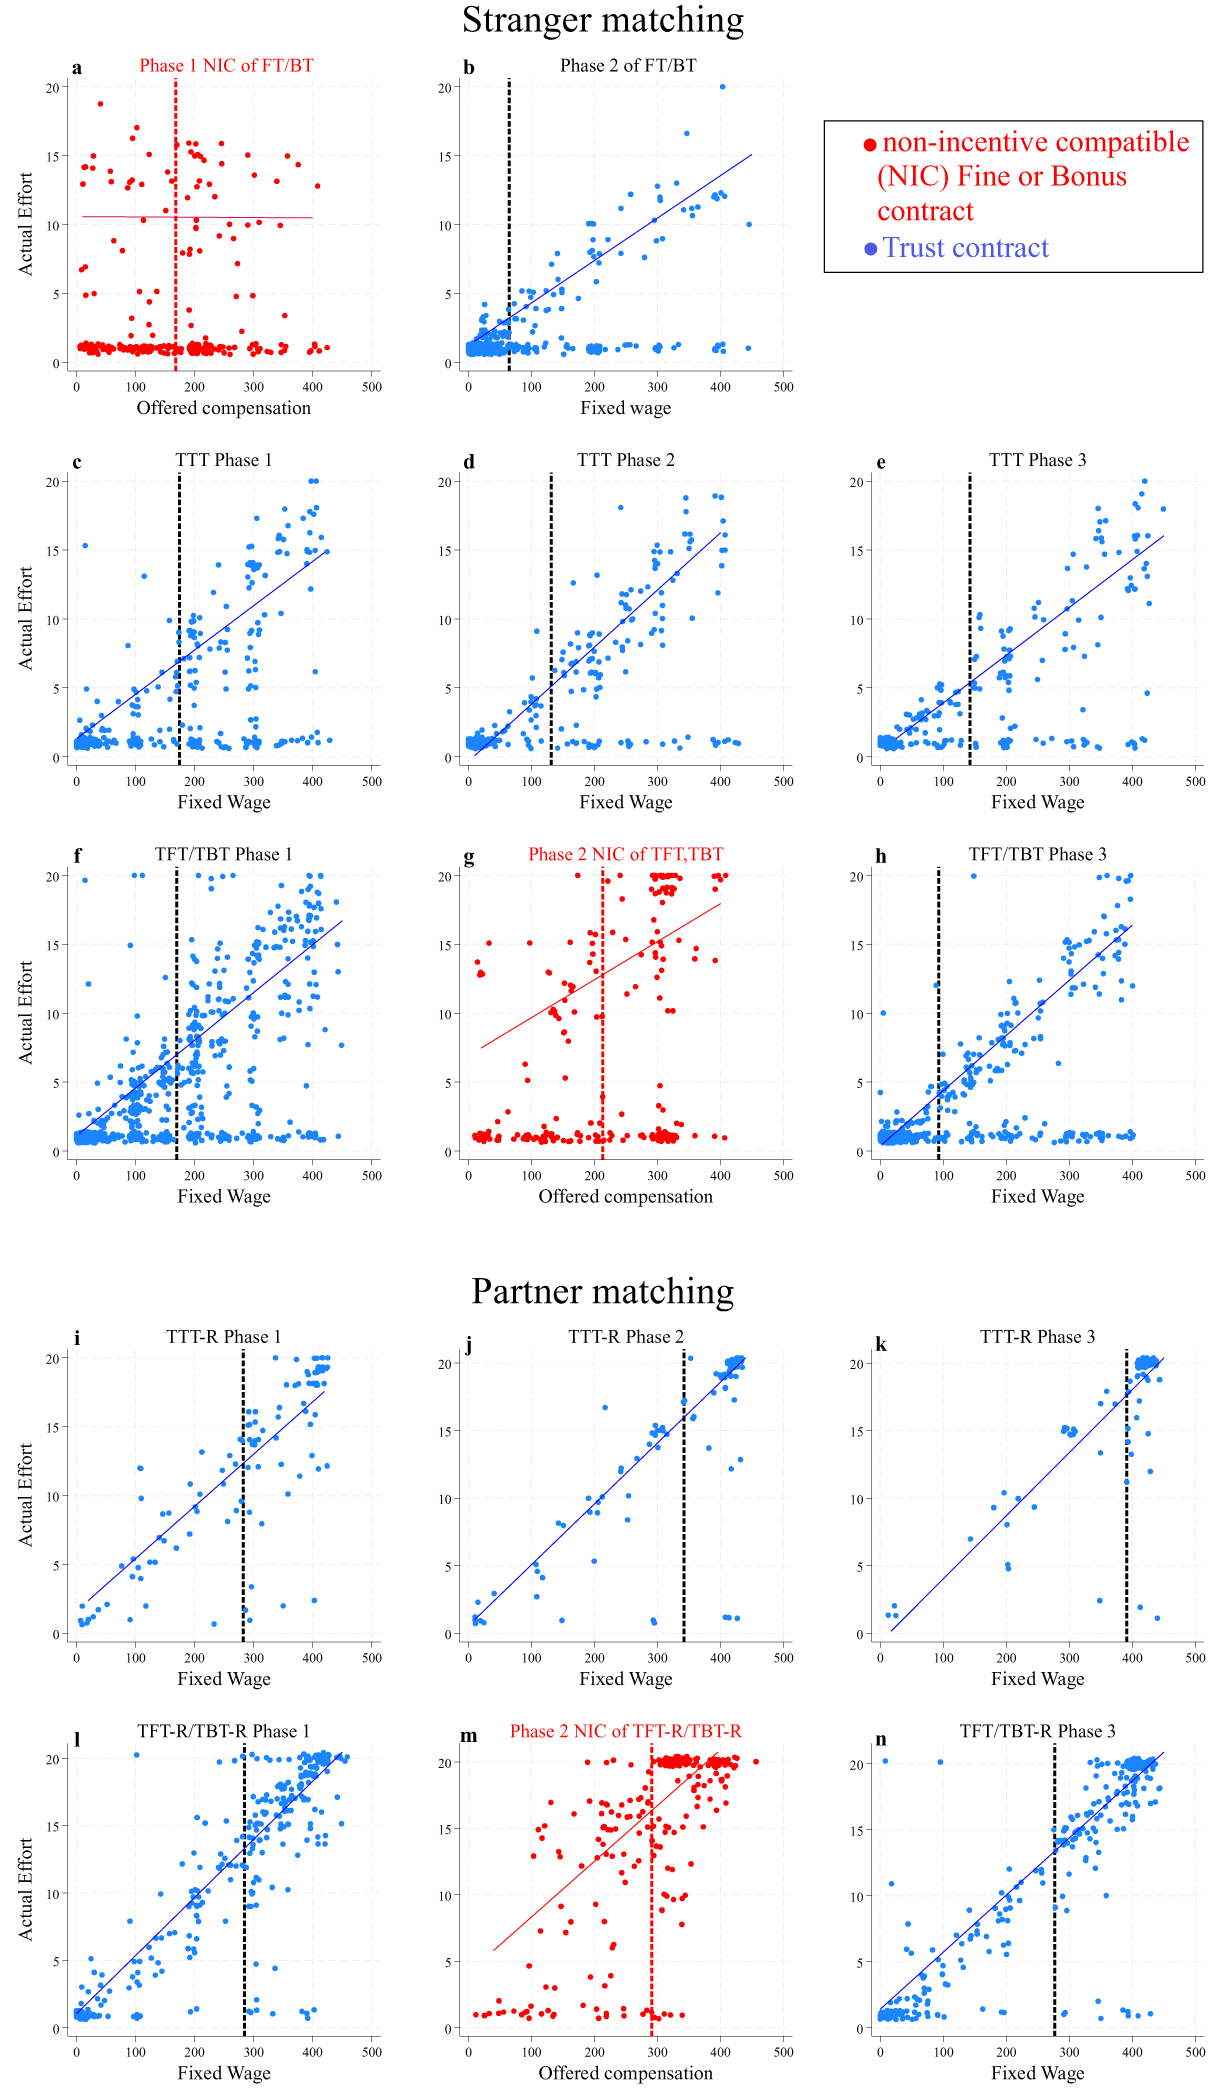
In this subsection, we first provide graphical evidence of how the various treatments affect effort levels as a function of offered wages (Fig. 2; shown are all individual wage–effort pairs of accepted contracts), followed by regression analyses that quantify the treatment effects (Table 4). Figure 2 provides (jittered) scatterplots of individual effort choice against OC (resp. fixed wage) for each phase of the Stranger matching experiments of FT/BT (panels a and b), TTT (panels c to e), and TFT/TBT (panels f to h). The lower set of panels shows the experiments in Partner matching of TTT-R (panels i to k) and TFT-R/TBT-R (panels l to n). Panels a, g, and m (colored in red) show the relationship between OC and effort under Fine or Bonus contracts for NIC contracts, which are incentive-equivalent to the Trust contracts shown in the other panels (in blue). We discuss them in Section 5.3; here we focus on the Trust contracts displayed in the blue-colored panels. The vertical dotted lines are the average wages offered in the respective treatment.
The wage–effort relationships in Strangers and Partners and across phases. Panels a to h illustrate the Stranger matching experiments and panels i to n illustrate the Partner experiments. Dots (jittered) are all individual wage–effort pairs of accepted contracts (up to ten per pair). Phase 1 of FT/BT (panel a), phase 2 of TFT/TBT (panel g), and phase 2 of TFT-R/TBT-R (panel m) show effort under NIC Fine/Bonus contracts that are incentive equivalent to the trust contracts of the respective matching protocol. We discuss these results in Section 5.3. dashed vertical lines are the average accepted wages in a phase and treatment. Solid lines are simple linear regressions of effort > 1 on wage (OC) for the respective phase and treatment. A breakdown of Figure 2 by contract type and accompanying regressions are in Online Appendix B, Figure B2.
Regression analysis to explain effort choices after the experience of incentive contracts

The compared phases of respective Trust contracts are in bold. In all regressions, the dataset comprises all accepted Trust contracts. All estimations include dummies for periods 1–3 and periods 8–10 to control for (noisy) initial and end behavior; the omitted benchmark category is the central periods 4–7. The full estimation results are in Online Appendix B, Table B3. Table 4.1: The dependent variable is coded as 1 if minimal effort (i.e., effort = 1) is chosen and as 0 otherwise. Table 4.2: Regressions are conditional on effort > 1. Table 4.3: The dependent variable is the offered (and accepted) wage. In Tables 4.1 and 4.2, wage is measured in units of 100. Treatment is a dummy variable that changes between models (but is the same in the column): Models a: FT/BT = 1; Models b: TFT/TBT = 1; Models c: FT/BT = 1; Models d: TFT-R/TBT-R = 1. All regressions are robust and clustered on independent matching groups.
*** p < .01; ** p < .05; * p < .1.
To varying degrees, the panels of Fig. 2 display three clusters. Cluster (i) shows a positive correlation between effort and fixed wage, indicated by a positively sloped OLS regression line conditional on effort greater than one. This cluster indicates that a substantial fraction of effort choices can be interpreted as reciprocal reward: Agents voluntarily cooperate and respond to higher fixed wage offers by higher effort.
A second cluster, comprised of effort equal to 1, exhibits minimal effort for all levels of fixed wage greater than 35. This either represents selfish exploitation by the agent or reciprocal punishment for a low offered wage. It implies that the agent earns a positive fixed wage at no cost, whereas the principal earns a negative payoff if wage is greater than 35.
A third cluster consists of wages less than 35 and effort equal to 1. Choosing a minimal effort when the offered wage is low can be due to reciprocity or selfishness of the agent. However, it also indicates that the principal shows little trust in these cases.
The three clusters are most pronounced under the Strangers matching protocol (upper set of panels a to h). Under Partner matching (lower set of panels i to n), where implicit incentives (sequential reciprocity across rounds) are available, the clusters (effort ≈ 1, wages > 35) and (effort ≈ 1, wages < 35) become thinner, and a new cluster of wages around 400 and efforts between 18 and 20 appears.
Before we turn to a detailed econometric analysis of our results, we point out a couple of noteworthy features of the data shown in Fig. 2. First, the clusters of effort greater than one have remarkably similar slopes across the phases with Trust contracts, which implies that learning does not diminish the reciprocal wage–effort relationship. To our knowledge, this stability is a novel result because most previous gift-exchange experiments were only run for up to ten periods. Second, comparing the upper set of panels with the lower set of panels (i.e., Strangers with Partners) illustrates the power of implicit incentives to increase wages and effort levels.
In this section, we employ robust regression analyses (clustered on independent matching groups) to answer our main research question: How are trust and reciprocal effort choice under Trust contracts affected after the experience of Fine or Bonus incentive contracts? We separate out treatment effects by comparing effort under Trust contracts after participants experienced Fine or Bonus contracts with effort under Trust contracts where the prior experience is with Trust contracts. We make this comparison for three dependent variables (Table 4): We analyze the frequency of minimal effort choices (Table 4.1), effort conditional on above-minimal effort (Table 4.2), and the principals’ fixed wage choices (Table 4.3). All three effects together are responsible for the overall change of mean effort between treatments (see Fig. 1), and they correspond to our discussion of psychological mechanisms in the hypothesis section above.
For each of the three dependent variables (Tables 4.1 to 4.3), we report four treatment comparisons in the four columns of Table 4 (models a to d): We compare phase 2 of FT/BT with phase 2 of TTT, phase 3 of TFT/TBT with phase 3 of TTT, phase 2 of FT/BT with phase 3 of TFT/TBT, and phase 3 of TFT-R/TBT-R with phase 3 of TTT-R. These four comparisons (indicated by bolded letters) correspond to Hypotheses 1a to 1d, which predict that experiencing incentive contracts crowds out voluntary cooperation (that is, reduces effort) under subsequent Trust contracts compared to how effort has evolved under Trust contracts in phase 2 or in phase 3 of the respective experiments. Each model has two main explanatory variables: Wage (measured in units of 100 to display coefficients with fewer decimals) and Treatment (where Treatment is a dummy that corresponds to one of the comparison treatments depending on the model, as indicated in the top row of Table 4). We also control for initial and end-period effects (dummies for periods 1 to 3 and 8 to 10) that potentially may have influenced effort choices differently across rounds (see Fig. B1 in the Online Appendix). Because there are no systematic period effects and to keep the exposition simple, we only report the main variables here and relegate the full estimation results to Online Appendix B (Table B3).
Table 4.1 shows Probit regressions for the frequency of minimal effort (coded as 1) or above-minimal effort (coded as 0). The estimated coefficient of Treatment is positive and significant for model 1a – that is, the probability of agents choosing minimal effort is higher in phase 2 of FT/BT than in phase 2 of TTT. The size and significance of this effect (models 1b and 1c) is reduced in TFT/TBT, where agents have experience with Trust contracts from phase 1 before being exposed to incentive contracts in phase 2. In the Partner matching protocol, the comparison of phase 3 of TFT/TBT-R with phase 3 of TTT-R shows that the coefficient of Treatment is high but noisy and insignificant, which is likely due to very few observations at effort equal to 1 (see Fig. 2, panels k and n).
The estimated coefficient of Wage is negative and highly significant in all models – that is, the probability of an agent choosing minimal effort decreases in wage. This supports the interpretation of minimal effort as reciprocal punishment for low-wage offers (Hypothesis 2b) and rejects the interpretation of minimal effort as selfish rationality, according to which agents choose minimal effort independent of wage – namely, the wage coefficient should be insignificant.
Table 4.2 shows OLS regressions of effort conditional on above-minimal effort (effort > 1) on Wage and Treatment. The model structure is the same as in Table 4.1. Consistent with reciprocal gift exchange, Wage has a positive and highly significant influence across all models 2a to 2d. For instance, the coefficient 3.449 in model 2a means that increasing wage by 100 units increases effort by 3.449 units. This supports Hypothesis 2a, which predicts a positive wage–effort relationship.
Treatment plays a minor role here. The only significant effect (at p < .05) of Treatment is an increase of effort in phase 3 of TFT/TBT compared to phase 3 of TTT (model 2b); in model 2d (phase 3 of TFT-R/TBT-R compared to phase 3 of TTT-R), the effect of Treatment is marginally significant (p = .083). However, as we will show in Section 5.4, this is overcompensated by the countervailing effects of a higher probability of minimal effort and reduced trust. We conclude that, for a substantial fraction of participants who choose above-minimal effort (e > 1), a positive wage–effort relationship is intact even after experiencing incentives in the previous phase.Footnote 8
Finally, we investigate whether the level of trust shown by the principal as expressed by their wage offer is lower after experiencing agents’ behavior under incentive contracts. Visual inspection of Fig. 2 suggests that average wages (indicated by the dashed lines) in the Trust phase after Fine/Bonus contracting are lower than after the respective phase of Trust contracting in TTT or TTT-R (compare Fig. 2b with 2d, Fig. 2h with 2e, and Fig. 2n with 2k). To assess the treatment-specific size of reduced wage offers, Table 4.3 shows OLS regressions of fixed wage based on Treatment (analogous to Tables 4.1 and 4.2). All estimated coefficients of Treatment are negative (and significant in models 3a and 3d), which implies that principals are more cautious (less trusting) in their wage offers after experiencing their agents’ effort behavior under Fine/Bonus contracts compared to Trust contracts in the previous phase.
Although our focus is mostly on agents’ effort choice as a function of the contract they receive, it is worth noticing that the offered contracts may also react to the agents’ previous effort choices. In a regression analysis that complements the results of Table 4.3, we find that average wage offers in a phase after incentives (that is, in phase 2 of FT/BT, phase 3 of TFT/TBT, and phase 3 of TFT-R/TBT-R) are higher the higher average effort was in the preceding phase. This increase per unit of effort is weak and insignificant in FT/BT (6.9 per unit, p = .180) but substantial and significant in TFT/TBT (12.7 per unit, p = .019) and in particular in TFT-R/TBT-R (19.9 per unit, p = .000). Average wage offers also react positively and significantly to average effort choices in preceding phases in the TTT experiments (offered wages increased on average by 21.3 per effort unit in both phase 2 and phase 3 as a reaction to phase 1 (phase 2). In TTT-R, the offered wage in phase 2 also increased by 21.3 per unit of effort in phase 1, but in phase 3 the average wage only increased by 4.9 per unit of effort (p = .081). This is likely due to a ceiling effect because wages and effort are already very high in phase 2 (see Fig. 1c and Fig. 2i, j, k). In sum, trust by principals is also a reaction to the principals’ experience with agents’ trustworthiness as revealed by their effort choices.
Taken together, these detailed analyses support the impressions from Fig. 1: Prior experience of incentive contracting reduces mean effort under Trust contracting (Hypothesis 1). This ‘crowding-out effect’ is mainly driven by two behavioral responses: A reduction in the level of trust by the principal as expressed by lower wage offers (which are a reaction to the received effort choices) and an increased probability of minimal effort by the agent conditional on wage (more frequent reciprocal punishment of a low wage offer). Interestingly, there remains a substantial fraction of effort choices in line with a positive wage–effort correlation (effort as a reciprocal reward) that is also similar between phase 1 and phase 3 of TFT/TBT and TFT-R/TBT-R, respectively (compare Fig. 2 panels f and h, and l and n).
5.3. Effort under fine and bonus contracts
5.3.1 Overview of effort under fine and bonus contracts
We have seen in Fig. 1 that explicit monetary incentives increase mean effort with Stranger matching but not with Partner matching, where implicit incentives in the form of strategic sequential reciprocity across rounds are feasible. We will now examine these and other questions regarding the effectiveness of incentive contracts in detail.
Figure 3 illustrates the behavior of agents under explicit monetary incentives. Across all experiments with accepted incentive contracts, 59.2% (988 out of 1,668 contracts) are incentive compatible and 40.8% are not incentive compatible. Figure 3 displays scatterplots of observed effort choices against the theoretical best-reply effort e* (assuming rational money maximization). Figure 3 is remarkable because distributions are highly structured, and there is little noise. There are three clusters that correspond to different behavioral modes. The clustering looks much stronger than the one we described in Fig. 2, which was strong already. It provides some answers to our hypotheses even without statistical testing.
Actual effort and best-reply effort in phases with Fine/Bonus contracts. panel a: phase 1 of FT/BT (panel a), panel b: phase 2 of TFT/TBT, and panel c: phase 3 of TFT-R/TBT-R. The size of the dots is proportional to the number of underlying observations. Blue dots: effort choices if e* > 1; red dots: effort choices 1. The horizontal line at 12 indicates the maximally enforceable effort level under incentive-compatible contracts. see Figure B3 in the Online Appendix for a breakdown by contract type
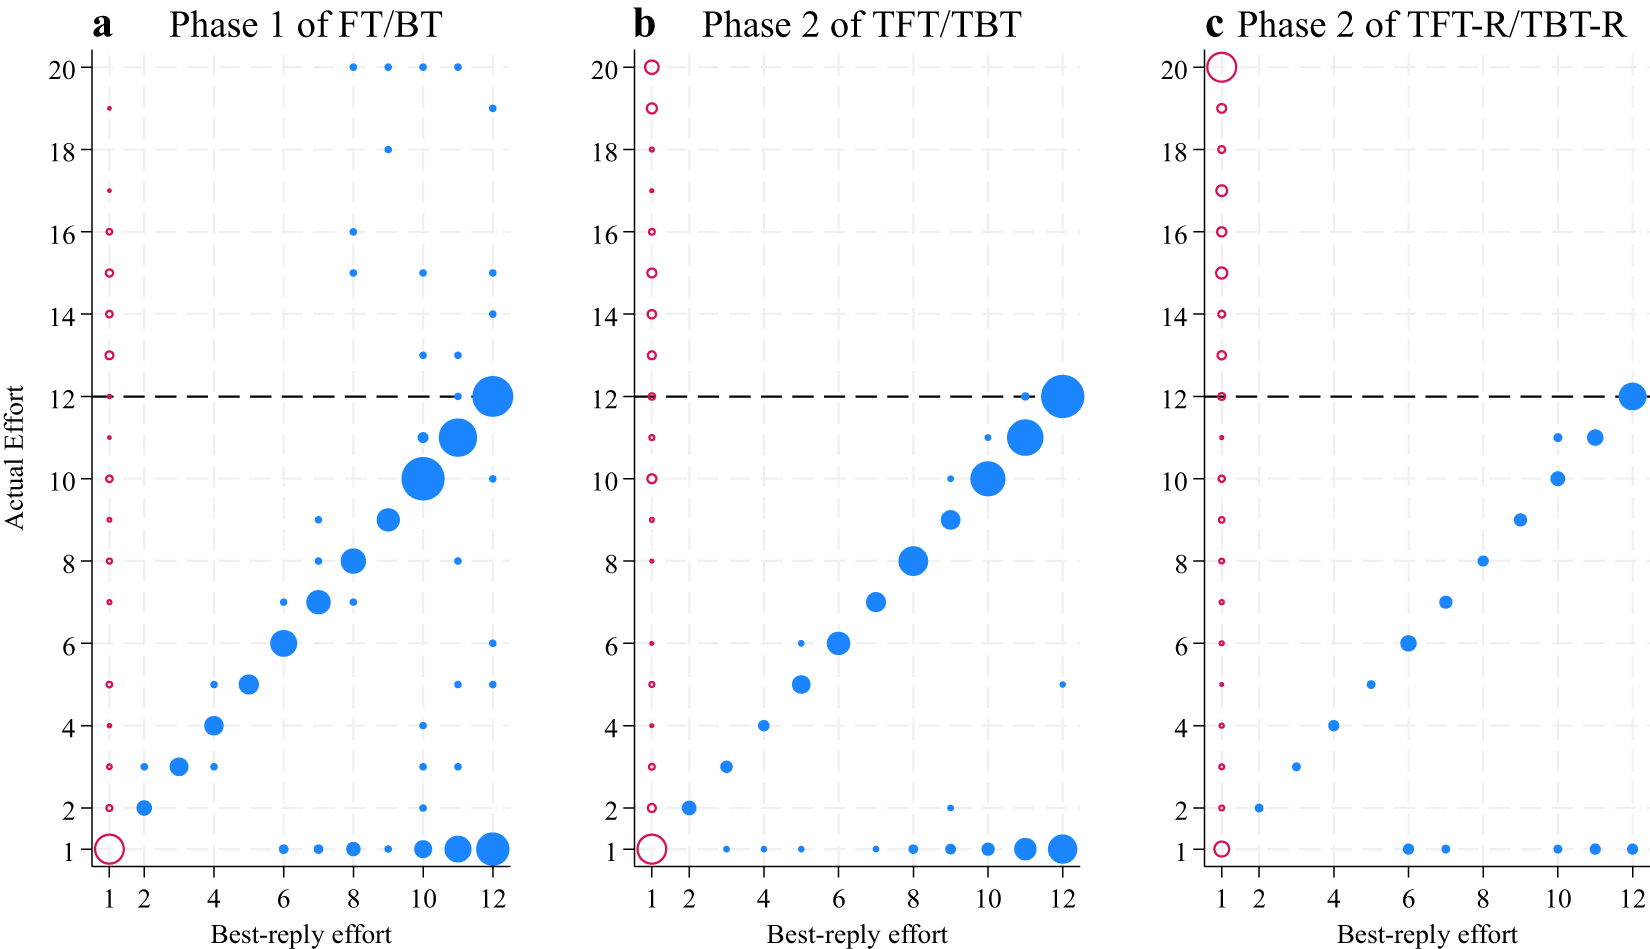
The first cluster – 746 out of 969, or 75.5%, of effort choices of accepted incentive-compatible contracts with e* is greater than 1 – are on the 45-degree line, that is, effort choices that are exactly equal to best-reply effort e* is greater than 1 (fractions are 72.5%, 80.3%, and 83% in panels a to c, respectively). This result is a conceptual replication of Anderhub et al. (Reference Anderhub, Gächter and Königstein2002) – who found that two-thirds of their agents chose best-reply effort – and clear evidence for Hypothesis 3 (higher incentives induce higher effort). If best-reply calls for effort greater than 1, there is (almost) no voluntary cooperation beyond the best-reply effort level at all. This fact supports Hypothesis 5c (reduction of voluntary cooperation under incentives) and is shown most clearly in panels b and c – that is, in phase 2 data.
In the second cluster, the best-reply effort is greater than 1, but in a substantial fraction of cases (182/969 = 18.8%), agents deviate to the minimal effort equal to 1 (fractions are 19.9%, 18.2%, and 15.1% in panels a to c, respectively). Across all three settings of Fig. 3, at the individual level, 47.7% of agents chose minimal effort at least once. Similar to our discussion of behavior under Trust contracts, this might be an expression of negative reciprocity due to the dissatisfaction of the agent with the OC.
The third cluster is the distribution at best-reply effort equal to 1 (242, 214, and 243 cases in panels a to c, respectively). A best-reply effort of 1 can occur for three reasons: First, either no fine or bonus has been specified (f = 0, b = 0; 8.3%, 2.8%, and 10.7% of cases in panels a to c, respectively), which implies that the principal has effectively designed the contract as a Trust contract.Footnote 9 Second, the contract specifies a positive fine or bonus (f > 0, b > 0), but the desired effort is set at 1 – that is, the principal does not ask for the maximal effort that is implementable under selfish rationality (suboptimal desired effort). Overall, this happened in only 19 out of 699 – that is, 2.7% of cases. Or third, a fine (bonus) has been specified (f > 0, b > 0), but the desired effort is set too large, so the contract is a NIC contract. The latter reason is the most frequent cause of best-reply effort equal to 1 (it comprises 91.7%, 97.2%, and 89.3% of all e* = 1 contracts in panels a to c, respectively), which leads to our separate analysis of NIC contracts below.
In Subsections 5.3.2 and 5.3.3, we analyze the three clusters identified here in more detail and provide statistical tests.
5.3.2 Effort under incentive-compatible contracts
Figure 3 is based on accepted Fine and Bonus contracts. With Stranger matching, these are 1,372 observations, of which 935 contracts (68.1%) are incentive compatible and 437 (31.9%) are not incentive compatible (as defined in Section 2.2, equation (1)). With Partner matching, there are 296 accepted contracts (53 incentive compatible (17.9%), 243 NIC (82.1%)).Footnote 10 The relative frequencies of incentive-compatible contracts of 68.1% in Stranger versus 17.9% in Partner indicate that short-run monetary incentives are more important under Strangers matching than Partner matching.
Most incentive-compatible contracts exhibit a fine or bonus of 80 (869/935 = 92.9% in Stranger, 45/53 = 84.9% in Partner). However, many of these contracts do not specify a desired effort of 12 but a smaller one. A desired effort of 12 has a relative frequency of only 27.6% (258/935) in Stranger and 35.9% (19/53) in Partner. That is, more than half of the contracts exhibit a suboptimal desired effort if one takes the perspective of money-maximizing rationality, according to which 12 is the maximally implementable effort with a fine or bonus of 80.
Table B5 in the Online Appendix reports, separately for Fine and Bonus conditions, the detailed distributions of best-reply effort, minimal effort and other effort choices.Footnote 11 Across treatments, between 69.2% and 89.7% of effort choices are best-reply choices. Between 10.3% and 23.8% are minimal (effort = 1) choices, and any other effort has a negligible frequency between 0% and 8.1%. The latter is clear support for Hypothesis 5c (no voluntary cooperation above best-reply effort if the contract is incentive compatible). Regarding the framing of monetary incentives (Fine vs. Bonus contracts, which are incentive equivalent), there is no systematic pattern. The relative frequency of best-reply choices is smaller in FT (69.2%) than in BT (76.9%) but larger in TFT (86.1%) than in TBT (74%).
To investigate these issues in more detail, Table 5 reports Probit and OLS regressions for different data subsets. In Table 5.1, we report Probit regressions that estimate the probability of minimal effort, and in Table 5.2 we document OLS regressions that estimate effort conditional on above-minimal effort choice. This partitioning of the data analyses follows from our identification of data clusters in Fig. 3 and is analogous to our analyses of Trust contracts. As explanatory variables, we use a treatment dummy (a dummy for either FT, TFT, or TFT-R, depending on the dataset; this dummy identifies the difference between Fine and Bonus contracts), best-reply effort (only in Table 5.2), and Offered Compensation (OC). For an incentive-compatible Fine contract, the OC is equal to a fixed wage, since the fine is not paid if the agent chooses the best-reply effort (which maximizes the agent’s payoff). For an incentive-compatible Bonus contract, OC is calculated as fixed wage plus bonus, since best-reply effort means that the bonus is received. If the contract is not incentive compatible, a money-maximizing agent should choose minimal effort under both Fine and Bonus contracts. Hence, NIC Fine or Bonus contracts render them incentive equivalent to Trust contracts (see also Section 2.2 for a detailed discussion).
Effort choice under incentive-compatible contracts

Bolded letters indicate the phase under consideration. Dataset: accepted and incentive-compatible Fine or Bonus contracts. All estimations include dummies for periods 1–3 and periods 8–10 to control for (noisy) initial and end behavior; the omitted benchmark category is the central periods 4–7. The full estimation results are in Online Appendix B, Table B4. In Table 5.1, the dependent variable is coded as 1 if minimal effort is chosen and coded as zero if effort > 1 is chosen. In Table 5.2, the dependent variable is effort > 1. Offered Compensation (OC) is measured in units of 100 and is wage under Fine contracts and wage + bonus under Bonus contracts. Treatment is a dummy for FT in models 1a and 2a, TFT in models 1b and 2b, and TFT-R in models 1c and 2c. The best-reply effort is calculated according to equation (1) in the main text (Section 2.2). Results are robust for controlling for initial and end-period effects, which are all insignificant at p < .05.
* p < .10; ** p < .05; *** p < .01.
Table 5.1 shows that all estimated coefficients of OC have the expected negative sign (higher OC reduces the probability of minimal effort). Under Stranger matching, the effect is marginally significant in the two-phase FT/BT experiments (two-tailed p = .093), insignificant in TFT/TBT (two-tailed p = .373), and also insignificant under the Partner matching of TFT-R/TBT-R (p = .879). The latter is intuitive: In a repeated game, it may be better not to immediately punish a low OC by choosing minimal effort.
The treatment dummies (dummies for FT, TFT, and TFT-R, respectively), which measure whether the framing of incentives (Fine vs. Bonus) matters, are insignificant in FT/BT and TFT-R/TBT-R (two-sided, both p > .263) but significantly negative in TFT/TBT (two-side p = .002), indicating that minimal effort choices under incentive-compatible contracts are less likely under Fine contracts than Bonus contracts. In sum, the influence of framing of incentives is ambiguous.
Regarding non-minimal effort choices (e > 1), which we analyze in Table 5.2, OC is insignificant in all three models (two-sided, all p > .243). This means that there is no positive reciprocity above e*, and this is not due to a ceiling effect. The variable Treatment is insignificant as well – that is, there are no framing effects (all p > .256). The only, and highly significant (p < .0001), regressor is the best-reply effort. The estimated coefficients are very close to 1. Judging by the displayed R2-values, best-reply effort explains very large fractions of variance (all R2 > .753), and this holds with Stranger and Partner matching. These regressions reflect the strong clustering at best-reply effort visible in Fig. 3.
From both analyses, Probit and OLS regressions, we conclude that, given an accepted and incentive-compatible Fine or Bonus contract, the agent either chooses best-reply effort or minimal effort, and there is very little noise. Incentives have a very strong influence on effort (confirming Hypothesis 3), and if agents choose an above-minimal effort level, they choose the best-reply effort almost perfectly (supporting Hypothesis 5b). This also means that it is clearly disadvantageous for the principal to specify a desired effort below the maximally implementable level. For instance, if the specified fine is 80 and the desired effort is 11 instead of 12, the effort provided (conditional on e > 1) will be about 11 instead of 12 – regardless of the size of the OC. Thus, by offering higher compensation, the principal cannot increase effort beyond the best-reply level (Hypothesis 5c). The influence of framing is ambiguous, which contradicts Hypothesis 4. There is some evidence of minimal effort as reciprocal punishment (Hypothesis 2b), but it is weaker than under Trust contracts.
5.3.3 Effort under NIC contracts
We now analyze the third cluster shown in Fig. 3 – that is, contracts that are accepted but are NIC. This cluster comprises 437 out of 1,372 observations (31.9%) in the Strangers treatments, of which 61.6% (269/437) exhibit maximal fine (bonus). In Partner treatments 244 out of 296 observations (82.1%) are NIC contracts, of which 56.2% (137/244) contain the maximum fine or bonus.
Recall from Section 2 that, in our setting, NIC incentive contracts are incentive-equivalent to Trust contracts. Thus, here we investigate to what extent NIC contracts impact on reciprocal gift exchange that we observe under all Trust contracts (see Fig. 2). Figure 2, panels a, g and m, illustrate the relationship of OC and effort that is behind the third cluster – that is the distribution of effort choices at best-reply effort equal to in Fig. 3. Under NIC contracts, OC amounts to wage less fine under Fine contracts and to wage under Bonus contracts because the agent has the incentive to choose minimal effort which triggers the specified fine or forfeits the bonus.
Comparing Fig. 2, panel a, which depicts NIC Fine/Bonus contracts, with panels g and m (representing NIC contracts in TFT/TBT and TFT-R/TBT-R, respectively) suggests two patterns. First, without experience of Trust contracting (as is the case in FT/BT), being exposed to incentive contracts, albeit NIC ones, leads agents to choose effort levels that are all over the place and are unrelated to OC. Second, the experience of Trust contracting in phase 1 of TFT/TBT and TFT-R/TBT-R returns a positive relationship between effort and OC. In the following, we investigate these patterns econometrically.
In Table 6, we estimate the probability of minimal effort by a Probit regression (Table 6.1) and effort conditional on effort greater than 1 by a Tobit regression (Table 6.2). Unlike our analysis of incentive-compatible contracts, we apply Tobit with an upper bound of 20 rather than OLS because Fig. 3 (and Fig. 2) reveal a high frequency of boundary choices at effort equal to 20 (in particular in TFT-R/TBT-R). As explanatory variables, both regressions use OC and a treatment dummy that measures the difference between Fine and Bonus contracts (dummy for FT in models 1a and 2a; TFT in models 1b and 2b; and TFT-R in models 1c and 2c). Like before, we include dummies for initial periods 1–3 and end periods 8–10. The full set of results is in Online Appendix B, Table B6.
Effort choice under NIC contracts
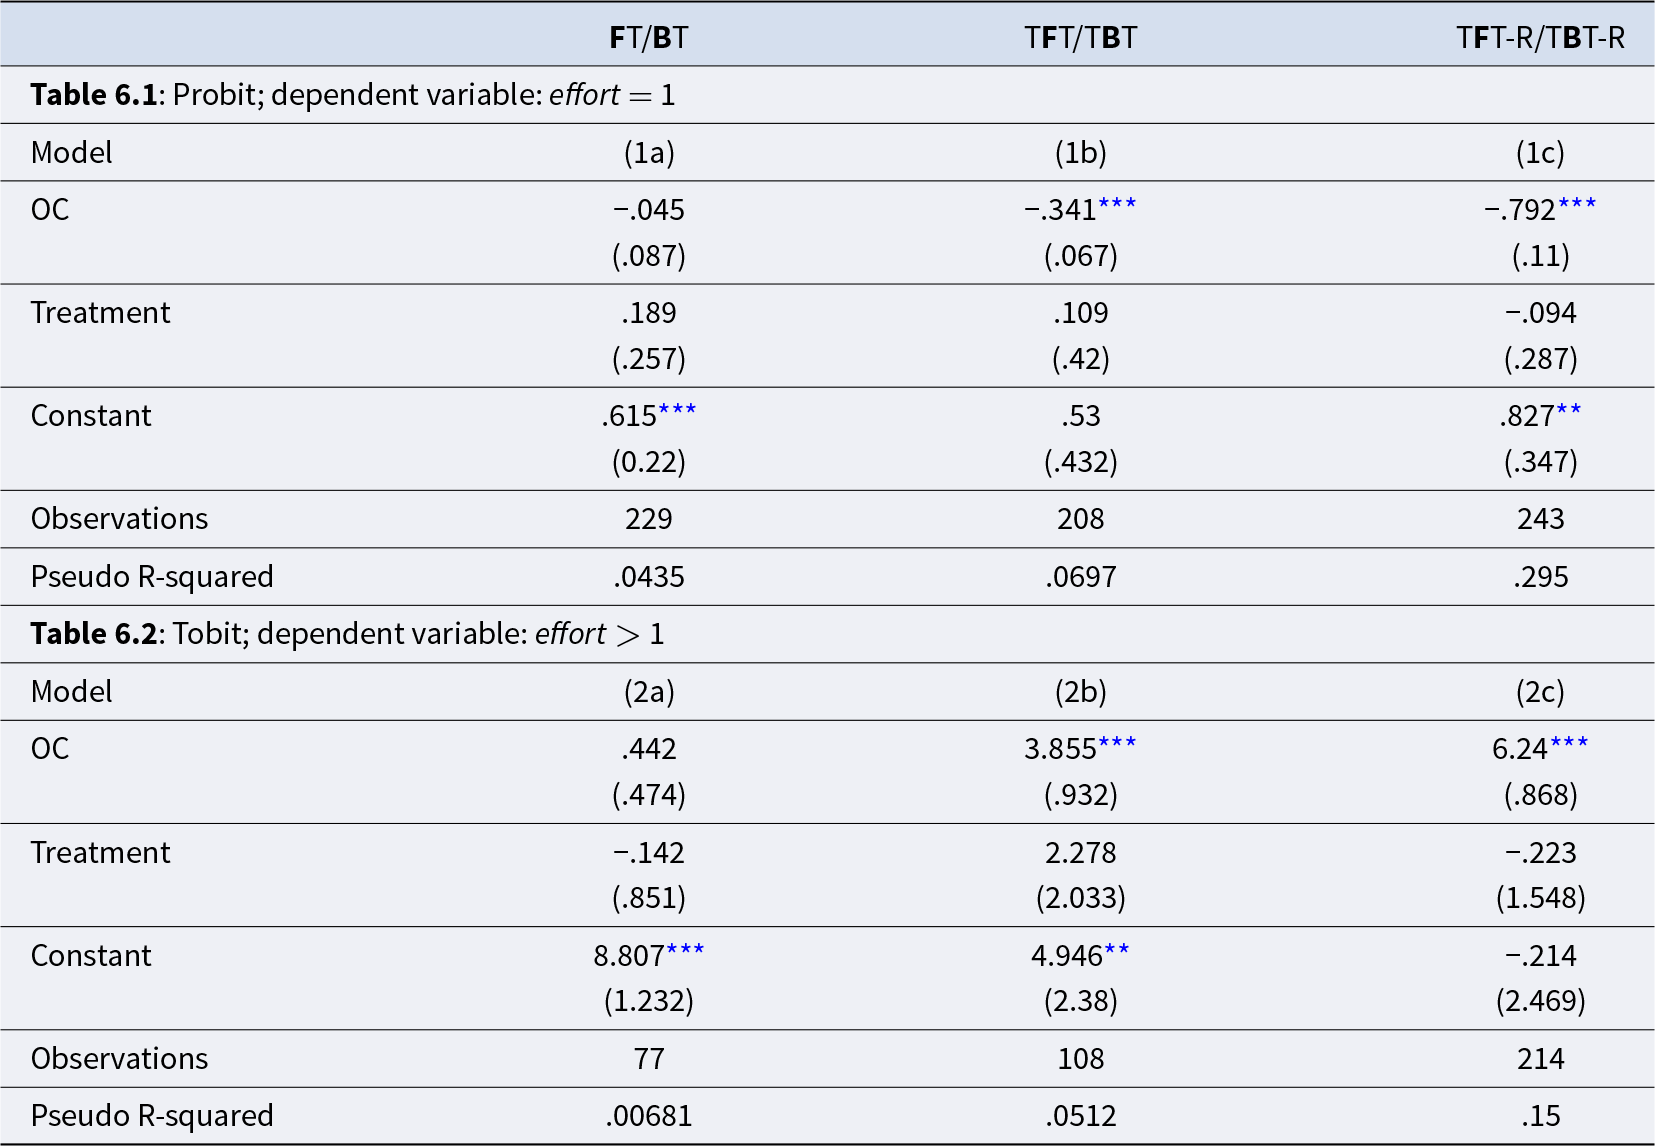
Bolded letters indicate the phase under consideration. The dataset is accepted and NIC Fine and Bonus contracts. All estimations include dummies for periods 1–3 and periods 8–10 to control for (noisy) initial and end behavior; the omitted benchmark category is the central periods 4–7. The full estimation results are in Online Appendix B, Table B6. The dependent variable in Table 6.1 is a dummy variable (1 if effort = 1, 0 otherwise) and in Table 6.2, effort > 1. Offered compensation (OC) is measured in units of 100. Treatment is a dummy for FT (in models 1a and 2a), for TFT (in models 1b and 2b), and for TFT-R (in models 1c and 2c). Standard errors (in parentheses) are adjusted for clustering on matching groups. p < .05.
* p < .10; ** p < .05; *** p < .01
As can be seen in Table 6.1, in TFT/TBT (model 1b) and in TFT-R/TBT-R (model 1c), a higher OC significantly decreases the probability of minimal effort, which suggests that minimal effort choices are an expression of negative reciprocity. Consistent with the gift-exchange hypothesis (positive reciprocity), OC significantly increases effort conditional on effort greater than 1, as shown in Table 6.2, models 2b and 2c.
In stark contrast, in FT/BT (models 1a and 2a), the coefficients are insignificant – that is, effort choice is unrelated to OC (see also Fig. 2, panel a, and compare to panels g and m). Thus, when participants had experienced Trust contracting (and hence positive and negative reciprocity) in phase 1 before being exposed to NIC contracts in phase 2, agents behaved reciprocally like under Trust contracting: They were less likely to choose minimal effort the higher the offered wage was and to choose higher effort the higher the wage was. Without such experience (treatments FT/BT), the presence of incentive contracts seems to have removed reciprocity. Or could the lack of reciprocity also be due to chance?
Here we briefly describe two placebo tests to see whether the lack of a wage–effort relationship illustrated in Fig. 2a and estimated in Table 6, models 1a and 2a, are due to chance, rather than a ‘crowding-out-of-reciprocity effect.’ See Section B5 in the Online Appendix for further details and an illustration (Fig. B4).
For the placebo tests, we use bootstrap to draw 500 random samples of 77 contracts (the number of accepted NIC contracts with effort > 1, see Table 6) from the data of Trust contracts in phase 1 of the TTT and TFT and TBT experiments, where incentive contracts cannot have influenced the wage–effort relationship. We ran 500 Probit and 500 Tobit regressions (following models 1a and 2a in Table 6 with wage instead of OC because incentive contracts are not available in the placebo data of phase 1 TTT/TFT/TBT).
The bootstrap Probit regressions are on a dummy of minimal effort. The mean of the estimated coefficients of wage is −.483, and the 99% confidence interval is [−.501, −.465], which does not include the estimated coefficient of −.045 in Table 6.1. 91.8% of all p-values are less than .05. The bootstrap Tobit regressions are on effort greater than 1. The mean of the estimated coefficients of wage is 3.15, and the 99% confidence interval is [3.09, 3.21] – far away from the estimated coefficient of .442 in Table 6.2; 98.4% of all p-values less than .05. We conclude that the absence of a reciprocal wage–effort relationship in phase 1 of FT/BT is not due to chance but reflects a true ‘crowding-out-of-reciprocity effect.’
Is it possible that agents, when thinking about their effort choice, pay attention to the elements of the offered contract despite the contract not being incentive compatible? From a theoretical point of view, the desired effort level and the stipulated fine or bonus should not matter, but agents may nevertheless be influenced by them. To investigate this possibility, we repeated our analysis of Table 6 by also including the stipulated desired effort and fine or bonus. We report those results in the Online Appendix Table B7. We find that in FT/BT, the elements of the NIC contract matter to some extent: The higher the desired effort, the higher the likelihood of minimal effort (p = .002), and the higher the wage, the lower the likelihood of minimal effort (p = .025); fine or bonus is insignificant (p = .163). For effort greater than 1, we find that wage is now positive but only weakly significant (p = .05); effort also increases significantly with a fine or bonus (p = .000) but not with desired effort (p = .498). These observations may explain the noisy effort choices in phase 1 of FT/BT (see Fig. 2a). Interestingly, under NIC contracts in TFT/TBT and TFT-R/TBT-R desired effort and fine/bonus have no significant impact (all p > .114, except for desired effort on minimal effort in TFT/TBT where p = .077).
Finally, we briefly investigate the role of framing of incentive contracts as either Fine or Bonus. Visual inspections of Figs. B2 and B3 in the Online Appendix, which provide a breakdown of Figs. 2 and 3 by contract type, suggest very limited framing effects. The econometric analyses of Table 6 support this impression. The dummy variable Treatment, which measures the difference between the respective Fine contracts and Bonus contracts (FT vs. BT, TFT vs. TBT, TFT-R vs. TBT-R), has an insignificant effect throughout. We conclude that framing incentives as fine or bonus does not matter in our dataset, which is evidence against our Hypothesis 4.
5.4. Comparison of predicted effort across treatments
We now collect the results of the previous sections and compare them along predicted values, most importantly expected effort  $E\left( e \right)$, derived from the regression analyses. Table 7, panel A, shows the predicted values for Trust contracts, panel B for incentive-compatible Fine and Bonus contracts, and panel C for NIC Fine and Bonus contracts. To determine $E\left( e \right)$, we first calculate the predicted probability of minimal effort ( $Pr\left( {e = 1} \right)$) based on Probit regressions and then the predicted effort conditional on above-minimal effort ( $e\left| e \right\rangle 1$) based on OLS regressions and assuming values of OC as shown in column OC. $E\left( e \right)$ is then calculated as $E\left(e\right)=Pr\left(e=1\right)\cdot1+(1-Pr\left(e=1\right)\cdot\left(e\left|e\right\rangle1\right)$. We also report the expected profit of the principal calculated as $E\left(\pi_P\right)=Pr\left(e=1\right)\cdot1\cdot35+(1-Pr\left(e=1\right)\cdot\left(e\left|e\right\rangle1\right)\cdot35-OC$.
Predicted values based on regression models
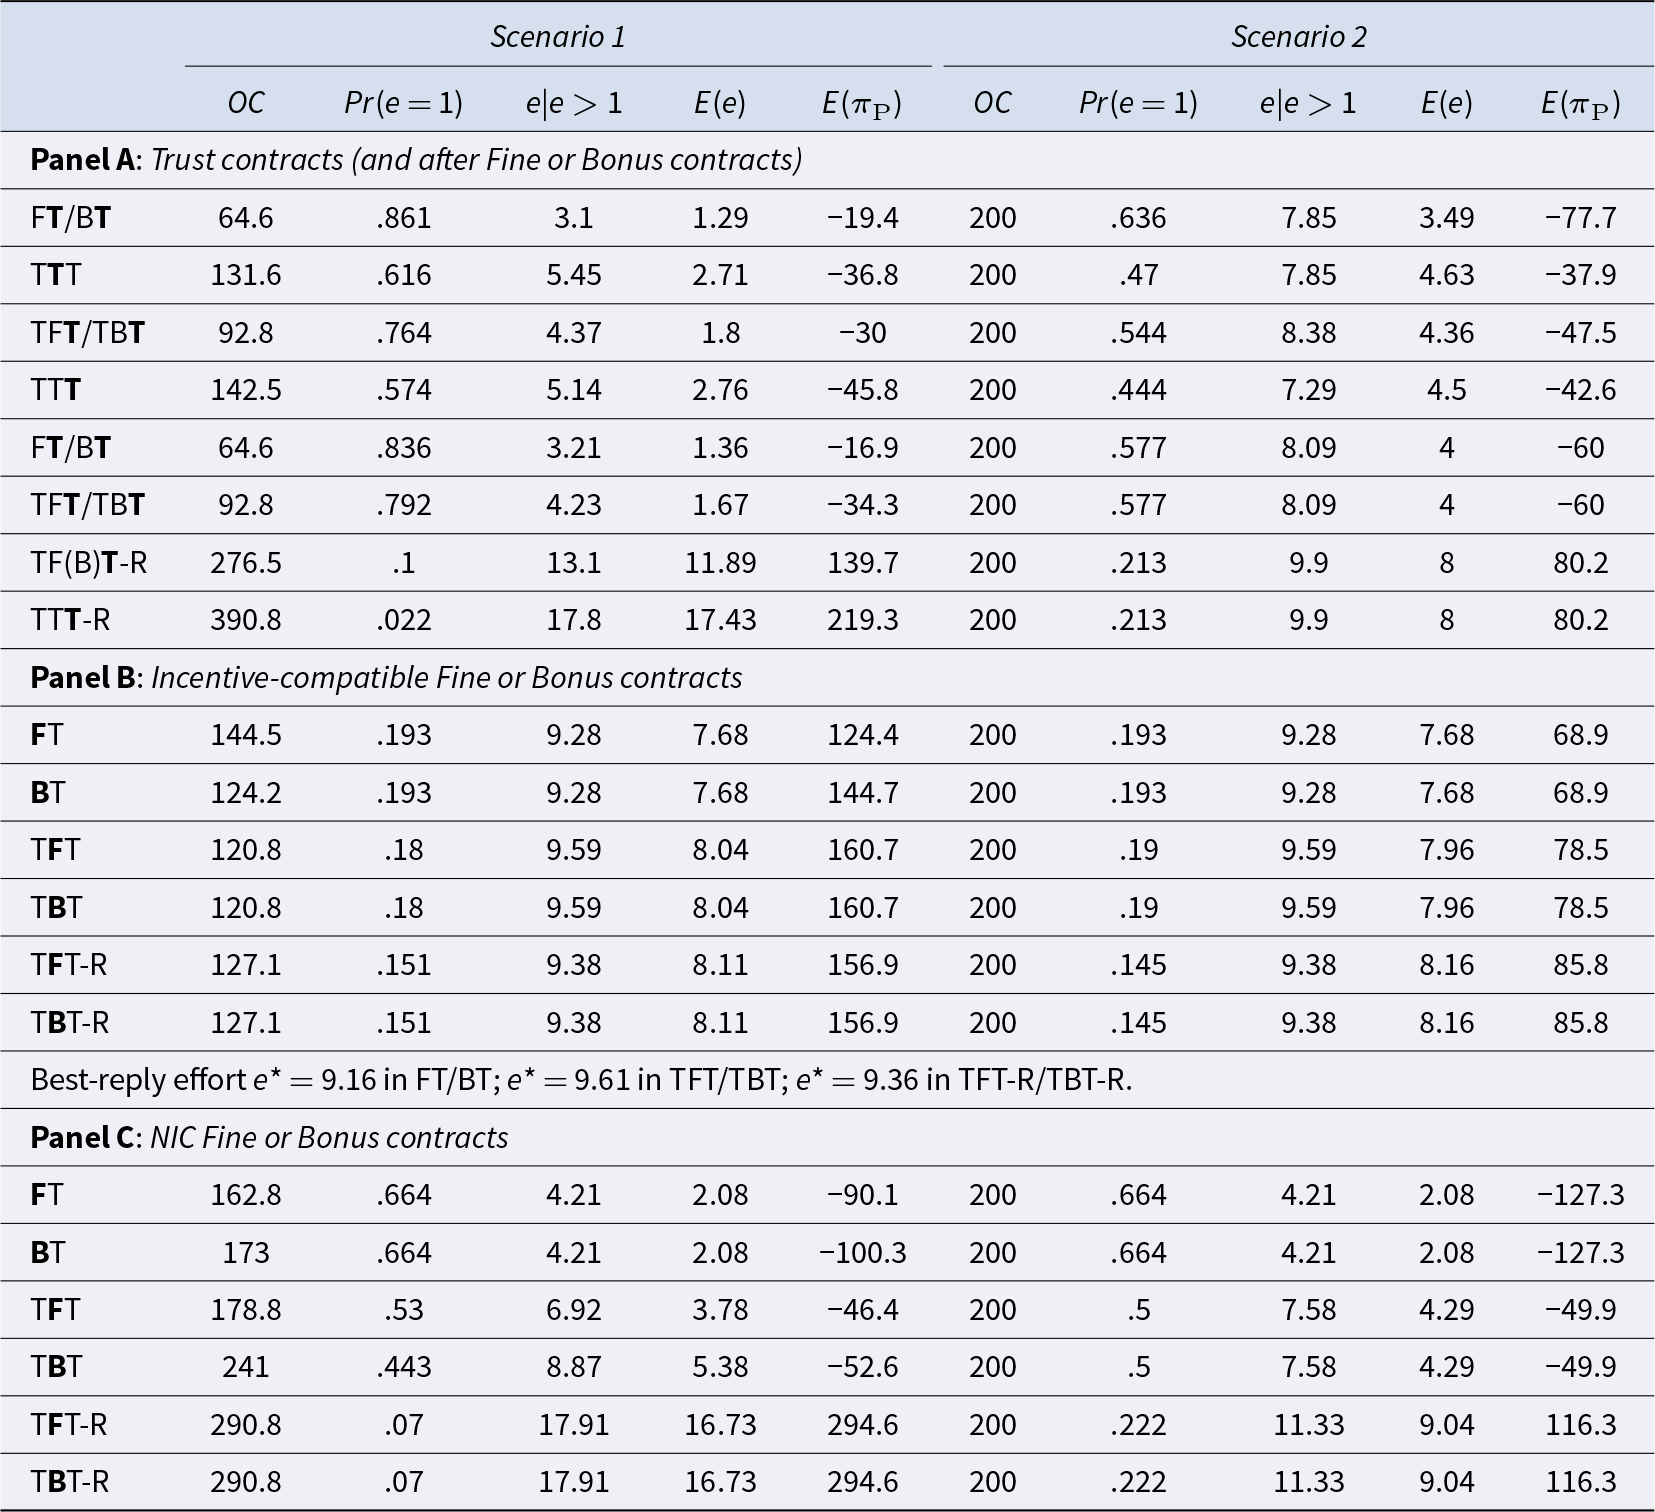
Notes: Predicted values based on regressions of minimal effort and effort conditional on above-minimal effort. Data: All accepted Trust contracts, subsets as defined in panel headers and the first column; bolded letters indicate respective phase under consideration. Compared to the Probit and OLS-regressions reported in the previous section, the models were re-estimated after eliminating explanatory variables that were insignificant for a one-tailed test. Scenario 1 determines predictions for means of offered compensation (OC) of the respective data subset (shown in column 2). Scenario 2 determines predictions for an offered compensation of 200. Pr(e = 1) is the estimated probability for minimal effort; e|e>1 is the estimated effort conditional on aboveminimal effort; E(e) is the expected effort combining the partial effects, i.e., E(e) = Pr(e = 1) ∙ 1 + (1 – Pr(e = 1))∙ (e|e>1) and E(πP) = Pr(e = 1) ∙ 1 ∙ 35 + (1 – Pr(e = 1)) ∙ (e|e>1) ∙ 35 – OC is expected profit of the principal. For panel B also the mean values of best-reply effort e* are provided for which the predicted value calculations are done (see note to Panel B).
We study two scenarios. In Scenario 1, we use the mean values of OC, calculated separately for each treatment, which capture changes in the principal’s trust across two treatments under comparison. Thus, in Scenario 1,  $E\left( e \right)$ combines three partial effects of experiencing monetary incentives before Trust contracting: a change in trust, a change in the probability of minimal effort, and a change in effort conditional on above-minimal effort.
In Scenario 2, we calculate the same variables as in Scenario 1 but assume a fixed OC of 200, which implies that in our treatment comparisons,  $E\left( e \right)$ displays changes in expected effort that are not associated with changes in trust by the principal. In both scenarios we only use significant effects: If a regression analysis returned an insignificant (at p > .1) influence of treatment or OC or both, we recalculated the regression after eliminating all insignificant explanatory variables. For this reason, some predictions and OC values reported in Table 7 do not differ between treatments.
Table 7A records  $E\left( e \right)$ under Trust contracts after Fine or Bonus contracts. All differences in $E\left( e \right)$ in treatment comparisons reported for Scenario 1 are as predicted by Hypotheses 1a to 1d, which suggest reduced voluntary cooperation (effort) in Trust contracts after having experienced incentive contracts (see Section 4). For instance, for Trust contracts in phase 2 after Fine/Bonus contracts in phase 1 of the FT/BT experiments, the expected effort $E\left( e \right)\,$is 1.29, which results from the fact that principals on average offered a wage of 64.6 and, in response, agents chose the minimum effort ( $e = 1$) in 86.1% of the cases and on average put in an effort of 3.1 for their non-minimal effort choices. These effort choices yield an expected payoff for the principal of E( ${\pi _P}$) = −19.4 money units. In contrast, in phase 2 of TTT – that is, after a Trust contract in phase 1, $E\left( e \right)$ is 2.71. Expected effort is lower after incentive contracts than after Trust contracts in all comparisons recorded in Scenario 1 of panel A.
In Scenario 2, which fixes OC at 200,  $E\left( e \right)$ equals 3.49 in phase 2 of FT/BT and $E\left( e \right)$ equals 4.63 in phase 2 of TTT. Here, this difference in $E\left( e \right)\,$is not due to differences in OC (and the reciprocal reaction to it in $e\left| e \right\rangle 1$) but due to $Pr\left( {e = 1} \right)$, which is 63.6% in phase 2 of FT/BT and 47% in phase 2 of TTT. Scenario 2 also shows that effort conditional on effort greater than varies very little between treatments if it varies at all. This shows that the overall differences in $E\left( e \right)$ displayed in Scenario 1 are mainly driven by the two partial effects of a reduction in trust by the principal and an increasing probability of minimal effort, but not by changes in effort conditional on effort greater than 1.
The main conclusion from Table 7A is that the data supports Hypothesis 1: Trust contracting after a phase of incentives leads to lower effort than experiencing Trust contracts throughout. This negative influence of experiencing incentives is stronger with Partner matching than with Stranger matching. Under Partner matching, expected effort  $E\left( e \right)$ is reduced by 5.54 units (17.43 – 11.89). This crowding out of voluntary cooperation comes through two channels: A reduction in the principal’s trust level and an increased willingness to provide only minimal effort. The wage–effort relationship conditional on effort greater than 1 remains intact.
Column  $E\left( {{\pi _P}} \right)$ reports that an average Trust contract induces a positive expected profit for the principal only under Partner matching. Figure 4a illustrates that our experimental game sets a hard task for the principal to achieve profitable cooperation under Stranger matching. The variance in the principal’s profit increases substantially in the offered wage. Offering a high wage is very risky, frequently leading to negative profit due to choices of minimal effort. This is different under Partner matching (Fig. 4b), according to which negative profits are much less likely.
Principal’s profits under phase 3 Trust contracts in TTT strangers and TTT-R partners
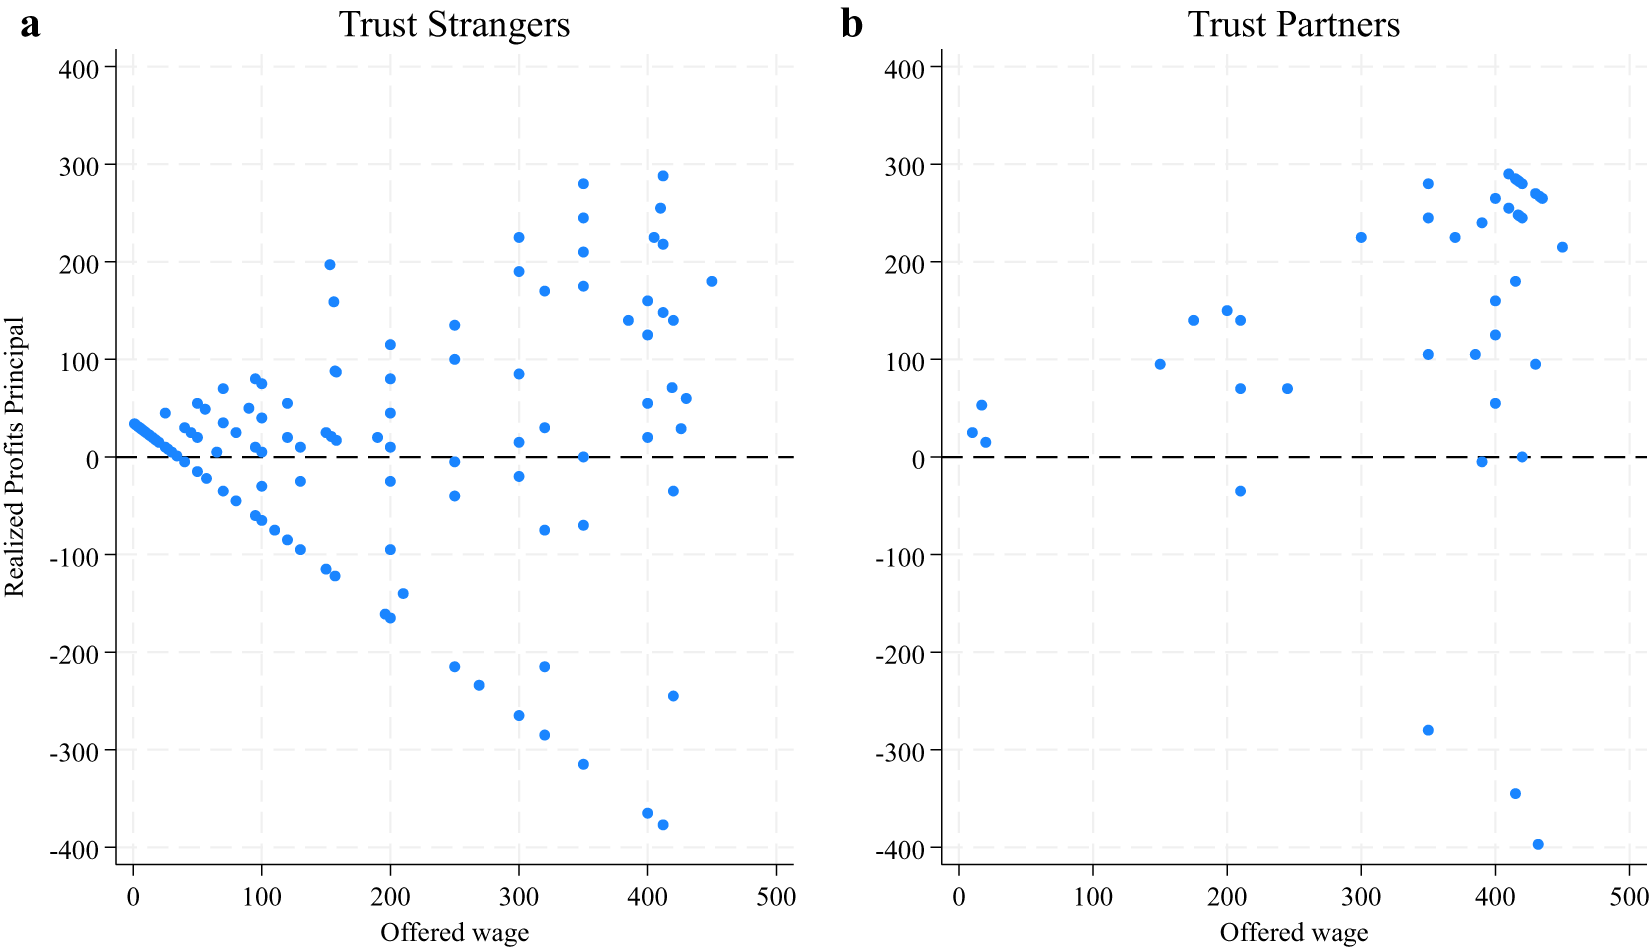
Table 7B shows similar calculations for incentive-compatible Fine and Bonus contracts. Three effects are striking: First, under Stranger matching,  $E\left( e \right)$ is higher than for Trust contracts shown in panel A – that is, monetary incentives are highly effective, although they fall short of the theoretically predicted level of 12. Second, there is no difference in $E\left( e \right)$ between Stranger and Partner matching. Thus, even with Partner matching, an incentive-compatible contract induces agents to just focus on incentives and nothing else. Third, $E\left( e \right)$ and $E\left( {{\pi _P}} \right)$ are substantially lower compared to Trust contracts with Partner matching. Thus, when incentive-compatible contracts are used in a repeated relationship, explicit incentives dominate, and implicit incentives – that is, the sequential reciprocity mechanism across periods – do not work as effectively as under Trust contracting.
Table 7C displays predicted values for NIC Fine and Bonus contracts. Looking at Scenario 2, it is apparent that, under Stranger conditions, NIC contracts perform worse than incentive-compatible contracts (Hypothesis 5d). Under Partner conditions, however, NIC contracts induce similarly high effort levels as Trust contracts. Many NIC contracts in TFT-R/TBT-R stipulate a desired effort of 20 (132 out of 243 cases; 54.3%), similar to phase 2 TTT-R contracts (64 out of 109 cases, 58.7%) and slightly lower than in phase 3 TTT-R contracts (78 out of 114; 68.4%). Furthermore, in case the desired effort is 20, most participants provide an effort of 20 (95/132 = 72% with phase 2 NIC contracts in TFT-R/TBT-R; 39/64 = 60.9% with phase 2 Trust contracts in TTT-R; and 59/78 = 75.6% under phase 3 TTT-R contracts). Together, the principal’s choice of high desired effort and the agent’s choice to provide this high effort are responsible for the effectiveness of NIC contracts in Partner matching. Comparing columns  $E({\pi}_{P})$ in panel C with panel B confirms that under Partner matching, the expected profit of the principal is higher with an NIC contract than with an incentive-compatible contract.
6. Summary and concluding remarks
Our paper’s main research goal is a comprehensive investigation of how explicit incentives interact with voluntary cooperation in one-shot and repeated gift-exchange environments. Understanding this interaction is important because contractual relationships in real life often have explicit incentives but also rely on trust and voluntary cooperation because contracts are typically incomplete. We focused on two main questions: How do incentive contracts affect voluntary both when contracts are incentive compatible and when they are not? Does experience with incentive contracts spill over to behavior under Trust contracts even after explicit incentives have been abolished? The main behavioral reason for why such interaction effects exist is that explicit incentives focus an agent’s attention on their self-interest, which may undermine (‘crowd out’) voluntary cooperation, whereas voluntary cooperation rests on social preferences. Naturally occurring contractual relationships often have explicit incentives, and people may also have experience with pure trust contracts without explicitly specified incentives. Our experiments aimed at cleanly separating contemporaneous incentive effects from experience effects.
Starting with the question whether experience with incentive contracts affects voluntary cooperation in their absence, one major result is that voluntary cooperation is reduced under Stranger matching, consistent with Hypotheses 1a and 1b, which predicted this crowding-out effect. This finding supports the conjecture that prior experience of Fine or Bonus contracts undermines the development of cooperation in one-shot interactions that come through the trust–reciprocity mechanism. The effect is stronger in phase 2 of FT/BT than in phase 3 of TFT/TBT, which suggests that experiencing Trust contracts in phase 1 before experiencing Fine or Bonus contracts in phase 2 diminishes the crowding-out effect in phase 3 (Hypothesis 1c).
Another novel result, and a twist on Hypothesis 1, is the persistent negative effect of explicit incentives even under Partner matching (Hypothesis 1d). Experiencing Fine or Bonus contracts in phase 2 of TFT-R/TBT-R weakens cooperation under Trust contracting in phase 3 even more than in Stranger one-shot interactions. Thus, implicit incentives provided by sequential reciprocity across rounds that are inherent in repeated game interactions are substantially compromised by previous experience of incentive contracting.
A further important new result is our detailed identification of two underlying channels through which these crowding-out effects occur: A reduction in the trust level exhibited by the principal in the form of their OC and an increase in the willingness of the agent to provide minimal effort. These two effects are responsible for reducing mean observed effort. A third potential channel – a change in the wage–effort relationship – is unimportant in our data (see Fig. 2). Conditional on an above-minimal effort choice, the reciprocal wage–effort relationship remains intact. We deem this an important result because it suggests that experience with incentive contracting might not destroy the possibility of voluntary cooperation: If principals pay well enough (and hence exhibit enough trust), reciprocity still works to produce high effort. This effect is particularly pronounced in Partner relationships.
Our framework explains our data as a function of three fundamental behavioral mechanisms: negative and positive reciprocity and self-interest. Agents’ effort choices reflect reciprocal behavior in its negative and positive forms (Hypothesis 2): Agents are more likely to reject contracts if the principal offers low compensation (supporting Hypothesis 2a) or will choose minimal effort (supporting Hypothesis 2b). This negative reciprocity is consistent with many results from ultimatum bargaining, which showed that many people reject unfair offers (e.g., Güth & Kocher, Reference Güth and Kocher2014; Lin et al., Reference Lin, Brown, Imai, Wang, Wang and Camerer2020). On the positive side, as expected from many gift-exchange games (e.g., Cooper & Kagel, Reference Cooper, Kagel, Kagel and Roth2016; Fehr & Gächter, Reference Fehr and Gächter2000), agents display a positive wage–effort correlation conditional on an above-minimal effort choice (confirming Hypothesis 2c). The only exception is a lack of experience with trust and reciprocity before being exposed to incentive contracting. In this case, and consistent with Fehr and Gächter (Reference Fehr and Gächter2002), reciprocity (both negative and positive) does not work, and agents choose either minimal effort or seemingly random positive effort.
Consistent with self-interest motivation, we also find that explicit incentive contracts are effective in inducing high effort (e.g., Gächter et al., Reference Gächter, Huang and Sefton2016; supporting Hypothesis 3). More importantly, and in line with quantitative theoretical predictions, if the contract is incentive compatible, agents choose exact best-reply efforts in many cases (consistent with Anderhub et al., Reference Anderhub, Gächter and Königstein2002, and confirming Hypothesis 5b). However, we also find that there is no voluntary effort beyond incentive-compatible best-reply levels, although, under Trust contracts, agents are willing to provide those levels. This also means that there is less voluntary cooperation than with Trust contracts (as predicted by Hypothesis 5c). This holds under Stranger matching and, maybe more surprising, under Partner matching. With Partner matching, asking for a desired effort that is higher than the incentive-compatible level is beneficial because it can induce effort levels above 12 if the wage is high enough. This results in higher effort and a higher expected profit of the principal than an incentive-compatible contract. On the contrary, with Stranger matching, NIC contracts perform worse than incentive-compatible contracts (Hypothesis 5d).
Contracts that do not satisfy the participation constraint are almost always rejected (confirming Hypothesis 5a). In addition, contracts are likely rejected, and there is a higher probability of minimal effort if OC is low, replicating evidence in Anderhub et al. (Reference Anderhub, Gächter and Königstein2002). Unlike Fehr and Gächter (Reference Fehr and Gächter2002) and Fehr et al. (Reference Fehr, Klein and Schmidt2007), but consistent with de Quidt et al. (Reference de Quidt, Fallucchi, Kölle, Nosenzo and Quercia2017), we do not find a framing effect. Fine and Bonus contracts are equally effective. Under Trust contracting as well as incentive contracting Partner matching induces higher effort than Stranger matching (in line with Hypothesis 6, and replicating evidence by Falk et al., Reference Falk, Gächter and Kovacs1999; Gächter & Falk, Reference Gächter and Falk2002).
In summary, explicit incentives lead to failures of separability and tend to crowd out voluntary cooperation. Incentives can also create history effects that can have spillover effects that are detrimental to voluntary cooperation. The details of these effects depend on the features of the situation in which explicit incentives are embedded; in our context, these are whether agents have prior experience with trust and reciprocity-based incentives and whether the interaction is repeated or not.
Supplementary material
The supplementary material for this article can be found at https:/doi.org/10.1017/eec.2024.14.
Data availability statement
Data and analysis code (in Stata) are available at https://doi.org/10.17605/OSF.IO/ACH8X.
Acknowledgements
We benefited from helpful comments by David Cooper, two referees, Nick Bardsley, Sam Bowles, Maria Garcia-Vega, Uri Gneezy and his students, Bernd Irlenbusch, Martin Sefton, Maroš Servátka, Eva Poen, Christian Thöni, Till O. Weber, and participants in numerous workshops and seminars. S. G. is grateful for the hospitality of the Institute for Advanced Studies at Hebrew University Jerusalem, the NZEEL at the University of Christchurch, and briq Bonn while working on this paper.
Funding statement
This work was supported by the European Research Council [Grant Numbers ERC-AdG 295707 COOPERATION and ERC-AdG 101020453 PRINCIPLES] and the Economic and Social Research Council [Grant Number ES/K002201/1]. We also acknowledge support from the EU-TMR Research Network ENDEAR (FMRX-CT98-0238) and from the Grundlagenforschungsfonds at the University of St. Gallen.
Competing interests
Not applicable.


 Open access