


1. Introduction
Purchasing bulls for a cow-calf producer is a complex management decision that has major implications for the profitability of the herd in the short and long run. In a given year, a single bull’s genetic makeup influences many calves sold from a herd, making it critical to select bulls that will produce cost-competitive and high-quality calves. Feedlots typically desire to purchase feeder cattle that have higher average daily gain, lower feed-to-gain ratios, higher dressing percentage, and superior carcass quality because these characteristics increase the profitability of cattle during the feedlot phase (Jones et al., Reference Jones, Turner, Dhuyvetter and Marsh2008; Lewis et al., Reference Lewis, Griffith, Boyer and Rhinehart2016; Mark, Schroeder, and Jones, Reference Mark, Schroeder and Jones2000; Tang et al., Reference Tang, Lewis, Lambert, Griffith and Boyer2017). In the long run, a single bull’s genetics could also affect the herd through heifer calves retained to replace culled cows. Therefore, an individual bull can influence the overall genetic makeup of the herd to a greater degree than individual cows (Wagner et al., Reference Wagner, Gibb, Farmer and Strohbehn1985).
Bulls are sold using a variety of market structures. One common method is an auction market, meaning buyers bid on the bull based on publicly available information about each bull. This information commonly includes phenotypic traits such as age, birth weight, and breed, as well as performance measurements such as average daily gain, weaning weight, and yearling weight. In recent years, the information about relative expected performance of calves from a sire, commonly referred to as expected progeny differences (EPDs), has become routinely available. EPDs are estimates of how a bull or cow’s future progeny (offspring) will perform, on average, for a given trait. EPDs are calculated for a number of traits such as birth weight, calving ease, weaning weight, yearling weight, and carcass quality, which is helpful in selecting cattle for specific traits. Producers’ willingness to pay for a bull will vary based on its EPDs, phenotypic traits, performance measurements, and, ultimately, how the bull fits within a producers’ breeding program and herd.
Several studies have sought to examine the impact of EPDs on the price of bulls. Dhuyvetter et al. (Reference Dhuyvetter, Schroeder, Simms, Bolze and Geske1996) collected data on 26 purebred beef bull sales in Kansas during 1993. They found that, depending on the breed, certain EPDs were associated with bull price changes and that many phenotypic traits and performance measurements also affected bull prices. Chvosta, Rucker, and Watts (Reference Chvosta, Rucker and Watts2001) used data from 1982 to 1997 for bulls sold in Montana and data from 1986 to 1996 regarding bulls sold in Nebraska and South Dakota. They found that phenotypic traits were more valuable to producers than EPD information. Jones et al. (Reference Jones, Turner, Dhuyvetter and Marsh2008) analyzed data collected over a 4-month period from purebred Angus bull sales located across the Midwest and Northwest United States. They found that both EPDs and phenotypic traits significantly affected sales price. Interestingly, they noted birth weight EPD as one of the most valued by producers. Vestal et al. (Reference Vestal, Lusk, DeVuyst and Kropp2013) used a stated preference and revealed preference study to determine how EPDs affected bull sale prices. Bull sale data from three Oklahoma Beef Inc. performance-tested bull sales in 2009–2010 were used in their revealed preference study. EPDs influenced bull purchaser decisions in both the revealed and stated preference studies. Brimlow and Doyle (Reference Brimlow and Doyle2014) evaluated the value of phenotypic and EPD information for bulls sold in Nevada. EPD information produced the greatest change in bull prices.
These studies are insightful about the impact of various traits on bull prices, but these studies are focused on bull sales in the western United States. Little is known about cow-calf producers’ values for bull traits in the Southeast United States, which is primarily cow-calf production (McBride and Mathews, Reference McBride and Mathews2011) and accounts for 41% of all U.S. cows (U.S. Department of Agriculture, National Agricultural Statistic Service, 2018). Therefore, analyzing bull sale data to determine the value of these traits by Southeast U.S. cow-calf producers would provide unique insight into regional differences in bull trait values.
Furthermore, early studies show producers’ value of EPD measurements was small relative to phenotypic traits and performance measurements (Chvosta, Rucker, and Watts, Reference Chvosta, Rucker and Watts2001; Dhuyvetter et al., Reference Dhuyvetter, Schroeder, Simms, Bolze and Geske1996; Irsik et al., Reference Irsik, House, Shuffitt and Shearer2008). This might be attributable to the lack of knowledge and confidence in using EPD information in their bull purchasing decision (Jones et al., Reference Jones, Turner, Dhuyvetter and Marsh2008). More recent studies indicate that EPD information is becoming more important in determining bull sale price (Bacon, Cunningham, and Franken, Reference Bacon, Cunningham and Franken2017; Brimlow and Doyle, Reference Brimlow and Doyle2014; Jones et al., Reference Jones, Turner, Dhuyvetter and Marsh2008; Kessler, Pendell, and Enns, Reference Kessler, Pendell and Enns2017; McDonald et al., Reference McDonald, Brester, Bekkerman and Paterson2010). Although these studies are useful to understand the change in producers’ values of EPDs over time, the question of whether producers value EPD measurements for bulls differently today than they did in the past remains unanswered.
Additionally, some states such as Tennessee and Kentucky have recently implemented partial cost-share programs that reimburse producers for the purchase of breeding livestock that meet a specific EPD profile. The purpose of these programs is to encourage producers to purchase bulls that will improve the genetics of the herd, value of the calf, and livestock sector in the state. However, little is known about the impact of these programs on the price of bulls. Ifft, Wu, and Kuethe (Reference Ifft, Wu and Kuethe2014) evaluated how subsidies affect the price of items sold in agricultural auctions and found that eligibility of subsidized pasture insurance increased the price of pasture. Similar research is needed on how a partial-cost reimbursement program for bulls could affect the value of bulls sold.
The objective of this study is to estimate Southeast U.S. cow-calf producers’ value of phenotypic traits, performance measurements, and EPDs over time. We also explore how a partial-cost reimbursement program for bulls sold in Tennessee affects the price of the bull. A hedonic pricing model was estimated using 11 years of bull sale data (2006–2016) from a public first-price auction in Tennessee. The results will be used to educate purebred seed stock providers on the economic value of individual bull selection criteria and to inform state policy makers about how the partial-cost reimbursement program influences bull prices, which will help them assess the program effectiveness.
2. Empirical model
A hedonic pricing model was specified to estimate the impact of phenotypic traits, performance measurements, and EPDs on bull sale price over time, which follows the modeling approach of previous studies (Bekkerman, Brester, and McDonald, Reference Bekkerman, Brester and McDonald2013; Brimlow and Doyle, Reference Brimlow and Doyle2014; Chvosta, Rucker, and Watts, Reference Chvosta, Rucker and Watts2001; Dhuyvetter et al., Reference Dhuyvetter, Schroeder, Simms, Bolze and Geske1996; Jones et al., Reference Jones, Turner, Dhuyvetter and Marsh2008; Kessler, Pendell, and Enns, Reference Kessler, Pendell and Enns2017; McDonald et al., Reference McDonald, Brester, Bekkerman and Paterson2010; Vanek, Watts, and Brester, Reference Vanek, Watts and Brester2008; Vestal et al., Reference Vestal, Lusk, DeVuyst and Kropp2013). Hedonic pricing models have been used to determine the influence of characteristics over time (Blank, Saitone, and Sexton, Reference Blank, Saitone and Sexton2016; Hanson, Sherrick, and Kuethe, Reference Hanson, Sherrick and Kuethe2018; Zimmerman et al. Reference Zimmerman, Schroeder, Dhuyvetter, Olson, Stokka, Seeger and Grotelueschen2012). Zimmerman et al. (Reference Zimmerman, Schroeder, Dhuyvetter, Olson, Stokka, Seeger and Grotelueschen2012) and Blank, Saitone, and Sexton (Reference Blank, Saitone and Sexton2016) evaluated the change in characteristics of calves over time by estimating annual hedonic pricing models. Similarly, Hanson, Sherrick, and Kuethe (Reference Hanson, Sherrick and Kuethe2018) followed this approach by estimating annual hedonic pricing models for land values.
We follow this same approach by estimating a separate hedonic pricing model for each year of data, which is generally expressed as
 $${P_i} = {\beta _0} + \sum\nolimits_{j = 1}^J {{\beta _j}{X_{ij}} + {\delta _1}CR + {\varepsilon _i}},$$(1)
where P i is the sale price for the bull i ($/head); X ij represents the jth (j = 1,…,J) bull phenotypic trait, performance measurement, or EPD variables; CR is an indicator variable that is equal to 1 if the bull was eligible for the partial-cost reimbursement program for bull genetics and 0 otherwise; β’s and δ’s are parameters to be estimated; and ε i is the error term. Equation (1) is estimated for each year from 2006 to 2016.
3. Bull sale overview
Performance-tested bulls at the University of Tennessee Bull Testing Station are sold annually in January and March at the Middle Tennessee AgResearch and Education Center in Spring Hill, Tennessee (University of Tennessee, Department of Animal Science, 2017). This performance test program and sale started in 1970 to educate bull developers on breeding programs, create a market for performance-tested bulls, and improve beef cattle herd quality across the state. Each year, breeders deliver their bulls to the test station in August (for bulls sold in January) and November (for bulls sold in March) of the year preceding the sale. The bulls are allowed a 2-week adjustment period. After this period, they are weighed and started on an 84-day gain test where bulls are fed a 12% crude protein commercial bull development ration. The January sale is exclusively for senior bulls (born between September 1 and December 15), and the March sale is exclusively for the junior bulls (born between December 16 and March 15). Bulls are then sold in a public first-price auction without a reserve price.
At the end of the test period, each bull is weighed and measured for many phenotypic traits. These measurements include hip height, frame score, sale weight, and average daily gain. This information is given along with pretest information such as birth weight and weaning weight. The catalog also includes EPDs and ultrasound data such as fat thickness, rib-eye area, and intramuscular fat. In 2017, bulls sold through this sale also had genomic-enhanced EPD information available, which combined EPD information with DNA information on the animal. These genomic enhanced EPDs are more accurate than traditional EPDs but are not being used widely among seed stock producers. Future research should investigate how these genomic-enhanced EPDs are valued relative to traditional EPDs.
The Tennessee Department of Agriculture (TDA) offers partial-cost reimbursement for bulls through the Tennessee Agricultural Enhancement Program (TAEP) for bull genetics (TDA, 2017). Bulls that meet EPD requirements are eligible for a $1,200 per purchased bull payment to subsidize the cost. The purchasers of the bulls eligible for the TAEP payment assistance are required to complete an application that can be submitted online or via mail. The EPD requirements change annually and are suggested by an advisory committee to TDA. Boyer et al. (Reference Boyer, Griffith, Rhinehart and Kirkpatrick2018) provide more about the qualification standards for TAEP and how bulls sold through this sale have previously qualified for this program.
4. Estimation and data
Multicollinearity is a common problem in hedonic pricing models (Brimlow and Doyle, Reference Brimlow and Doyle2014; Kessler, Pendell, and Enns, Reference Kessler, Pendell and Enns2017; Vanek, Watts and Brester, Reference Vanek, Watts and Brester2008). To ensure multicollinearity was not an issue in this analysis, we started by estimating Pearson correlation coefficients for all the available EPD information. As anticipated, birth weight EPD and calving ease direct EPD had a correlation coefficient of −0.7, and weaning weight EPD and yearling weight EPD had a correlation of 0.86. A common acceptable approach to address the strong correlation among independent variables is to drop one of the correlated variables. However, in this case, we would have to have dropped two EPD measurements from the analysis. Brimlow and Doyle (Reference Brimlow and Doyle2014) suggested another approach to keep EPD information in hedonic pricing models while removing multicollinearity by creating a new independent variable that is the difference of yearling weight EPD and birth weight EPD. Following Brimlow and Doyle (Reference Brimlow and Doyle2014), we created “projected growth EPD” by taking the difference between birth weight EPD and weaning weight EPD. We elected to use weaning weight EPD in our measurement because most cow-calf producers in the Southeast United States market calves at weaning and do not retain ownership to finishing (Tang et al., Reference Tang, Lewis, Lambert, Griffith and Boyer2017). Projected growth EPD was not correlated with calving ease direct EPD; therefore, calving ease direct EPD remained in the model. Using the approach of Brimlow and Doyle (Reference Brimlow and Doyle2014), we addressed the correlation problem by only dropping one EPD variable. The only phenotypic traits that were correlated were age and weight (Pearson correlation coefficient was 0.71). We dropped age from the analysis because weight is an approximation of age. We tested the final model for multicollinearity using the variance inflation factor (Wooldridge, Reference Wooldridge2013).
Heteroskedasticity is also a common problem for estimating cattle hedonic pricing models (Jones et al., Reference Jones, Turner, Dhuyvetter and Marsh2008; Kessler, Pendell, and Enns, Reference Kessler, Pendell and Enns2017; Mitchell, Peel, and Brorsen, Reference Mitchell, Peel and Brorsen2018). The White test will be used to determine if heteroscedasticity is present across all independent variables and years (Wooldridge, Reference Wooldridge2013). Consistent with previous research, heteroskedasticity was also detected in the data across the independent variables, and we corrected it using feasible generalized least squares (FGLS) regression (Jones et al., Reference Jones, Turner, Dhuyvetter and Marsh2008; Kessler, Pendell, and Enns, Reference Kessler, Pendell and Enns2017; Mitchell, Peel, and Brorsen, Reference Mitchell, Peel and Brorsen2018). The FGLS approach corrects for heteroskedasticity by reweighting the variance to discount the presence of outliers (Wooldridge, Reference Wooldridge2013).
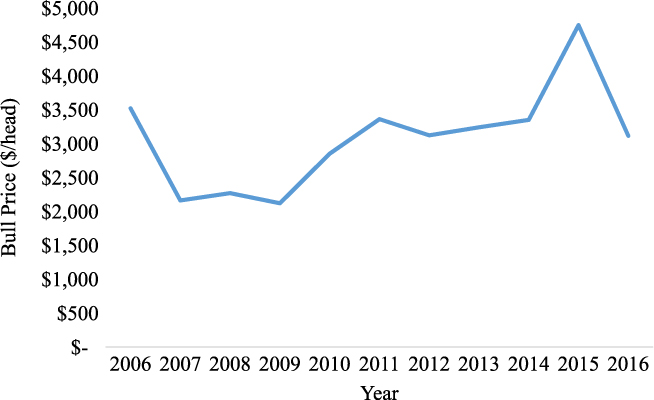
Table 1 provides an explanation of the variables included in this study, and Table 2 provides the summary statistics for these variables. Sale data for this study span from 2006 to 2016. Because only a small percentage of the bulls sold during this time period were breeds other than Angus, we only considered the Angus breed in analysis. Many of the bulls were missing carcass weight EPDs, marbling EPDs, rib-eye area EPDs, and fat thickness EPDs, as well as ultrasound data on fat thickness, rib-eye area, and intramuscular fat. Studies repeatedly show that buyers rarely place a value on carcass EPDs and ultrasound data of bulls (Vestal et al., Reference Vestal, Lusk, DeVuyst and Kropp2013). Bull sale catalogs can contain an overwhelming amount of information about a single bull, and it is likely that cow-calf producers view this information as excessive for sire selections. Therefore, we do not consider these data in this analysis. It might be interesting for future research to examine if bull purchasers experience an excessive choice effect when selecting sires (Arunachalam et al., Reference Arunachalam, Henneberry, Lusk and Norwood2009). Figure 1 shows the average price paid for a bull sold from the University of Tennessee Bull Testing Station during 2006–2016. Table 3 shows the average traits of the bulls sold in the University of Tennessee Bull Testing Station during 2006–2016 by year. This will provide some insight into the supply response of purebred seed stock producers to cow-calf producers’ demand.
Average price paid (per head) for a bull sold in the University of Tennessee Bull Testing Station sale from 2006 to 2016 by year
Description of the dependent and independent variables used in the hedonic price model for bulls sold in Tennessee from 2006 to 2016
Note: EPD, expected progeny difference.
Summary statistics of dependent and independent variables used in the hedonic price model for bulls sold in Tennessee from 2006 to 2016

Note: EPD, expected progeny difference.
a Equals 1 if the bull is eligible for Tennessee Agricultural Enhancement Program cost-share payment, and 0 otherwise.
Average values of bull traits sold in Tennessee from 2006 to 2016 by year
Note: EPD, expected progeny difference.
a Equals 1 if the bull is eligible for Tennessee Agricultural Enhancement Program cost-share payment, and 0 otherwise.
Sale price of the bulls was nonnormal with positive skewness. Therefore, we specify a log-level model by taking the log of sale price, correcting the nonnormality issue (Wooldridge, Reference Wooldridge2013). Parameter estimates can be converted to a dollars change in the dependent variable with a one-unit change in the independent variable of interest by multiplying the parameter estimates by the average predicted selling price of the bulls in the sample (Wooldridge, Reference Wooldridge2013). This conversion would give a marginal effect of a change in the independent variable at the average price. For some bull traits, a one-unit change in the independent variable would be unlikely. These marginal effects at the average price were converted into realistic unit changes for each variable of interest. For example, frame score would likely change by units of 0.1. Marginal effects of a change in frame score on the average price were calculated for a 0.1 change in frame score. The models were estimated using the REG procedure in SAS 9.2 (SAS Institute, 2003).
5. Expected signs of coefficients
The expected sign of the parameter to be estimated is also shown in Table 2. Studies have shown that an increase in birth weight EPD decreases the price of bulls, but an increase in weaning weight EPD increases the price of the bull (Brimlow and Doyle, Reference Brimlow and Doyle2014; Jones et al., Reference Jones, Turner, Dhuyvetter and Marsh2008; Vestal et al., Reference Vestal, Lusk, DeVuyst and Kropp2013). Producers desire lower birth weights for calving ease but heavier weaning weights to produce higher revenue. A larger difference between birth weight and weaning weight EPD would mean the projected growth EPD would increase. This could be interpreted as producers desiring faster-growing calves from birth to weaning. It is anticipated that a larger difference between these EPD measurements would increase the bull price. The expected sign for the parameter of projected growth EPD is positive, which is consistent with what Brimlow and Doyle (Reference Brimlow and Doyle2014) observed for the difference between yearling weight and birth weight EPD (Table 2).
The expected sign for calving ease direct EPD and milk EPD parameter estimates is unknown (Table 2). Calving ease direct EPD has never been analyzed in previous studies but is highly indirectly correlated with birth weight EPD. That is, an increase in calving ease direct EPD indicates a lower birth weight EPD. Producers selecting sires to be exclusively used on virgin heifers will desire a bull with a higher calving ease direct EPD. On the other hand, producers selecting sires for mating mature cows will likely tolerate higher birth weights to increase weaning weights, which would mean they prefer bulls with a lower calving east direct EPD. An increase in milk EPD has been reported to increase bull sale price (Jones et al., Reference Jones, Turner, Dhuyvetter and Marsh2008; Vestal et al., Reference Vestal, Lusk, DeVuyst and Kropp2013); however, Kessler, Pendell, and Enns (Reference Kessler, Pendell and Enns2017) found the converse. Higher milk EPD can mean the cow could produce heavier calves at weaning but will naturally have a higher nutritional demand and feed cost. Lower milk EPD could indicate the cow might produce lighter calves at weaning but will have a lower feed requirement and cost. One topic for future research might be to consider the unobserved heterogeneity among cow-calf producers when estimating a hedonic pricing model for bulls. This might be helpful in explaining the mixed findings for milk EPD.
For the phenotypic and performance measurements, studies have reported that an increase in average daily gain and the sale weight of the bull both increase the sale price (Brimlow and Doyle, Reference Brimlow and Doyle2014; Kessler, Pendell, and Enns, Reference Kessler, Pendell and Enns2017) (Table 2). Therefore, we anticipate the expected sign of these parameter estimates to be positive. The expected impact of frame score is unclear because studies commonly find these traits to be insignificant in price determination of a bull (Kessler, Pendell, and Enns, Reference Kessler, Pendell and Enns2017; Vestal et al., Reference Vestal, Lusk, DeVuyst and Kropp2013) (Table 2). However, this variable is interesting to include in the model because frame score is a selection indicator for mature body size (Kessler, Pendell, and Enns, Reference Kessler, Pendell and Enns2017).
Finally, partial-cost reimbursement eligibility was postulated to have a positive impact on bull sale prices (Table 2). This is based on what Ifft, Wu, and Kuethe (Reference Ifft, Wu and Kuethe2014) found for pasture land values that were eligible for subsidized pasture insurance. This is a unique variable to include in a price determination model for livestock.
6. Results
Parameter estimates for the annual hedonic pricing model are shown in Table 4. Across all the years, the total number of observations was 1,070, and the annual number of observations ranged from 65 to 119 bulls. The R-squared values were calculated following Wooldridge (Reference Wooldridge2013) and ranged from 0.62 to 0.83. The number of observations and R-squared values were similar to what Hanson, Sherrick, and Kuethe (Reference Hanson, Sherrick and Kuethe2018) reported for their annual land price hedonic pricing model. The variance inflation factor ranged from 1.05 to 2.26, indicating that multicollinearity was not an issue in any of the years (Wooldridge, Reference Wooldridge2013). Table 4 reports the parameter estimates for the FGLS regression.
Parameter estimates for hedonic pricing model of bull traits on sale price by year

Notes: Asterisks (***, **) denote significance at the 0.01 and 0.05 levels, respectively. EPD, expected progeny difference.
In years for which projected growth EPD was significant, the parameter estimates were positive as expected, and a 1-pound change in this EPD increased the average bull price from $21 per head in 2015 to $53 per head 2010 (Table 5). Likewise, Brimlow and Doyle (Reference Brimlow and Doyle2014) reported that a 1-pound increase in the difference between yearling weight and birth weight EPD resulted in the average bull price increasing by $19 per head. Although the marginal effects do not indicate a trend in producers’ value on average price over time, the parameter estimates for projected growth EPD have been significant since 2010, which suggests that this information may have become more relevant to producers over time.
A 1% change in calving ease direct EPD increased the average price of bulls from $36 per head in 2012 to $119 per head in 2008 (Table 5). Calving ease direct EPD was the only EPD measurement that significantly affected price in every year of this study; however, the marginal effect values were inconsistent over time. Reporting a positive value for this EPD is a unique contribution to the literature because this EPD has never been included in previous studies. However, this finding is not unexpected as studies have reported lower birth weight EPD to increase the price of bulls (Brimlow and Doyle, Reference Brimlow and Doyle2014; Jones et al., Reference Jones, Turner, Dhuyvetter and Marsh2008; Vestal et al., Reference Vestal, Lusk, DeVuyst and Kropp2013) and birth weight EPD and calving ease direct EPD are inversely correlated. Positive signs for projected growth EPD and calving ease direct EPD suggest that Southeast U.S. cow-calf producers value bulls that produce lighter calves at birth, reducing calving stress.
A 1-pound change in milk EPD resulted in an increase in the average price of bulls in 3 out of the 11 years of this study period. In the years this information affected prices, the change in the average price of bulls increased from $35 per head in 2008 to $46 per head in 2009 with a 1-pound change in milk EPD (Table 5). However, since 2010, this EPD measurement has not significantly affected the average price of bulls. Milk EPD information appears to have become less valuable to producers over time. This finding might be helpful in explaining why previous studies have found conflicting results for milk EPD (Jones et al., Reference Jones, Turner, Dhuyvetter and Marsh2008; Kessler, Pendell, and Enns, Reference Kessler, Pendell and Enns2017; Vestal et al., Reference Vestal, Lusk, DeVuyst and Kropp2013).
For the performance and phenotypic variables, average daily gain, sale weight, and frame score were positively related to sale price, which was the hypothesized sign for these parameters. These results imply that cow-calf producers value larger bulls more than smaller and bulls that can gain weight faster. An increase in average daily gain by 1 pound resulted in the average bull price increasing from $171 per head in 2014 to $1,244 per head in 2007 (Table 5). Since 2010, average daily gain has significantly affected the price of bulls sold, showing a consistent positive value to bulls’ growth during the test period.
Sale weight and frame score were significant in all 11 years of the data, but the influence of a change in sale weight and frame score on the average price of a bull appeared to vary by year. In 2013, a change in sale weight affected the average sale price the most ($371 per head), but it was also the year producers valued a change in the frame score the least ($25 per head) (Table 5). Overall, purebred seed stock producers should expect to receive a higher price for their larger and more mature bulls, which is consistent with findings from previous studies (Brimlow and Doyle, Reference Brimlow and Doyle2014; Kessler, Pendell, and Enns, Reference Kessler, Pendell and Enns2017).
Finally, the TAEP partial-cost reimbursement payment was found to increase the price of bulls in 2006 by $447 per head and in 2015 by $935 per head (Table 5). In all other years of this study, the TAEP partial-cost reimbursement program did not significantly affect the price of bulls. This implies that the majority of the $1,200 TAEP partial-cost reimbursement payment was retained by cow-calf producers and not passed along to purebred seed stock producers in the form of higher bull prices. This is slightly different from what Ifft, Wu, and Kuethe (Reference Ifft, Wu and Kuethe2014) observed for pastureland values sold that were eligible for subsidies. The two years when the TAEP payment increased bull prices were the first year of the cost reimbursement payment for bull genetics through TAEP (2006) and when cattle prices were historically high (2015). Looking at the bull prices in Figure 1, bulls prices were highest in 2015, which might be because the value of calves was historically high. This result suggests that in periods of high commodity prices, these cost-share payments could be increasing farm input items sold in auctions, such as land and livestock.
Marginal effect of bull traits on average sale ($/head) price by year
Notes: Marginal effects were calculated by multiplying the coefficient by the average predicted selling price of the bulls in the sample (Wooldridge, Reference Wooldridge2013). Asterisks (***, **) denote significance at the 0.01 and 0.05 levels, respectively. EPD, expected progeny difference.
Other farm inputs in Tennessee, such as fences, barns, and pens, are also eligible for partial-cost reimbursement within the TAEP. However, many of these other eligible inputs are sold in a posted-price market. An interesting topic for future research would be to determine the impact of these cost-share programs on farm inputs in various market structures.
7. Conclusion
This research elucidates producers’ value for phenotypic traits, performance measurements, and EPD measurements over time using 11 years of bull sale data from a public first-price auction in Tennessee. Several studies have evaluated how producers value these traits and measurements, but this article builds on these studies by evaluating values over time. Additionally, we demonstrate how a cost reimbursement program for high-quality bulls affects the sale price of bulls.
Calving ease direct EPD, sale weight, and frame score were the only traits that significantly affected the price of bulls in every year of this study. Furthermore, an increase in these traits resulted in a higher bull price on average. This suggests that cow-calf producers in this region value large, mature bulls that produce lighter calves that are easier on calving. Projected growth EPD and average daily gain increased the sale price of bulls in every year but 2006 and 2009. Milk EPD significantly affected the price of bulls from 2007 to 2009 but since then has not been a factor in bull price determination. Finally, the bulls eligible for the partial cost-share reimbursement program increased bull price in 2 of the 11 years analyzed.
Overall, purebred seed stock producers should focus on producing large, fast-growth, mature bulls that produce lighter calves, which reduces calving stress. Policy makers in Tennessee can use these result to evaluate the effectiveness of the TAEP. The TAEP payment increased bull prices in two years of this study. This finding suggests that cow-calf producers in Tennessee retain this payment more frequently than it is passed along to purebred seed stock producers. We realize that these results are limited to one bull sale in the state of Tennessee and may not be representative of all the bulls sold in Tennessee. Furthermore, the estimated value of the TAEP cost reimbursement payment might be causing the value of EPDs to be underestimated because TAEP qualification depends on EPD values. A larger data set over a greater period of time would allow us to address these shortcomings and test changes in parameter estimates over time.
Author ORCIDs
Christopher N. Boyer 0000-0002-1393-8589
Acknowledgements
We thank the leadership and staff at the University of Tennessee Research and Education Center in Spring Hill, Tennessee, for field research support.
Financial support
This research is also supported by U.S. Department of Agriculture, Cooperative State Research, Education, and Extension Service through Tennessee Hatch Project TEN00442.


 Open access