


1. Introduction
During the British North Greenland Expedition (B.N.G.E.) (1952–54) a traverse was made of the inland ice from Dronning Louise Land (lat. 77° N., long. 25° W.) to Nunatarssuaq (lat. 77° 30′ N., long. 68° W.), a distance of about 1200 km. Although the main work of the party was to carry out a gravity survey,Reference Bull 1 the opportunity was taken to measure the snow accumulation at many points along the traverse.
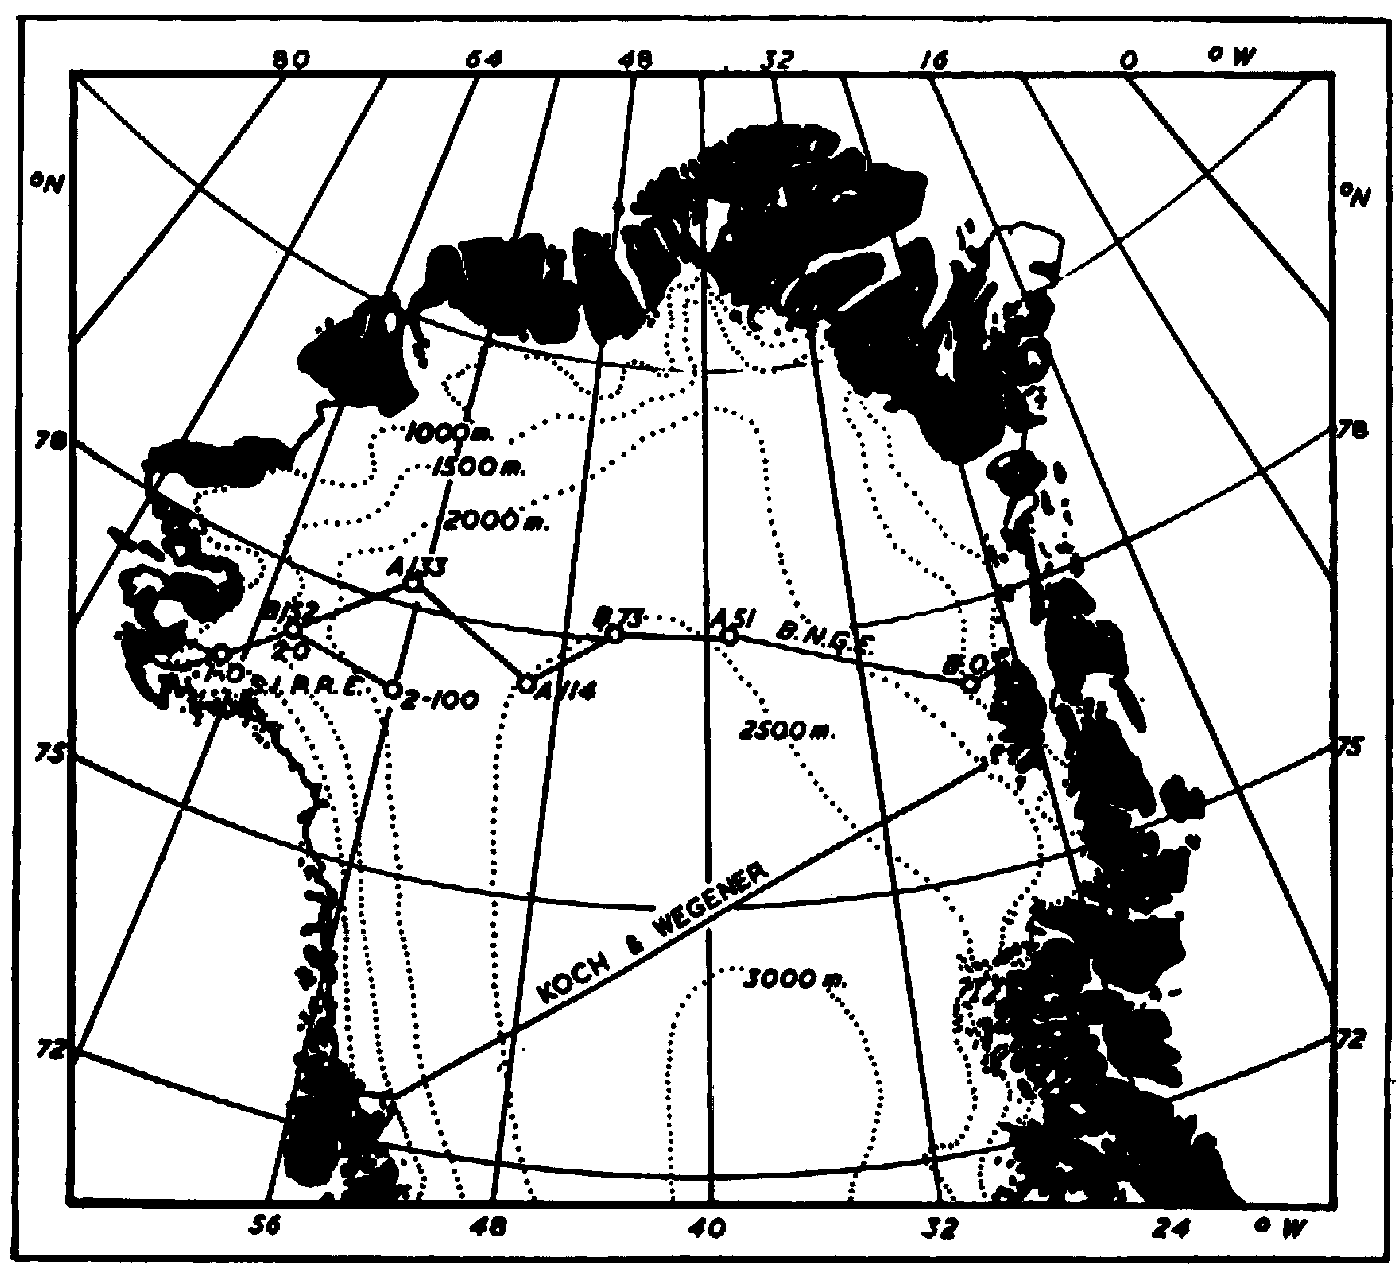
In the summer of 1953 the gravity survey was carried from Dronning Louise Land to Station B 73 (lat. 78° 01 .1′ N., long. 45° 47.0′ W.). See map, Fig. 1. A bamboo stake was erected to mark the position of each of the gravity stations,Reference Paterson and Slesser 2 the altitudes of which were determined by trigonometrical levelling with an accuracy of 10 m. The height above snow level of a mark on each bamboo was measured when it was first erected and subsequently whenever opportunity permitted. Most of the 102 stakes between Farvel Nunatak (Station B 0, lat. 77° 10.9′ N., long. 26° 11.5′ W.) and “Northice” (Station A 51, lat. 78° 04.3′ N., long. 38° 29.3′ W.) were measured on six occasions between May or June 1953 and July 1954, and the 42 between Northice and B 73 on three occasions between July 1953 and May 1954.
Sketch map of north Greenland showing routes followed by parties making measurements of snow accumulation on the inland ice
From these measurements the snow accumulation for the year 1953–54 along this part of the traverse has been estimated.
The method commonly used in the past to determine the annual accumulation of snow in a permanent snow field has been the direct examination of the stratification of the snow, as revealed in pits. The properties of the firn which are usually examined are the density, the grain size, the crystal form and the degree of compaction, but normally the annual layering can be distinguished from the density profile alone. In a previous paper Reference Bull 3 it has been shown that in the cold firn of the Greenland Ice Sheet a direct relationship exists between the density of a Iayer and its “resistance to penetration”, as measured with a Rammsonde. A Rammsonde profile to a depth of 3 m. can be made in about one hour whereas digging a pit to this depth and directly examining the strata takes very much more time. Therefore on this traverse about 30 Rammsonde profiles were made, while pits were dug at only five points. Unfortunately both the original and duplicate data sheets of the four most westerly Rammsonde profiles were pilfered from the Expedition’s baggage after its return, but from the rest the accumulation for the years 1947–53 at about 20 places along the route has been determined. In 1954 an American party made similar observations in an area which included the western end of the B.N.G.E. traverse.
2. Snow Accumulation Measurements with Bamboo Stakes
At different points in a small area the snow accumulation over periods as long as a year can vary considerably; for example, abnormally large accumulations occur in the lee of surface irregularities, even those as small as sastrugi. For this reason it is possible to deal with the direct measurements of accumulation only by a statistical method. In such a treatment it is assumed that the distribution of stakes is random with respect to the large and small surface undulations. West of long. 29° W. this assumption is justified because large scale surface irregularities do not occur and the sastrugi are very small, but between Farvel Nunatak and long. 29° W. the ice surface undulates. In this region more of the gravity stations were situated on the crests of undulations than in the valleys but, to allow for this, additional bamboos were erected between stations. To minimize the effect of very local variations in accumulation, the mean of the accumulations measured at nine consecutive bamboos is considered, due attention being paid to the magnitude of the standard deviation of the observations. The distance spanned by nine bamboos varied from about 12 km. near Farvel Nunatak to about 20 km. near B 73. In all cases the mean of the nine accumulation measurements is ascribed to the position of the middle bamboo stake.
Almost complete sets of measurements on the stakes between Farvel Nunatak and “Northice” were obtained in May and June 1953 (the observations being spread over 5 weeks), in July 1953 (spread over 5 days), in May 1954 (5 days) and in July 1954 (4 days); those between “Northice” and B 73 were erected and measured in July 1953 (10 days) and re-measured twice in May 1954 (6 days and 6 days).
Small wind eddies cause uneven accumulation around the bamboo itself but by taking the average surface level of the snow in the surrounding 15 or 20 cm. these errors are minimized.
To calculate the water equivalent the mean density of the snow in the layer corresponding to one year’s accumulation is required. This was determined directly at 4 points (B 73, “Northice”, B 20 and B 4) by weighing 500 cm.3 samples extracted in aluminium cylinders from the walls of shallow pits and at 14 places along this eastern half of the traverse the mean density of the top annual layer has been calculated from the Rammsonde profile, using the formula

where ρ is the density in gm. cm.−3, and R is the “resistance to penetration” in kilograms. (This is the empirical equation, obtained in the studies made at “Northice”, relating the density and “resistance to penetration” of low density firn samples.)
The two values for the mean density (i.e. that determined by direct measurement and that calculated from the Rammsonde profile) agree within about 8 per cent at B 73 and at “Northice“. The mean density in the top layer varies smoothly with altitude, from about 0.33 gm. cm.−3 at 2500 m., to about 0.42 gm. cm.−3 at 1550 m.
The standard error in estimating density from “resistance” is about 7 per cent in the density range 0.3 to 0.45 gm. cm.−3. The standard deviations of measurements of accumulation, considered elsewhere in this and the following sections, contain the contribution from this standard error of estimate.
To compare the measurements along the whole of the 1953 traverse, the accumulation data for the period July 1953-May 1954 obtained at sites between “Northice” and B 73 are extrapolated to give the accumulation in the period July 1953-July 1954. This is done in the following way. Of the stakes between Farvel Nunatak and “Northice”, 58 were measured on all three occasions in July 1953, May 1954 and July 1954. The .accumulations measured at each stake for the 10-month and 12-month periods are correlated by the normal statistical methods. The regression equation obtained is:

where v is the accumulation in gm. cm.−2 in the 12-month period and u is the accumulation in the 10-month period. (The correlation coefficient is 0.69 which, with 58 pairs of observations, is significant at <.001 level; that is, the probability that the correlation between the pairs of observations is accidental and that the two populations from which the observations are drawn are not related, is <.001. )
However, it is probable that the conditions between “Northice” (altitude 2345 m.) and B 73 (altitude 2514 m.) are more closely similar to those in the section from B 35 (lat. 77° 46.0′ N., long. 34° 20.0′ W., altitude 2154 m.) to “Northice”, than to the average of those in the whole region from Farvel Nunatak (altitude 1429 m.) to “Northice”. For the 20 pairs of observations in the section B 35 to “Northice”, the regression equation of v on u is:

(The correlation coefficient is 0.67, which is significant at 0.001 level.)
Adjusting the values of u in the section “Northice”—B 73, according to equation (2) and equation (3), values of v are obtained. The mean value of v obtained with equation (3) is 16.1 gm. cm.−2, while that with equation (2) is 14.9 gm. cm.−2, a difference of 7 per cent. Values given by equation (3) are probably more nearly correct, but the difference between the values obtained using equation (2) and (3) is regarded as the additional contribution to the standard deviation made by this extrapolation.
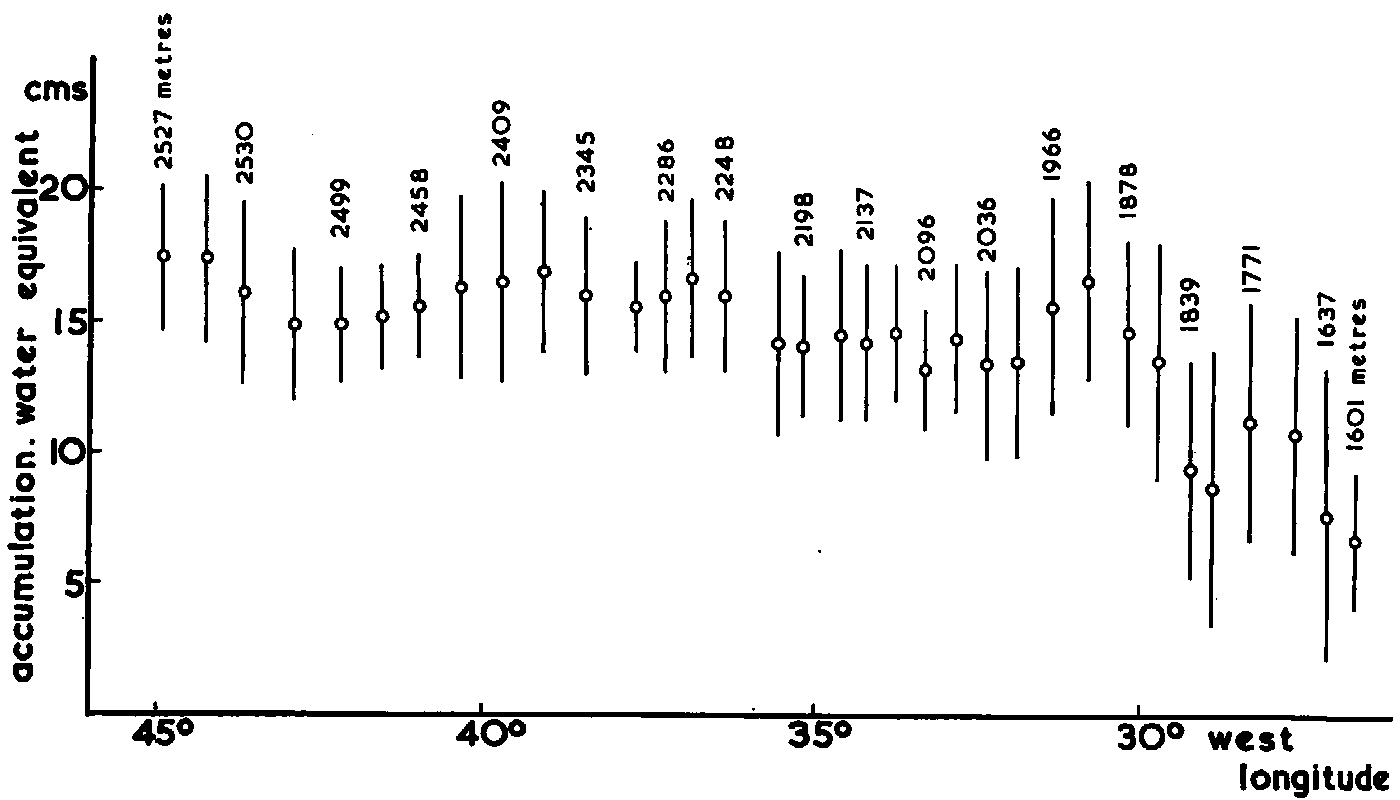
In Fig. 2 the means of the accumulations for the 12 months July 1953-July 1954, measured at 9 consecutive bamboos, and the corresponding standard deviations, are plotted against the longitude of the middle bamboo. The altitude of the middle station is also given.
Variation with longitude of snow accumulation in north Greenland in the period July 1953-July 1954. Mean of readings from 9 adjacent stakes: 0 bar length is twice standard deviation altitudes of centre stakes marked in metres
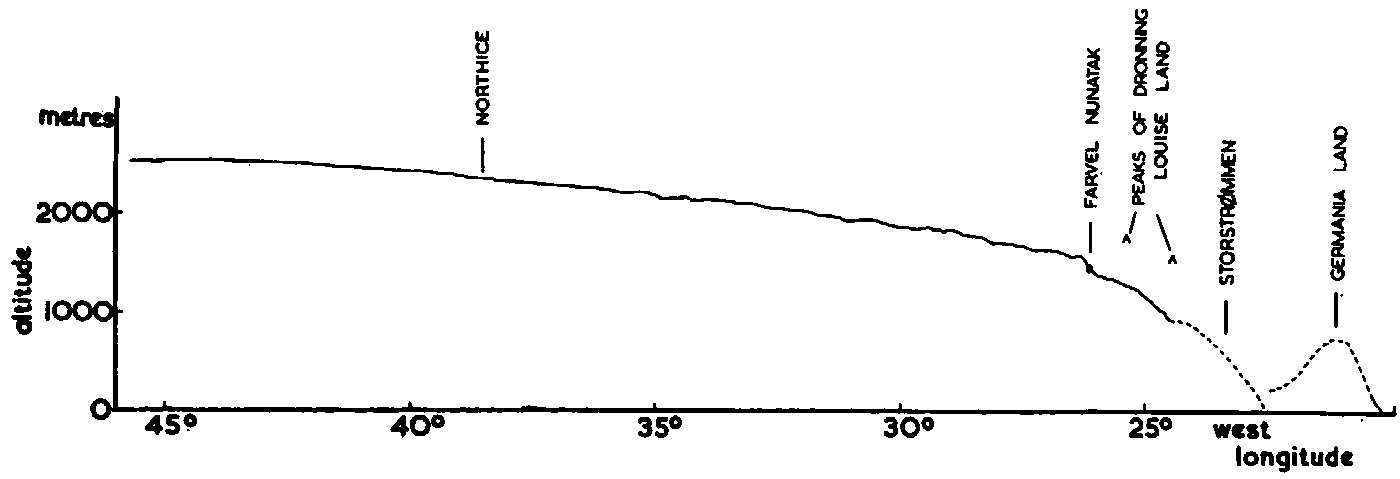
Cross-section of north Greenland along line of accumulation stakes. Length of base line approximately 540 km. Vertical exaggeration about 40 times
Because of the magnitude of the standard deviations no significance can be attached to small variations in the mean values but it is apparent that the accumulation in the area near Farvel Nunatak is less than that higher on the ice sheet.
To examine this point further, the whole available series of accumulation measurements for the year July 1953 July 1954 is divided into four sections. The mean accumulations and standard deviations obtained are:
-
Section 1, B 0 (1429 m.) to B 23 (1972 m.): 11.32±5.79 gm. cm.−2
-
Section 2, A 24 (1978 m.) to A 39 (2198 m.): 13.82±2.91 gm. cm.−2
-
Section 3, B 39 (2202 m.) to A 57 (2429 m.): 16.20±2.61 gm. cm.−2
-
Section 4, B 57 (2435 m.) to B 73 (2514 m.): 16.08±1.52 gm. cm.−2
The probability that the differences between the means are accidental is given in the following table:

Subdividing Section 1 into two equal parts, the following results are obtained:
-
Section 1(a), B 0 (1429 m.) to A 14 (1812 m.): 7.16±4.62 gm. cm.−2
-
Section 1(b), B 15 (1839 m.) to B 23 (2198 m.): 15.21±3.99 gm. cm.−2
The difference between the accumulation in sections 1 (a) and I (b) is significant at <.001 level, while the difference between sections 1 (b) and 2 is significant only at the .15 level.
Thus it is concluded that the snow accumulation for the year July 1953-July 1954 in the part of the traverse above 2200 m. was approximately 16 gm. cm.−2, but that it was significantly less at lower altitudes, being about 14 gm. cm.−2 between 1850 and 2200 m. and only 8 gm. cm.−2 between 1400 and 1850 m.
The prevailing surface wind on the inland ice is the katabatic wind, the velocity of which depends, amongst other factors, on the slope of the surface. Since the cross-section of the ice sheet is approximately parabolic, the katabatic wind velocity increases with decreasing altitude. The wind’s snow-carrying capacity varies with a power of the wind velocity (approximately with the cube of the velocity) so that the snow deflation varies with (approximately the square of) the horizontal gradient of the wind velocity, providing that there is a sufficient supply of snow for removal. Probably the observed decrease in the annual accumulation observed at altitudes below 2200 m. is mainly due to this increased deflation, rather than to lower precipitation.
3. Rammsonde Profiles on the Inland Ice
At the Iatitude of this traverse, 77–78° N., the amount of surface melting is negligible above an altitude of about 2250 m. (At “Northice”, altitude 2345 m., during the period September 1952 to July 1954 the temperature exceeded 0° C. only once—for a period of twelve hours during snowfall on 13 July 1954. Further west on the ice sheet, at the same latitude, the summer of 1954 was considered as being the warmest one for over 50 years.4) Above this altitude the dense firn layer due to summer melting is seldom more than 1 or 2 cm. thick, while the fine-grained snow falling in winter compacts to form a layer, often 10 cm. or more thick, which is denser than that formed by the coarser-grained snow falling in the warmer months. Therefore in the Rammsonde profiles obtained high on the ice sheet it is usually possible to distinguish the winter and summer layers with ease.
At altitudes b2elow about 1900 m. a considerable amount of summer melting occurs, so that the dense layer of the firnifed summer snow is more prominent than that of the winter snow.
Where the altitude lies between 1900 and 2250 m. the Rammsonde profiles are more difficult to interpret, since the winter and summer dense layers may be equally prominent. However, in most cases it has been possible to distinguish winter and summer layers, and in the profiles where interpretation was in doubt pits were dug to a depth of about a metre and the strata examined directly. A density profile was also made at one of these sites, B 20.
The densities of the layers were determined from the “resistance to penetration”, using equation (1) for the Iow density layers and

for the medium density layers (ρ = 0·39 to ρ = 0·54 gm.cm.−3)
The values of the mean accumulations determined from the Rammsonde profiles are listed in the following table.

Unfortunately the three most easterly profiles, B 2, A 4 and A 8, all occur at places where the accumulation in 1953–54 was much higher than the average for the region; therefore the data from these Rammsonde profiles are not represenative of the area near Farvel Nunatak.
4. Comparison of Accumulation Measurements in Eastern Half of Traverse
In section 4 (B 57 to B 73) the accumulation in July 1953 July 1954 was 16.08±1.52 gm. cm.−2. The mean annual value for the years 1948–53 (approximately) was 13.08±2.03 gm. cm.−2. The difference between the means is significant at <.001 level.
In other sections the corresponding figures are as follows:
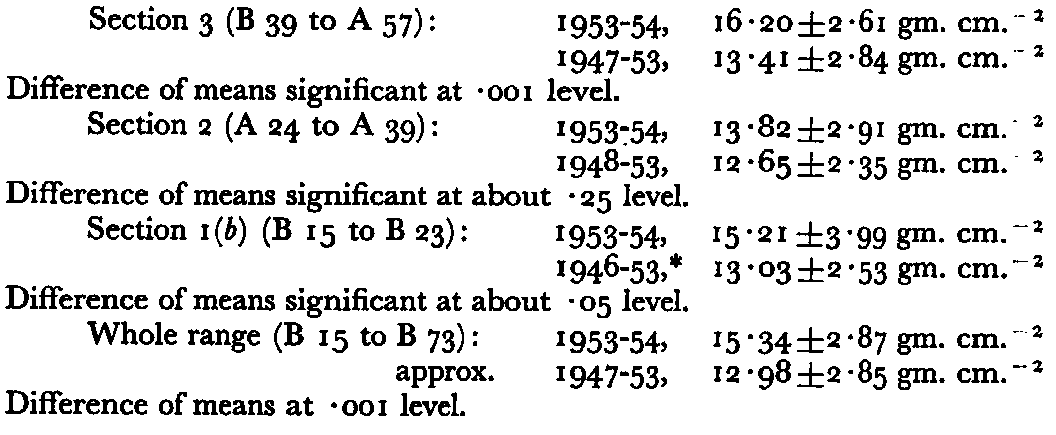
Difference of means at .001 level.
Thus the accumulation in the year July 1953-July 1954 was significantly greater than the mean accumulation during the preceding (6) years, the ratio being 1.18: 1. The decreased accumulation in altitudes less than about 2200 m., noted in 1953–54, is not apparent from the Rammsonde profiles; these show a constant accumulation of about 13 gm. cm.−2 over the whole range from 2500 to 1850 m. However, it is almost certain that the variation of accumulation in 1947–53 with altitude (down to about 1450 m.) should be of the same form as that observed in 1953–54.
5. Comparison of the Accumulation in the Eastern and Western Halves of the Traverse
As shown above, the annual accumulation in 1947–53, above about 1800 m. in the eastern half of the traverse is 12.98±2.85 gm. cm.−2 The corresponding figure for the western half is 13.15±1.98 gm. cm.−2. Thus for the part of the traverse above 1800 m. there is no significant variation with longitude of the annual accumulation in the years 1947–53.
This result contrasts strongly with that obtained from the measurements made by Koch and Wegener in 1913,Reference Koch and Wegener 5 during their crossing of the inland ice from southern Dronning Louise Land to Upernavik. They determined the snow accumulation for the year 1912–13 at 34 points on the inland ice at altitudes greater than 1900 m.: 18 of these were to the east of the highest point of their traverse (2935 m.), in latitudes varying from 75° 59′ N. to 74° 18′ N.; the latitude of the 16 observation points to the west of the highest point varied from 74° 11′ N. to 72° 48′ N. Treating their data in a manner similar to that used above, the following results are obtained:

Dividing the data from each half of the traverse into sections, it is found that on neither side of the ridge is there a significant variation of the accumulation with altitude. In other words, in 1912–13 the accumulation in the western half of the traverse was more than twice that in the eastern half, the demarcation line between these areas of equal accumulation coinciding with the main north-south ridge.
The distance between the traverses of Koch and Wegener and of B.N.G.E. increases from about 130 km. in long. 30° W. to 300 km. in the longitude of “Northice” and to 450 km. in long. 50° W.
6. Variation of Annual Accumulation With Time
Before the comparison between the present results and those of Koch and Wegener can be carried further it is necessary to consider variations of the annual accumulation in the intervening 40 years. Examinations of the strata (and associated observations) in deep pits have been made at “Eismitte” (lat. 70° 55′ N., long. 40° 38′ W., altitude about 2994 m.) in 1930,Reference Sorge and Brockamp 6 at Station Centrale (approximately same position as “Eismitte”) in 1949–51, at “Northice” in 1954 Reference Lister 7 and in north-west Greenland in 1954.Reference Bader 4 The results from Station Centrale have not yet been published, but from the work at “Eismitte”, “Northice” and in north-west Greenland, the accumulation at these sites has been determined for the periods 1909–31, 1877–1954 and 1908–54 respectively.
Applying the usual statistical treatment to the data, the following results are obtained. At “Eismitte” the annual accumulation for the period 1909–31 was 32.20±6.69 gm. cm.−2. During this period the annual accumulation decreased with time according to the equation

where x t is the accumulation in gm. cm.−2 in A.D. year t. (The correlation coefficient between accumulation and A.D. year is −0.64, which, with 22 pairs of observations, is significant at < .001 level.)
At “Northice” the plot of annual accumulation against time shows two predominant features, a decrease from 12 gm. cm.−2 in about 1880 to about 7 gm. cm.−2 in 1940, followed by an increase to about 11 gm. cm.−2 in 1950. Both of these features are statistically significant.
Between 1877 and 1940 the annual accumulation is given by the regression equation

(The correlation coefficient between accumulation and year is −0.49 which, with 64 pairs of observations, is significant at <.001 level.)
Between 1941 and 1954, the regression formula of accumulation on A.D. year is given byx

(The correlation coefficient is 0.672 which, with 14 pairs of observations, is significant at a level between .01 and .00 1.)
At the site in north-west Greenland the annual accumulation for the years 1908–54 was 43.0±12.5 gm. cm.−2 but no significant increase or decrease with time persisted over any appreciable part of this period.
Equation (6) indicates that in the years 1909–30 the annual accumulation at “Northice” decreased by about 12 per cent of the 1909 value; at “Eismitte” the decrease was about 30 per cent. In the absence of other evidence it must be assumed that the decrease in the annual accumulation in this period, in the central section of Koch and Wegener’s traverse, should have been about 20 per cent. However, if the increase in the accumulation since 1940, observed at “Northice”, has also occurred further south on the inland ice, then little difference is expected between the annual accumulation in 1912 and in the period covered by the present observations, approximately 1948–53. Therefore Koch and Wegener’s observed value for the accumulation east of the ridge, 15.9±3.7 gm. cm.−2, is not significantly different from that obtained further north, while their figure of 36.4±12.3 gm. cm.−2 for the accumulation west of the ridge is significantly different from that found in the present studies, and indicates that the climatic conditions vary greatly over a north-south distance of 400 km. on the west side of north Greenland.
7. Snow Accumulation near the Edge of the Inland Ice in north Greenland
The results given in the sections above are from the part of the ice sheet above about 1500 m. Below the firn line only pit studies and frequent measurement of large numbers of stakes can give accurate values of accumulation.
On the gravity traverse between Dronning Louise Land and Farvel Nunatak the number of such observations was too limited to be of value but, in his study of the regime of two glaciers in Dronning Louise Land, Lister Reference Lister 7 has obtained values for the annual accumulation. Over the part of the Britannia Gletscher lying between 223 and 700 m. altitude the mean accumulation in the year 1952–53 was about 20 gm. cm.−2, and in 1953–54 it was about 40 gm. cm.−2. On the Admiralty Gletscher, between 325 and approximately 1000 m. altitude, the mean accumulation from September 1952 to September 1953 was about 15 gm. cm.−2. The increased accumulation in 1953–54 is in concord with the increased accumulation in that year on the inland ice. However, it is difficult to relate accumulation on the distributory glaciers with that on the inland ice. In the first place the area of Dronning Louise Land and the nearby coast (in which there are many mountains more than 2000 m. high) is an orographic barrier to the north-easterly winds, so that the precipitation from these is expected to be greater on the low-lying glaciers than on the ice sheet. Secondly, the valleys of the glaciers are “wind funnels” for the outflowing katabatic winds. The amount of drift snow carried down the glaciers is greater than that spread over the upland areas between the glaciers but, since the wind velocity is increased by the “funnelling”, the proportion of the precipitation lost by deflation is greater than on the inland ice.
In 1954 C. S. Benson, of the Snow, Ice and Permafrost Research Establishment, determined the snow accumulation during the years 1950–54 at many points on a 400 km. traverse from the edge of the inland ice near Thule to station 2–100, lat. 77° N., long. 56° W., altitude 2150 m. See Fig. 1. Using data from pit studies and from Rammsonde profiles he obtains the following results for the average annual accumulation.Reference Benson 8
-
a. Between Tuto (lat. 76° 24′ N., long. 68° 20′ W., altitude 480 m.) and Station 1-0 (lat. 76° 43.2′ N., long. 65° 24.2′ W., altitude 1335 m.*); annual accumulation, approximately 55 gm. cm.−2.
-
b. From Station 1-0 to Station 2-0 (lat. 77° 14.1′ N., long. 62° 18.5′ W., altitude 1743 m.Footnote *); accumulation decreasing from approximately 55 gm. cm.−2 to a minimum of 17 gm. cm.−2 about 20 km. south-west of 2-0, and increasing to about 18 gm. cm.−2 at 2-0.
-
c. From Station 2-0 to Station 2–100; annual accumulation increasing from 18 gm. cm.−2 at Station 2-0 to about 37 gm. cm.−2 50 km. due east of Station 2-0 (altitude approximately 1830 m.), and remaining almost constant at 37 gm. cm.−2 as far as Station 2–100.
Benson’s explanation of the variation of accumulation along his traverse is as follows. A lobe of the ice sheet extends towards Thule. The section between Stations 1-0 and 2-0 runs along the crest, or slightly north of it, but the change of direction at Station 2-0 “brings the trail into a slightly different environment” and from 2-0 to 2-100 the observation points are on the south side of the crest, the general slope here being south-west, towards Melville Bay. Benson believes that the ridge line “may act as a partial orographic barrier to the transportation of moisture from Melville Bay. The present stratigraphical evidence indicates that the area north of the ridge line received less accumulation than the area to the south.”
In this connexion it is interesting to compare the results obtained at the B.N.G.E. Stations A 125, A 136 and A 143 with those obtained by Benson. These three sites are only about 130 km. north of Benson’s traverse, but are north of the ridge line and are on northwest facing slopes.Reference Bull 9 At the northern sites the average accumulation over the years 1948–54 is about 14 gm. cm.−2, compared with about 37 gm. cm.−2 (for the years 1950–54) south of the ridge. The similarities between the figures for the accumulation north of the ridge line (14 gm. cm.−2 at A 125 and 18 gm. cm.−2 near Benson’s Station 2-0), on the one hand, and those south of the ridge (37 gm. cm.−2 on Benson’s traverse and 36 gm. cm.−2 in the western half of Koch and Wegener’s traverse), on the other, is most striking.
In the absence of other evidence it thus appears that in the area north-east of Baffin Bay, bounded by the main north-south ridge and by the ridge of the lobe extending west and south-west towards Thule, the annual accumulation (about 35 gm. cm.−2) greatly exceeds that to the north and east (where it is only about 15 gm. cm.−2).
This difference in accumulation is obviously due to a combination of the differences of precipitation and of deflation in the areas on the two sides of the ridges but it is extremely difficult to distinguish between these two causes. To some extent the catchment area for precipitation carried by south-westerly winds from the Baffin Bay area may be bounded by the ridges, as Benson suggests, but the rate of change of slope across the ridges is very small so that its effect on the general south-westerly air circulation above the ice sheet is not likely to be abrupt.
Because the general direction of the wind above the ice sheet is south-westerly there is a considerable asymmetry in the surface wind system in north Greenland. At “Northice”, east of the main north-south ridge, the true katabatic wind is about 6 m.sec.−1 from 240°. Except for the 48-hour period immediately following a snowfall such a wind is not strong enough to cause drift, so that at “Northice” drifting snow only occurred when the katabatic wind was strengthened by the general south-westerly circulation above it. To the west of the main ridge the true katabatic wind is an easterly and thus the general circulation above the ice sheet opposes it. In the area close to the ridge the south-westerly is dominant (in the region of lat. 77° 30′ to 78° N., long. 46° to 49° W., the prevailing wind, as shown by the direction of the sastrugi, was 200°) but further west the easterly katabatic is dominant.
Thus it seems more likely that the marked change in accumulation across the ridges is associated with a change in the wind pattern rather than with large differences in the amount of precipitation but again it is difficult to account for a sudden change in the accumulation. Until the various terms in the equation

can be reliably estimated, the problem cannot be completely resolved. (Over most of the inland ice the effect of hoar frost accumulation and sublimation of the surface snow on the mass balance can probably be neglected.)
Koch and Wegener’s data show that the accumulation was twice as great on the west side of the ridge as on the east but covered only a limited number of years. Since the snowfall on the ice sheet in north Greenland in any one year comes in a limited number of storms (about 10 a year at “Northice” in the years 1952–54) the difference in accumulation along Koch and Wegener’s traverse might have been due merely to a much larger number of depressions than usual moving up the west coast of Greenland and fewer than usual moving up the east coast, so that their data would not be typical. However, the rest of the results cited above cover much longer periods.
A difference in the accumulation across the main and subsidiary ridges must produce one of two effects. Either the main north-south ridge is moving westwards and the east-west ridge southwards, or, if the ice sheet has reached an equilibrium shape, there must be a corresponding asymmetry in the glacial outflow. Accurate observations have not been continued for long enough to allow an opinion to be given on the first alternative, but the data quoted by Loewe Reference Loewe 10 and Bauer Reference Holtzscherer and Bauer 11 support the second. It is believed that the amount of ice discharged as icebergs into the Melville Bay area greatly exceeds that from the northern and north-eastern parts of the ice sheet. Further, the ice north of the ridge extending towards Thule is almost stationary while that to the south is quite heavily crevassed.
8. Precipitation Measurements at Coastal Stations
Because the annual accumulations at “Northice” and “Eismitte” have varied significantly with time, it is of interest to examine the precipitation records at coastal stations. Unfortunately, records for extended periods are available only from west coast stations and from east coast stations south of Angmagssalik (lat. 65° 36.5′ N., long. 37° 38′ W.).
“Eismitte” is east of the main north-south ridge and the annual accumulation there (32 gm. cm.−2 for the period 1909–31, 30 gm. cm.−2 in 1951,Reference Holtzscherer and Bauer 11 approx. 35 gm. cm.−2 for the period 1951–55 Reference Benson and Ragle 12 ) is similar to that in the eastern part of Benson’s traverse and in the western half of Koch and Wegener’s traverse. Hence it is reasonable to expect some inter-relation between the accumulation at “Eismitte” and that on the west coast. “Northice”, on the other hand, is east of the main ridge and from the foregoing arguments the interdependence between accumulation there and precipitation on the west coast is expected to be less. However, in the period 1909–31 the variations with time of the accumulation at “Northice“and “Eismitte” showed the same general form.
From Upernavik (lat. 72° 47′ N., long. 56° 09′ W.) an almost complete record of precipitation is available for 1875–1936. In the period 1877–1907 there is a general increase in the annual precipitation, while from 1911 to 1936 there is a decrease, though neither trend is statistically significant. At Jacobshavn (lat. 69° 13′ N., long. 51° 06′ W.) the precipitation decreased over the period 1877–1940, and also decreased in the period 1941–54, but again the trends are not statistically significant. The mean annual precipitations at Upernavik and Jacobshavn in these 60-year periods were 22 gm. cm.−2 and 24 gm. cm.−2 respectively —about 70 per cent of the annual accumulation at “Eismitte”. At Godthaab (lat. 64° 10.5′ N., long. 51° 43.5′ W.) there is a significant decrease in the annual precipitation in the period 1877–1940 (significant at a level between .01 and .001) and from 1941 to 1954 there is a slight increase, although this trend is not significant. The mean annual precipitation is about 54 gm. cm.−2. At the nearby station of Kornok (lat. 64° 26′ N., long. 50° 58′ W.) the decrease in the period 1877–1940 is barely significant (significant at .1 level only). The data from Ivigtut (lat. 61° 12′ N., long. 48° 10′ W.) show no significant change in the annual precipitation over the entire period 1877–1954 (the mean being 119 gm. cm.−2), while those from Angmagssalik show a significant decrease between 1877 and 1940 but also a decrease between 1941 and 1954, though this latter decrease is not statistically significant. The mean value of annual precipitation for the whole period was about 80 gm. cm.−2.
Briefly summarizing, the variations with time of the accumulation in the northern and central parts of the inland ice are not simply related to the variations in the annual precipitation recorded at coastal stations. As far as the “Eismitte” results are concerned, this conclusion is supported by Loewe Reference Loewe 10 who found that there was no significant correlation between the annual accumulation at “Eismitte” in the period 1911–31 and the precipitation at Upernavik.
9. Total Annual Accumulation on the Greenland Ice Sheet
The estimates of the mass balance of the Greenland Ice Sheet which have been made Reference Loewe 13 , Reference Bauer 14 have been based on Loewe’s figures for the mean ablation and accumulation. Using all the information available in 1936 he obtained 31 gm. cm.−2 as the mean annual accumulation. With the new experimental results given above it is possible to review this estimate.
Data are still scanty from the part of Greenland south of the traverse made by de Quervain and Mercanton from Disko Bay to Angmagssalik in 1913,Reference Quervain and Mercanton 15 and the only method of estimating the annual accumulation is by taking account of the annual precipitation at the coastal stations in the area. However, the precipitation at the coastal station is affected greatly by its topographical location so that no close relationship can be established between coastal precipitation and the accumulation on the ice sheet in the same latitudes. Therefore the estimates of accumulation on the southern tip of the ice sheet—about 45 gm. cm.−2 in lat. 68° N., increasing to about 65 gm. cm.−2 in lat. 62° N.—are subject to large errors, probably ±30 per cent. Fortunately the area concerned is only about one seventh of the total area of the inland ice, so that the estimate of the total accumulation is less in error.
Further north there are now sufficient observations (assuming that the accumulation in 1912–13 was the same as in 1948–53) for the accumulation to be calculated with an accuracy of about ±8 per cent.
The value obtained for the annual accumulation is 497 ±50 km.3 water equivalent, assuming that the area of the ice sheet is 1.726 × 10⁶ km.2.Reference Bauer 14 Thus the mean annual accumulation is 29±3 gm. cm.−2, which is in good agreement with Loewe’s value.
Over the last few years measurements have been made of the variation of ablation with altitude in the Disko Bay area, and in north-east and north-west Greenland; until these data are published it is pointless to revise the existing calculations of the total mass balance of the ice sheet.
10. Acknowledgements
It is a pleasure to thank J. W. Oakley and W. S. B. Paterson, of the British North Greenland Expedition, for their assistance in making the Rammsonde profiles, and the many members who helped in measuring the bamboo stakes. I am also grateful to the Director of the Danish Meteorological Institute, for supplying me with the precipitation records from the Greenland coastal stations, and to R. A. Hamilton for his valuable criticisms of the manuscript of this paper.



