


Introduction
The value of used farm machinery is an important factor in farm management and assessing the health of the agricultural sector. The United States Department of Agriculture (USDA) projects that US farms have 370 billion dollars of Machinery and vehicle assets, representing 8.4% of total farm assets (U.S. Department of Agriculture, Economic Research Service 2025). However, technological innovations are allowing farm machines to capture value previously provided by other inputs (e.g., autonomous machines (labor) and “see-and-spray” (crop protection)), and the relative importance of US farm machinery assets will likely increase. In the farm machinery industry, the US market is estimated to be valued at 38.1 billion dollars annually (Immerwahr Reference Immerwahr2025). Yet, the value of used machinery has a direct impact on new machinery sales, through the practice of “trading-in”. This study uses auction data and hedonic regressions to examine the characteristics and market factors that affect the auction price of used farm tractors.
Previous literature shows that modeling the value of used farm machinery is a complex combination of machine characteristics and market factors. Pre-dating the hedonic model of Griliches (Reference Griliches1961); Rosen (Reference Rosen1974) provided the conceptual foundation for capturing the role of evolving attachments in the value of durable goods. This framework was applied by Fettig (Reference Fettig1963) to farm tractors, showing that the value of horsepower and engine type were responsible for most of the variation in the valuation of farm tractors from 1950 to 1962. With the popularization of the hedonic framework, machines’ age and usage were shown as important characteristics in understanding value (Allison Jr et al. Reference Allison, Mark, Burdine and Shockley2022; Cross and Perry Reference Cross and Perry1995; Diekmann et al. Reference Diekmann, Roe and Batte2008; Perry et al. Reference Perry, Bayaner and Nixon1990; Perry and Nixon Reference Perry and Nixon1991; Wilson Reference Wilson2010). Additionally, factors related to the market were shown to drive sales price. Specifically, the market timing and location (Diekmann et al. Reference Diekmann, Roe and Batte2008), macroeconomic conditions (Diekmann et al. Reference Diekmann, Roe and Batte2008; Perry et al. Reference Perry, Bayaner and Nixon1990; Perry and Nixon Reference Perry and Nixon1991), and tax policy (Reid and Bradford Reference Reid and Bradford1983) have been shown to be important factors in used machinery values. In contrast, in a recent study on used planters, Allison Jr et al. (Reference Allison, Mark, Burdine and Shockley2022) show that greater macroeconomic market factors are not a key driver of sales price.
This study uses detailed farm machinery auction data to examine the effects of machine and market characteristics on the auction price of used tractors. The data are collected from the proprietary database of Tractor Zoom, an online farm machinery marketplace and data solutions provider. Specifically, the data reflects 6,821 individual US auction observations of tractors of 300 to 450 horsepower from 2006 to 2024. We use the detailed machine and market characteristics in a hedonic framework and ordinary least squares to estimate the parameters of interest.
Our estimates suggest three practical findings. First, we find a non-linear relationship between usage and auction price. Although this result is not novel (shown in (Cross and Perry Reference Cross and Perry1995; Diekmann et al. Reference Diekmann, Roe and Batte2008; Perry et al. Reference Perry, Bayaner and Nixon1990; Perry and Nixon Reference Perry and Nixon1991)) we use a usage categorization that is common in the farm machinery industry to generate practical interpretation. Our results suggest that an additional hour of usage for a tractor with less than 500 hours, decreases the auction price by an average of $118. An additional hour on a tractor with 500 to 1000 hours decreases the auction price by an average of $57. The observed pattern continues for groups with higher usage, culminating in an additional hour being estimated to decrease the auction price by $2 for tractors with more than 10,000 hours. Yet, for this usage category the estimate is only weakly significant. Second, consistent with the findings for planters (Allison Jr et al. Reference Allison, Mark, Burdine and Shockley2022), machinery brands are associated with different used tractor prices. John Deere exhibits the largest relative auction price premium, whereas New Holland is associated with the largest relative auction discount. There are many factors that influence this price differential, like original sales price, but these differences can help inform farm machinery replacement decisions. Third, as discussed in Cross and Perry (Reference Cross and Perry1995) and Perry et al. (Reference Perry, Bayaner and Nixon1990), tractors sold at retirement auctions exhibit the largest auction premium relative to consignment, dealer, estate, and liquidation. This result is likely a combination of increased buyer information on machine history, including maintenance and condition, and the nonrandom selection of machines sold at farm retirement auctions.
We believe this study has implications for farmers and their machinery replacement decisions. First, when farmers are considering the replacement of machinery, they should assess whether the added benefits of purchasing a newer tractor exceed the estimated per hour decrease in the auction price. In commodity production, managing production costs through strategic machinery replacement is an important risk management tool. If the benefits of newer tractors and their associated technologies do not outweigh the increased repair costs and depreciation from additional use, it may be economically rational for farmers to extend the operating life of their existing equipment. Second, as farmers evaluate machinery replacement, they can examine the brand premium or discount associated with used tractors. Understanding the future value of a used machine can be helpful in comparing similar machines from different brands. Third, farmers should consider delaying purchases of farm machines to periods when other farmers are busy. Our results suggest a greater than $12,000 discount for tractors sold in June, September, and October. There are likely several mechanisms which influence this dynamic. Farmers are busy, and may not be considering machinery replacement. These months are associated with high field activity in typical row crop production, especially in the Midwest US. Knowing the seasonal workload, sellers may hold more desirable equipment for other periods, and as a result, the sample of machinery sold during these months is relatively less desirable. However, farmers may want to explore whether the potential discount may be large enough to add an additional task during their already busy seasons.
The remainder of this manuscript is organized as follows. We first discuss the details of the data provided by Tractor Zoom. Then we discuss how this data is used in a hedonic framework to identify the effects of machine and market characteristics on used tractor auction prices. This discussion is followed by the presentation of our ordinary least squares estimates of a hedonic price model and then we conclude.
Research design
The aim of this study is to examine how machine characteristics and market factors affect the auction price of used farm tractors in the United States. We use established insights from previous studies to develop a hedonic model of tractor prices and estimate the model using a rich dataset from Tractor Zoom to provide insights for farmers, lenders, and farm machinery professionals. In this section we discuss the used tractor auction dataset from Tractor Zoom and how this data is appropriate to examine the role of factors previously identified as important in determining used tractor price. Specifically, we discuss variables related to machine characteristics and market factors. The section will conclude with the hedonic framework, including the variables described in the data.
Data
The key component of our analysis is a rich dataset of used tractor auctions from Tractor Zoom, an online farm machinery marketplace that provides listings to available heavy equipment for sale, market insights, and data solutions for equipment businesses. The data is collected from the Tractor Zoom proprietary database of 300 to 450 HP tractors sold at auction in the United States. Tractor Zoom was established in 2017, and in building their database, they have collaborated with various agents in the used machinery marketplace to collect auction and retail sales data. As a result, their database includes sales from 2000 to 2025. However, due to their growth and attention, recent years exhibit relatively more observations. This dataset is valuable because it represents a large and modern sample with detailed characteristics of marketplace and machinery.
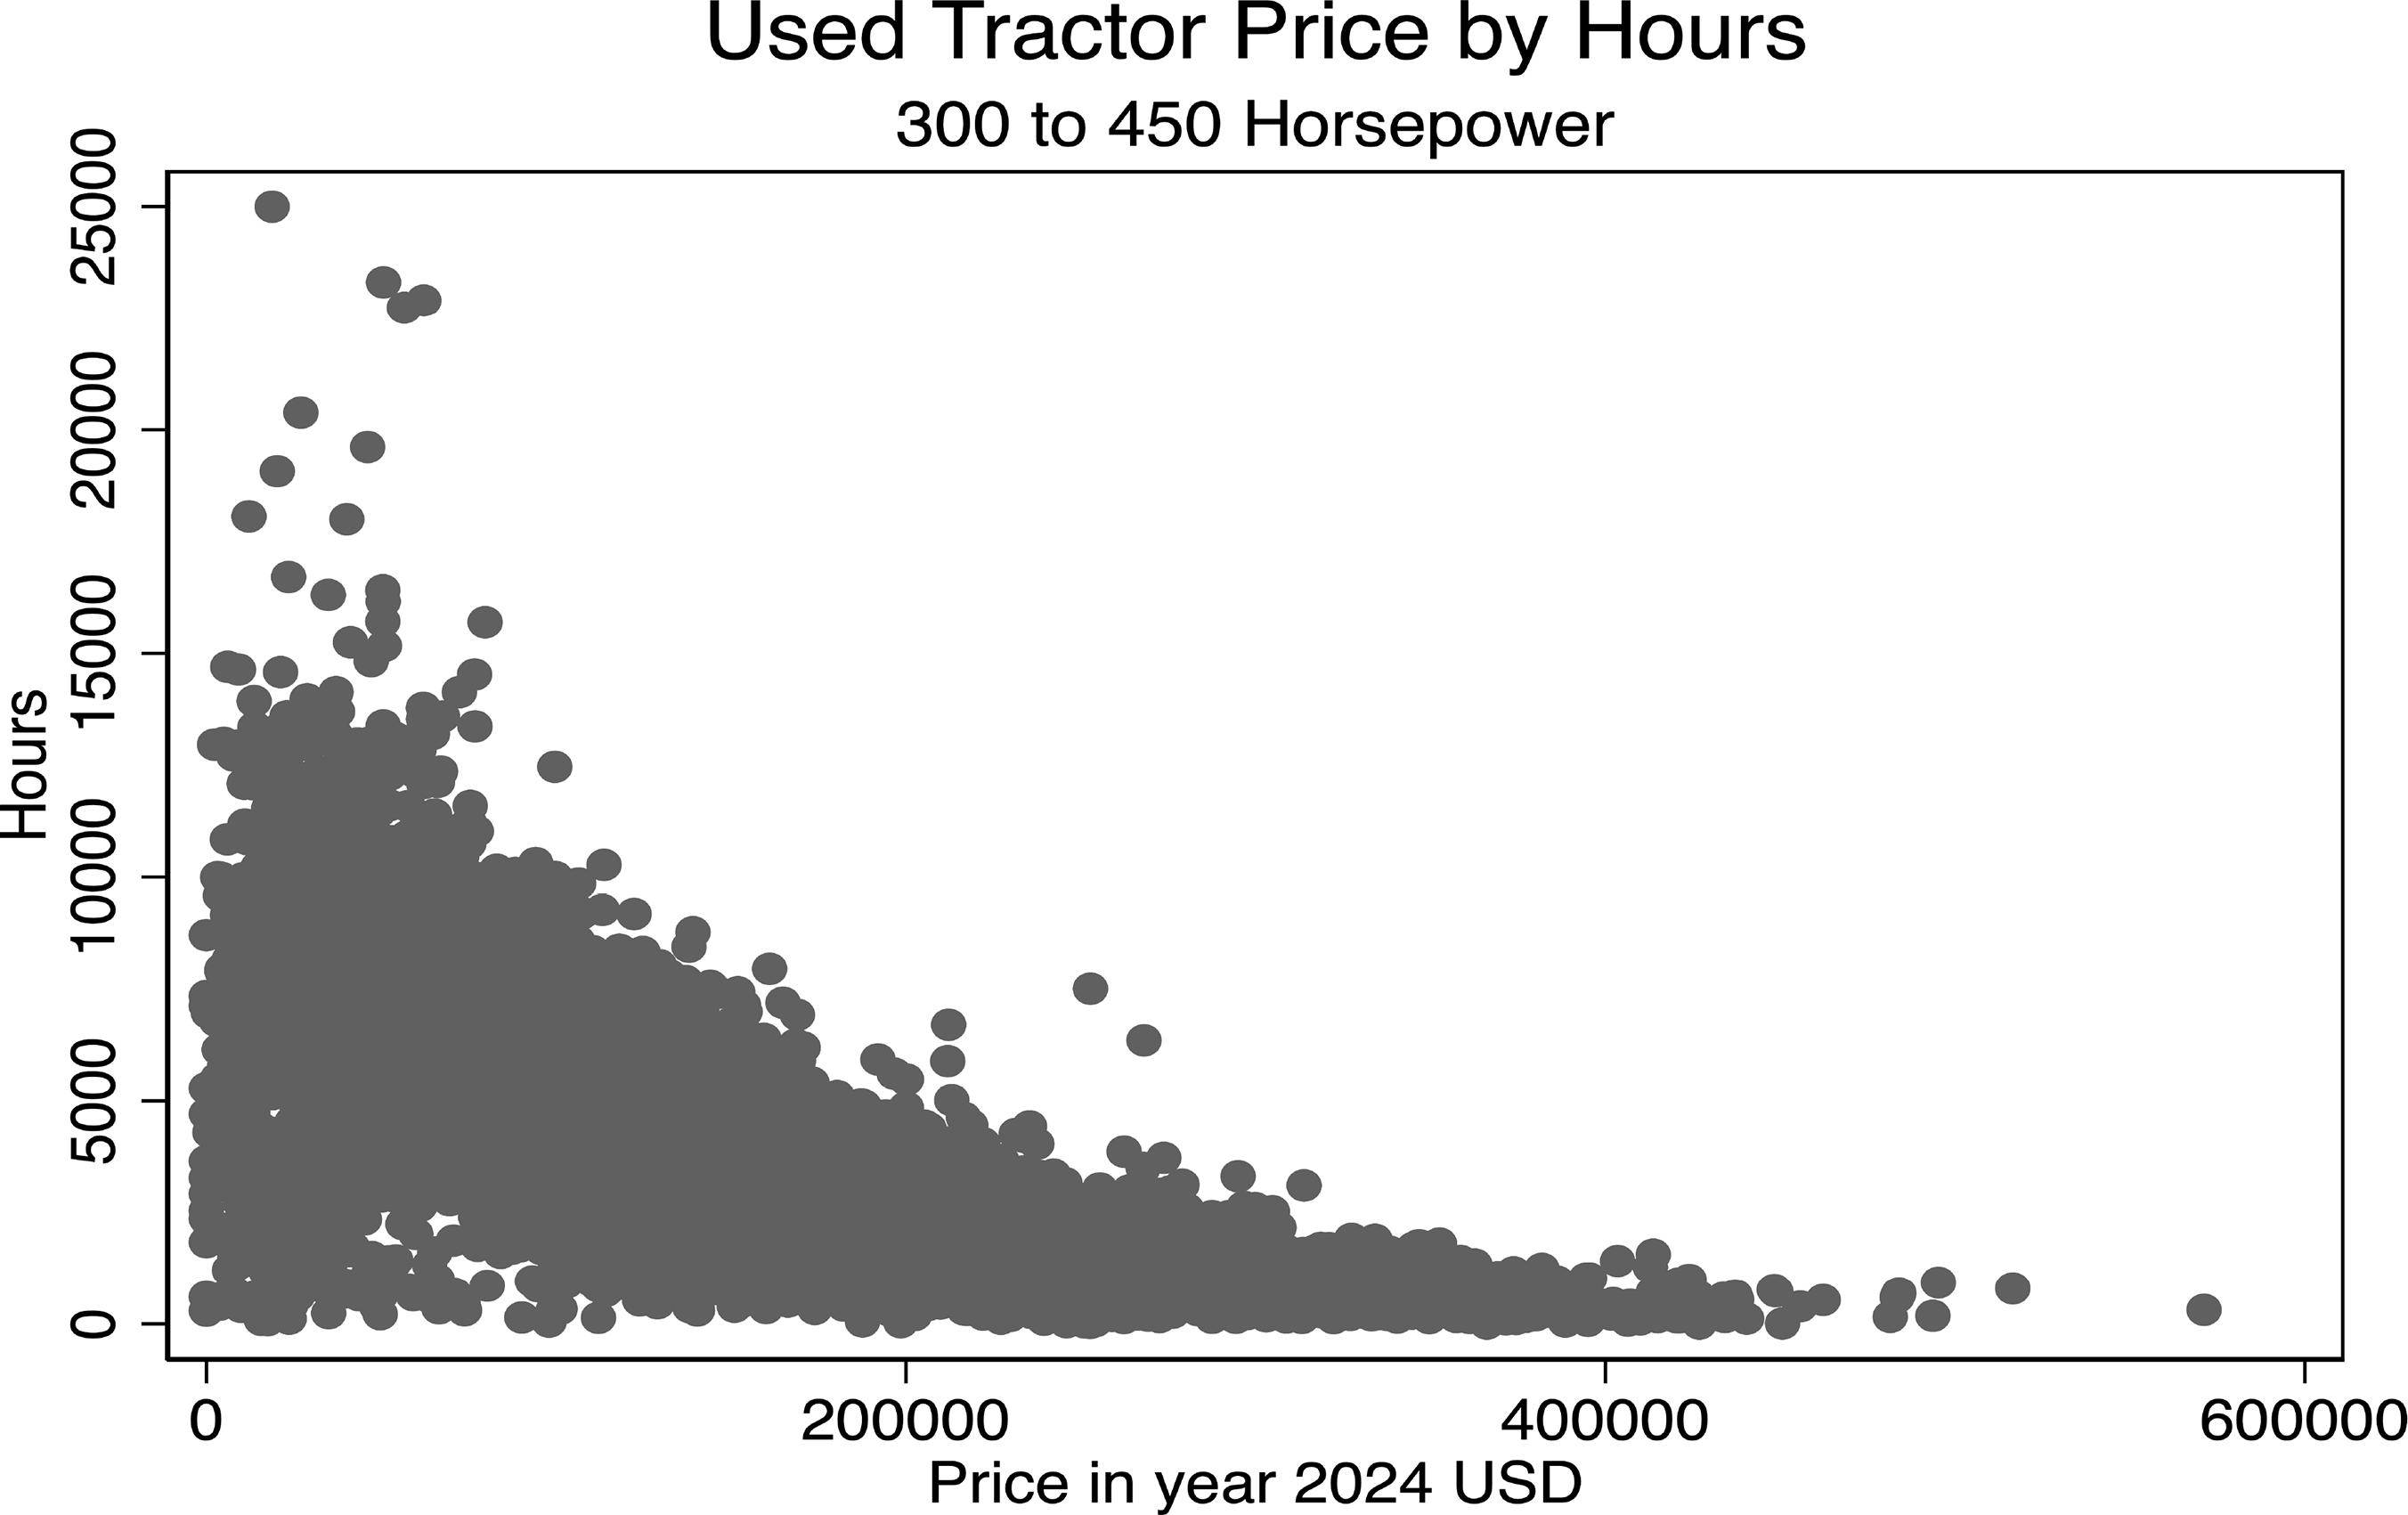
Figure 1 reports the observed real auction price of tractors and usage in hours. Although, we would expect the non-linear relationship demonstrated in Figure 1 (i.e., Diekmann et al. Reference Diekmann, Roe and Batte2008; Perry and Nixon Reference Perry and Nixon1991), the scatterplot obscures important heterogeneity in the observed data. For example, within the 300 to 450 horsepower tractor category there are several different chassis/drivetrain configurations, two-wheel drive fixed frame, four-wheel drive fixed frame (Mechanical Front Wheel Drive (MFWD)), two track fixed frame, two track fixed frame and MFWD, four-wheel drive articulated, and four track articulated. Each of these drivetrain configurations represents different new sales price, and as a result, impact the relationship between usage and auction price. Further, there are additional used tractor characteristics and market factors that impact the sales price, like age, horsepower, seasonality, sales mechanism, and macroeconomic factors. The auction data provided by Tractor Zoom includes variables to address this heterogeneity.
Usage and real auction price for used farm tractors 300 to 450 horsepower in 2024 USD (Inflation adjusted with US producer price index for farm machinery and equipment manufacturing).

Machinery characteristics
Table 1 reports the machine characteristic summary statistics for used tractors by brand. The machinery brand is an important factor in farm machinery price (Allison Jr et al. Reference Allison, Mark, Burdine and Shockley2022; Cross and Perry Reference Cross and Perry1995; Perry et al. Reference Perry, Bayaner and Nixon1990; Reid and Bradford Reference Reid and Bradford1983). For 300 to 450 horsepower tractor models, John Deere, Case IH, Challenger, New Holland, and Versatile exhibited the highest number of auction observations in the Tractor Zoom database. Although this dataset does not contain the universe of used tractor sales in the US, the fact that John Deere tractor sales make up 63.6% of the observed data, is suggestive of their market share in this tractor category. The auction data reported in Table 1 represent real values adjusted to 2024 dollars using the US Producer Price Index for farm machinery and equipment manufacturing (FRED 2025). This modeling choice obscures the fact that many of these observed transactions are for tractors of varying ages. As a result, the reported values do not capture the additional technological attributes of late model tractors. Despite this aggregation, the average auction price for John Deere is the highest, followed by Case IH, Challenger, New Holland, and Versatile.
Average tractor price and count by make and hour category
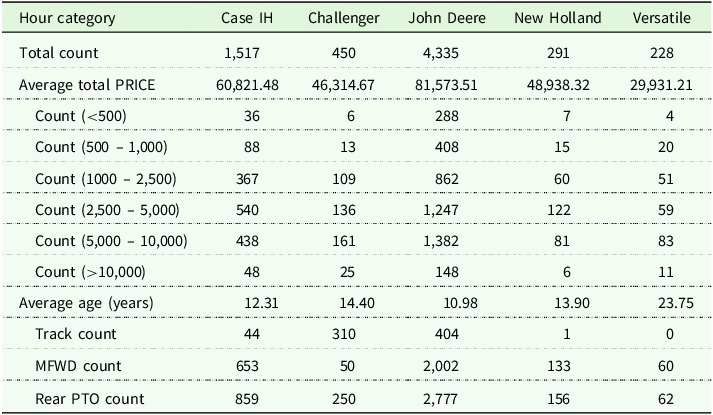
Note: Average price is inflation-adjusted (base year 2024).
We model usage in hours as a continuous variable and interact it with hour-range indicators commonly used by farm machinery industry professionals. Perry et al. (Reference Perry, Bayaner and Nixon1990) and Perry and Nixon (Reference Perry and Nixon1991) show that usage has a non-linear effect on auction price. While these effects can be estimated using a single continuous measure of hours, interpretation is not always intuitive. Industry professionals often evaluate machines within commonly recognized usage ranges. Therefore, we construct six representative hour categories and interact them with hours to allow marginal effects to vary flexibly across usage ranges while maintaining industry-relevant interpretation. Table 1 reports the number of observed tractor auctions by our defined usage ranges, less than 500 hours, 500 to 1,000 hours, 1,000 to 2,500 hours, 2,500 to 5,000 hours, 5,000 to 10,000, and greater than 10,000 hours. There are 2,104 auctions for tractors with 2,500 to 5,000 hours and 2,145 auctions for tractors with 5,000 to 10,000 hours. Together these two usage categories represent 62.4% of the auctions observed. This pattern appears to be relatively consistent for each brand.
The Tractor Zoom database also contains information about the tractor age, drivetrain, and whether the machine has a rear power take-off (PTO). Within the data, each year, we observe tractors of various ages being sold for each brand. Tractor age is related to the features and technology of the manufacturing year, and as a result, is an important driver of auction price. In this dataset, John Deere and Case IH tractors tend to be the newest on average, while Versatile tractors are much older with an average age of about 24. As mentioned previously, the 300 to 450 horsepower characterization represents a complex set of drivetrain configurations. Additionally, when contextualized through time, many of the observed late model tractors within this category are configured as row-crop models. However, as recently as the year 2000 several of the observed manufacturers did not manufacture a fixed frame row-crop tractor with 300 horsepower. In contrast, in current model years John Deere, Case IH, New Holland, and Versatile all feature this drivetrain configuration with more than 300 horsepower. Challenger is currently the only firm manufacturing fixed-frame tracked tractors in this horsepower range. Challenger and John Deere account for the largest number of track type tractors in the dataset, while Case IH and John Deere have the most tractors equipped with MFWD and rear PTO. Ultimately, the drive train configuration is an important determinant of new purchase price and the corresponding value in the used market. In addition to the drivetrain differences, the presence of a Rear PTO indicates the tractor can be used for an expanded set of functions. This feature increases the new purchase price and the value in the used market.
Market characteristics
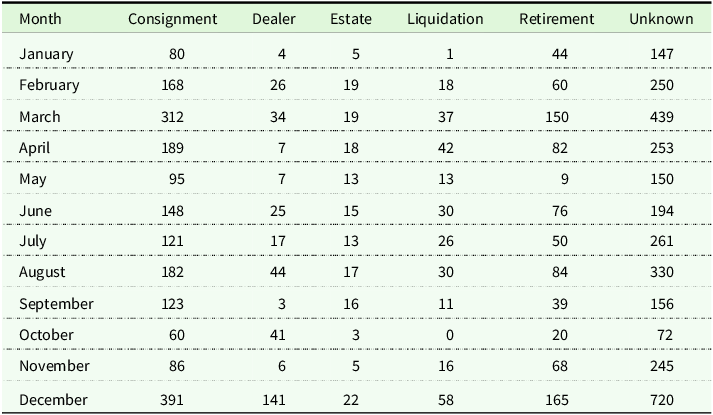
Table 2 reports the number of observed used tractor auctions by market type for each month. There is seasonality in the used farm machinery market (Allison Jr et al. Reference Allison, Mark, Burdine and Shockley2022). This dynamic is likely due to crop production and tax implications. For example, Midwest US corn and soybean planting primarily takes place in April and May, and harvest in September and October. As a result, farmers in this region are busy with field operations and likely not engaged in machinery replacement decisions. We observe 12.9% of used tractor auctions occurring during April and May and 8% during the harvest time frame. In contrast, in March, before planting in the Midwest, we observe 14.5% of auctions. Likely, US tax policy also impacts the seasonality of used tractor prices (Hadrich et al. Reference C. Hadrich, Larsen and Olson2013; Reid and Bradford Reference Reid and Bradford1983). In our dataset, we observe 21.9% of auctions taking place in December.
Monthly tractor sales by auction type
The market mechanism is also an important determinant of used machine price. Diekmann et al. (Reference Diekmann, Roe and Batte2008) show that tractors sold on e-bay have a different expected sales price than those purchased through in-person mechanisms. Additionally, Cross and Perry (Reference Cross and Perry1995) and Perry et al. (Reference Perry, Bayaner and Nixon1990) show that machines sold in retirement auctions exhibit higher prices relative to other sales mechanisms. However, the authors highlight that the premium could be due to the increase in information related to usage or the fact that a retirement auction is a nonrandom sample of machinery. Identifying this effect is beyond the scope of this study, but illustrates the important difference between the sales mechanism.
Table 2 reports statistics for the auction mechanisms that are compiled by Tractor Zoom. The largest category is Unknown with 47% of the observed auctions. However, in recent years, the prominence of this category is less pronounced, influenced by Tractor Zoom’s commitment to data collection. Consignment auctions represent 28.7% and retirement auction represent 12.4% of auctions. Together the categories Dealer, Estate, and Liquidation represent 11.8% of auctions. As alluded to previously, the sales mechanism provides important economic context. Tractor Zoom has specific definitions for the sales mechanisms reported in Table 2. In a consignment auction, the owner of the tractor will pay a fee, potentially a percentage of selling price (typically 5–8%), for an agent to facilitate a sale. In contrast, in the dealer auction, the dealer is the owner and pays a fee, potentially a percentage of the selling price (3–4%), for an agent to facilitate a sale. Typically, dealer auctions are motivated by the desire to reduce inventory for cash flow or achieving management metrics. A liquidation auction describes a scenario where a farmer goes out of business, and the lender must liquidate the collateralized machinery assets. In this scenario, the lender is the owner of the tractor and pays the agent a fee to facilitate a sale. An estate auction characterizes the scenario when machinery is sold after the owner is deceased. A retirement auction characterizes machinery sold upon the retirement of the owner operator.
Empirical model
We use the hedonic modeling framework of Rosen (Reference Rosen1974), following Allison Jr et al. (Reference Allison, Mark, Burdine and Shockley2022); Cross and Perry (Reference Cross and Perry1995); Diekmann et al. (Reference Diekmann, Roe and Batte2008); Wilson (Reference Wilson2010), to examine the degree to which machine characteristics and market factors affect the auction price of used 300 to 450 horsepower tractors. Although this framework and aim is not novel, the detailed data provided by Tractor Zoom enables a more robust examination of these effects. Specifically, the large number of observations over time affords the ability to capture the non-linear effects of usage while controlling for macroeconomic factors, through the US Producer Price Index for farm machinery and equipment manufacturing (FRED 2025) and year fixed effects.
The general hedonic model is reported as follows:
 $${\rm Auction\ Price}_{it} = \alpha + \beta {\rm Characteristics}'_{it} + \delta {\rm Market}'_{it} + \tau _t + \varepsilon _{it},$$
where Auction Price it is the inflation adjusted auction price of tractor i in year t, α is a common intercept, Characteristics′ it is a vector of characteristics for tractor i and year t, Market′ it is a vector of market characteristics for the auction of tractor i in year t, τ t is a year-fixed effect for year t, and ϵ it is a white-noise error term. Our parameters of interest are β and δ. Previous research shows that the macroeconomic conditions impact the values of used farm machinery (Cross and Perry Reference Cross and Perry1995). τ t controls for the effects of macroeconomic factors in each year that may not be captured by the US Producer Price Index for farm machinery and equipment manufacturing. For example, supply chain disruptions due to the COVID 19 pandemic imposed significant effects on the farm machinery industry (Association of Equipment Manufacturers 2022), τ t controls for effects for the 300 to 450 horsepower used tractor market that may be different than the entire industry.
Previous research shows that usage and horsepower are determinants of farm machinery sales prices, and that the effects, at least for usage, are not linear (Perry and Nixon Reference Perry and Nixon1991). As a result, we hypothesize that there are likely interaction effects between usage and horsepower that influence price. Additionally, as previously mentioned, age may also be an explanatory factor for tractor prices. Consider two similar tractors with 800 hours, one manufactured in 2010 and one in 2020. The newer tractor is likely to exhibit a higher sales price. We include corresponding interaction terms to control for the hypothesized effects.
The estimation equation is as follows:
 $$\eqalign{ {{\rm{Auction \,Pric}}{{\rm{e}}_{it}}} = \;& {\alpha + {\beta _1}{\rm{Hour}}{{\rm{s}}_{it}} + {\beta _2}{\rm{Ag}}{{\rm{e}}_{it}} + {\beta _3}({\rm{Hour}}{{\rm{s}}_{it}} \times {\rm{Ag}}{{\rm{e}}_{it}})} \cr {} & { + {\beta _4}{D_{{\rm{(500 \,\,to\,\, 1000 \,\,hrs)}}it}} + {\beta _5}{D_{{\rm{(1000\,\,to\,\,2500\,\,hrs)}}it}} + {\beta _6}{D_{{\rm{(2500\,\,to\,\,5000\,\,hrs)}}it}}} \cr {} & { + {\beta _7}{D_{{\rm{(5000\,\,to\,\,10000 \,\,hrs}})it}} + {\beta _8}({D_{{\rm{(500\,\,to\,\,1000\,\,hrs)}}it}} \times {\rm{Hour}}{{\rm{s}}_{it}})} \cr {} & { + {\beta _9}({D_{{\rm{(1000\,\,to\,\,2500\,\,hrs)}}it}} \times {\rm{Hour}}{{\rm{s}}_{it}}) + {\beta _{10}}({D_{{\rm{(2500\,\,to\,\,5000\,\,hrs)}}it}} \times {\rm{Hour}}{{\rm{s}}_{it}})} \cr {} & { + {\beta _{11}}({D_{{\rm{(5000\,\,to\,\,10000\,\,hrs)}}it}} \times {\rm{Hour}}{{\rm{s}}_{it}}) + {\beta _{12}}({D_{{\rm{(500\,\,to\,\,1000\,\,hrs)}}it}} \times {\rm{Ag}}{{\rm{e}}_{it}})} \cr {} & { + {\beta _{13}}({D_{{\rm{(1000\,\,to\,\,2500\,\,hrs)}}it}} \times {\rm{Ag}}{{\rm{e}}_{it}}) + {\beta _{14}}({D_{{\rm{(2500\,\,to\,\,5000\,\,hrs)}}it}} \times {\rm{Ag}}{{\rm{e}}_{it}})} \cr {} & { + {\beta _{15}}({D_{{\rm{(500\,\,to\,\,1000\,\,hrs)}}it}} \times {\rm{Hour}}{{\rm{s}}_{it}} \times {\rm{Ag}}{{\rm{e}}_{it}})} \cr {} & {+ {\beta _{16}}({D_{{\rm{(1000\,\,to\,\,2500\,\,hrs)}}it}} \times {\rm{Hour}}{{\rm{s}}_{it}} \times {\rm{Ag}}{{\rm{e}}_{it}})} \cr {} & { + {\beta _{17}}({D_{{\rm{(2500\,\,to\,\,5000\,\,hrs)}}it}} \times {\rm{Hour}}{{\rm{s}}_{it}} \times {\rm{Ag}}{{\rm{e}}_{it}}) } \cr {} & {+ {\beta _{18}}({D_{{\rm{(5000\,\,to\,\,10000\,\,hrs)}}it}} \times {\rm{Hour}}{{\rm{s}}_{it}} \times {\rm{Ag}}{{\rm{e}}_{it}})} \cr {} & { + {\beta _{19}}{\rm{H}}{{\rm{P}}_{it}} + {\beta _{20}}{D_{{\rm{(MFWD)}}it}} + {\beta _{21}}{D_{{\rm{(Track)}}it}} } \cr {} & {+ {\beta _{22}}{D_{{\rm{(Rear PTO)}}it}} + {\beta _{23}}({D_{{\rm{(Rear PTO)}}it}} \times {\rm{H}}{{\rm{P}}_{it}})} \cr {} & { + {\beta _{24}}{D_{{\rm{(Rear PTO)}}it}} \times {\rm{H}}{{\rm{P}}_{it}} \times {D_{{\rm{(MFWD)}}it}} } \cr {} & {+ {\beta _{25}}{D_{{\rm{(Rear PTO)}}it}} \times {\rm{H}}{{\rm{P}}_{it}} \times {D_{{\rm{(Track)}}it}}} \cr {} & { + {\beta _{26}}{D_{{\rm{(Challenger)}}it}} + {\beta _{27}}{D_{{\rm{(John Deere)}}it}} + {\beta _{28}}{D_{{\rm{(New Holland)}}it}}} \cr {} & { + {\beta _{29}}{D_{{\rm{(Versatile)}}it}}} { + {\delta _1}{D_{{\rm{(Dealer)}}it}} + {\delta _2}{D_{{\rm{(Estate)}}it}} + {\delta _3}{D_{{\rm{(Liquidation)}}it}} } \cr {} & {+ {\delta _4}{D_{{\rm{(Retirement)}}it}} + {\delta _5}{D_{{\rm{(Unknown)}}it}}} \cr {} & { + {\delta _6}{D_{{\rm{(Feb)}}it}} + {\delta _7}{D_{{\rm{(Mar)}}it}} + {\delta _8}{D_{{\rm{(Apr)}}it}} + {\delta _9}{D_{{\rm{(May)}}it}} + {\delta _{10}}{D_{{\rm{(Jun)}}it}} } \cr {} & {+ {\delta _{11}}{D_{{\rm{(Jul)}}it}} + {\delta _{12}}{D_{{\rm{(Aug)}}it}} + {\delta _{13}}{D_{{\rm{(Sep)}}it}} + {\delta _{14}}{D_{{\rm{(Oct)}}it}} + {\delta _{15}}{D_{{\rm{(Nov)}}it}} } \cr {} & {+ {\delta _{16}}{D_{{\rm{(Dec)}}it}} + {\tau _t} + {\varepsilon _{it}},} \cr }$$
where β ([β 1, β 29]) corresponds to the machine characteristics parameter of interest in (1). Furthermore, δ ([δ 1, δ 16]) corresponds to the parameter of the market factor of interest in (1). We believe that these modeling choices facilitate the assumption that ϵ it is white noise.
Results
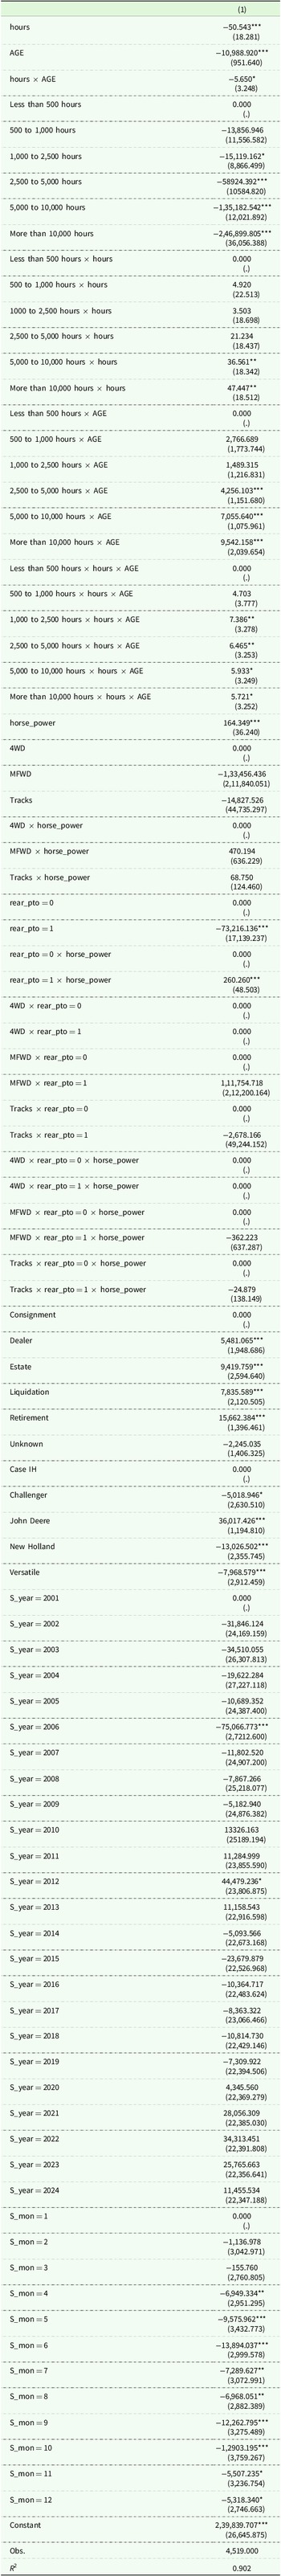
Table 3 reports the calculated marginal effects of machine characteristics on auction prices of used tractors of 300 to 450 horsepower from our ordinary least squares estimates of (2). Our aim is to use detailed, current data to update practical information related to farmers’ machinery replacement decisions. However, (2) includes many interactions between tractor characteristics, resulting in ordinary least squares estimates that are difficult to interpret. As a result, we report our results as calculated marginal effects for common tractor characteristics. The full ordinary least squares estimates of (2) are available in the appendix. After omitting auction observations with missing variables, we estimate (2) with 4,519 observations. The model fit (R 2 = 0.902) is comparable to or slightly higher than prior hedonic applications in agricultural machinery markets. While R 2 values are not directly comparable across different samples and specifications, our explanatory power is broadly consistent with estimates reported by Allison Jr et al. (Reference Allison, Mark, Burdine and Shockley2022) (OLS R 2 0.855), Diekmann et al. (Reference Diekmann, Roe and Batte2008) (endogenous switching regression overall R 2 0.860), and Perry et al. (Reference Perry, Bayaner and Nixon1990) (box–cox R 2 0.803).
Calculated marginal effects from ordinary least squares estimates on price of second-hand farm tractors from 300 to 450 horsepower in 2024 USD
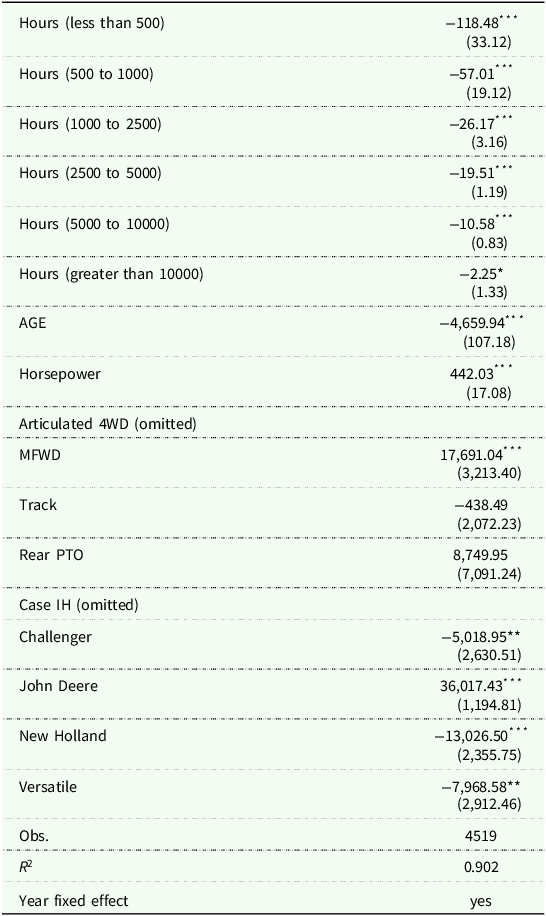
Standard errors in parentheses * p < 0.10, ** p < 0.05, * * * p < 0.010 Estimates are in 2024 USD.
An additional hour of use decreases the auction price of tractors at a decreasing rate. The first six reported coefficients reflect the marginal effect of an additional hour of use for tractors. For example, the estimate for the first variable Hours (less than 500) suggests that if a tractor has less than 500 hours, on average, an additional hour will decrease the auction price by $118. The decrease associated with an additional hour of use decreases as the total hours of use increase. For tractors with 500 to 1,000 hours, an additional hour of use decreases auction price by $57. For tractors with 1,000 to 2,500 hours, an additional hour of use decreases auction price by $26. This trend continues, $20 for tractors with 2,500 to 5,000 hours, $11 for tractors with 5,000 to 10,000 hours, and a weakly significant decrease of $2 in auction price for tractors with over 10,000 hours. It is important to note that these marginal effects are calculated assuming that all other characteristics are held equal, and at average values. As a result, the estimated $2 impact of an additional hour of use for tractors over 10,000 hours could also be interpreted that other factors are more important for determining auction price for tractors with this degree of use, for example, condition (Allison Jr et al. Reference Allison, Mark, Burdine and Shockley2022).
In addition to usage, several other machine characteristics impact auction price. An additional year of age decreases the auction price of a tractor by $4,660. Based on this result, if there were two identical tractors with 800 hours, we would expect that the tractor manufactured a year earlier to have a $4,660 lower auction price. From (2) we estimate the interaction between age and usage, the OLS coefficient is weakly significant and negative. This finding suggests, that some of the non-linear marginal effects reported in Table 3 are attributable to age and usage decreasing auction price. In contrast, an additional horsepower is associated with an increase in auction price of $442. Given that rated horsepower within a tractor brand is usually a 25 or 30 horsepower increase between models of a series, we would expect an increase of more than $11,000 for the next larger model. Lastly, the 300 to 450 HP tractor category includes tractors of different frame configurations and drive types. In our modeling, we omit tractors that are classified as articulated four wheel drive. As a result, the estimates for MFWD or track are in reference to the omitted tractor being an articulated four wheel drive. A MFWD tractor increases the expected auction price by $17,588. However, a tractor having tracks is not estimated to impact auction price. This result may be related to the fact that the dataset contains fixed frame tractors with two tracks, fixed frame tractors with two tracks and two wheels, fixed frame tractors with four tracks, and articulated tractors with four tracks. As more track type tractors reach the used marketplace, we would anticipate the ability to examine the relationship between these different drive types.
In the used farm machinery marketplace, there are differences in the observed auction prices between the farm machinery brands. It is important to note, that our analysis does not take into account the original sales price, and as a result, our results shouldn’t be interpreted as a brand premium or discount, but as an observed difference in auction price. In our modeling, we restrict our data to brands with at least 200 observed tractor auctions. As a result, our data represents tractors from Case IH, Challenger, John Deere, New Holland, and Versatile. The reported estimates of Table 3 are in reference to Case IH being the omitted category. Therefore, the estimates for Challenger, John Deere, New Holland, and Versatile are relative to a similar Case IH tractor. John Deere is estimated to have a $36,017 increase in auction price when compared to Case IH. The remaining three brands are estimated to have a decrease in auction price relative to Case IH: $5,019 for Challenger, $13,027 for New Holland, and $7,969 for Versatile.
Table 4 reports the calculated marginal effects of market characteristics on the auction price of tractors from our ordinary least squares estimates of (2). The full ordinary least squares estimates of (2) are available in the appendix. The top portion of Table 4 reports marginal effects for the type of auction, consignment, dealer, estate, liquidation, or retirement. As mentioned previously, these auctions types have different characteristics, and as a result, likely impact the machines transacted.
Calculated marginal effects from ordinary least squares estimates on price of second-hand farm tractors from 300 to 450 horsepower
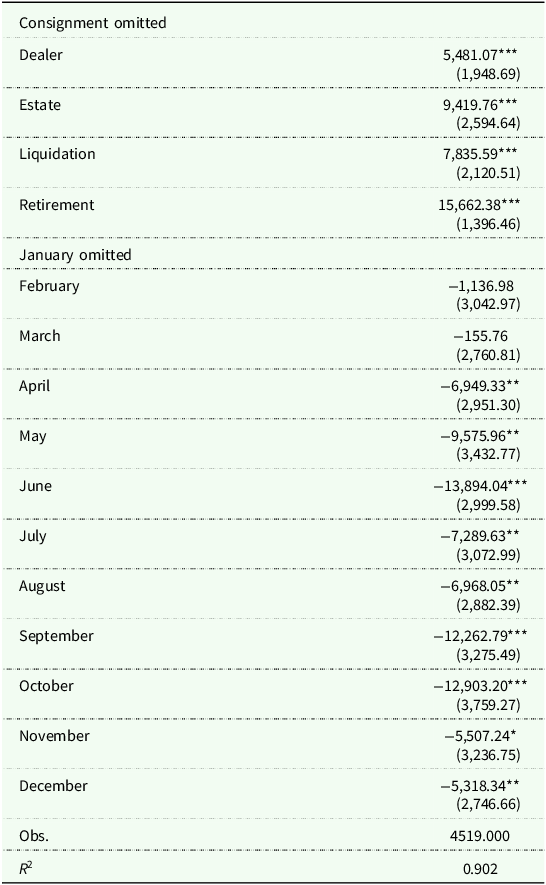
Standard errors in parentheses *p < 0.10, **p < 0.05, *** p < 0.010 Estimates are in 2024 USD.
Used tractors sold through retirement auctions exhibit the highest relative prices to all other types of auction. Consignment auction is the omitted category. As such, a retirement auction is associated with an increase in the auction price of $15,662. This result is likely driven by the additional information and familiarity a buyer may have when purchasing a tractor. Compared to a consignment auction, a dealer auction is associated with an increase of $5,481, an estate auction is associated with an increase of $9,420, and a liquidation auction is associated with an increase of $7,836.
Used tractors sold in January, February, and March have higher auction prices, on average, than tractors sold the rest of the year. For our estimation, January is the omitted month, and as a result, all reported marginal effects are in reference to tractors sold in January. The estimates for February and March are negative but not statistically different from zero. Whereas, the remaining months all exhibit estimates that are associated with lower prices. The months with the largest discounted prices correspond to months during the US Midwest row crop growing seasons May for planting, June, and September and October for harvesting. These results suggest that farmers exhibit some degree of seasonality in their machinery purchasing.
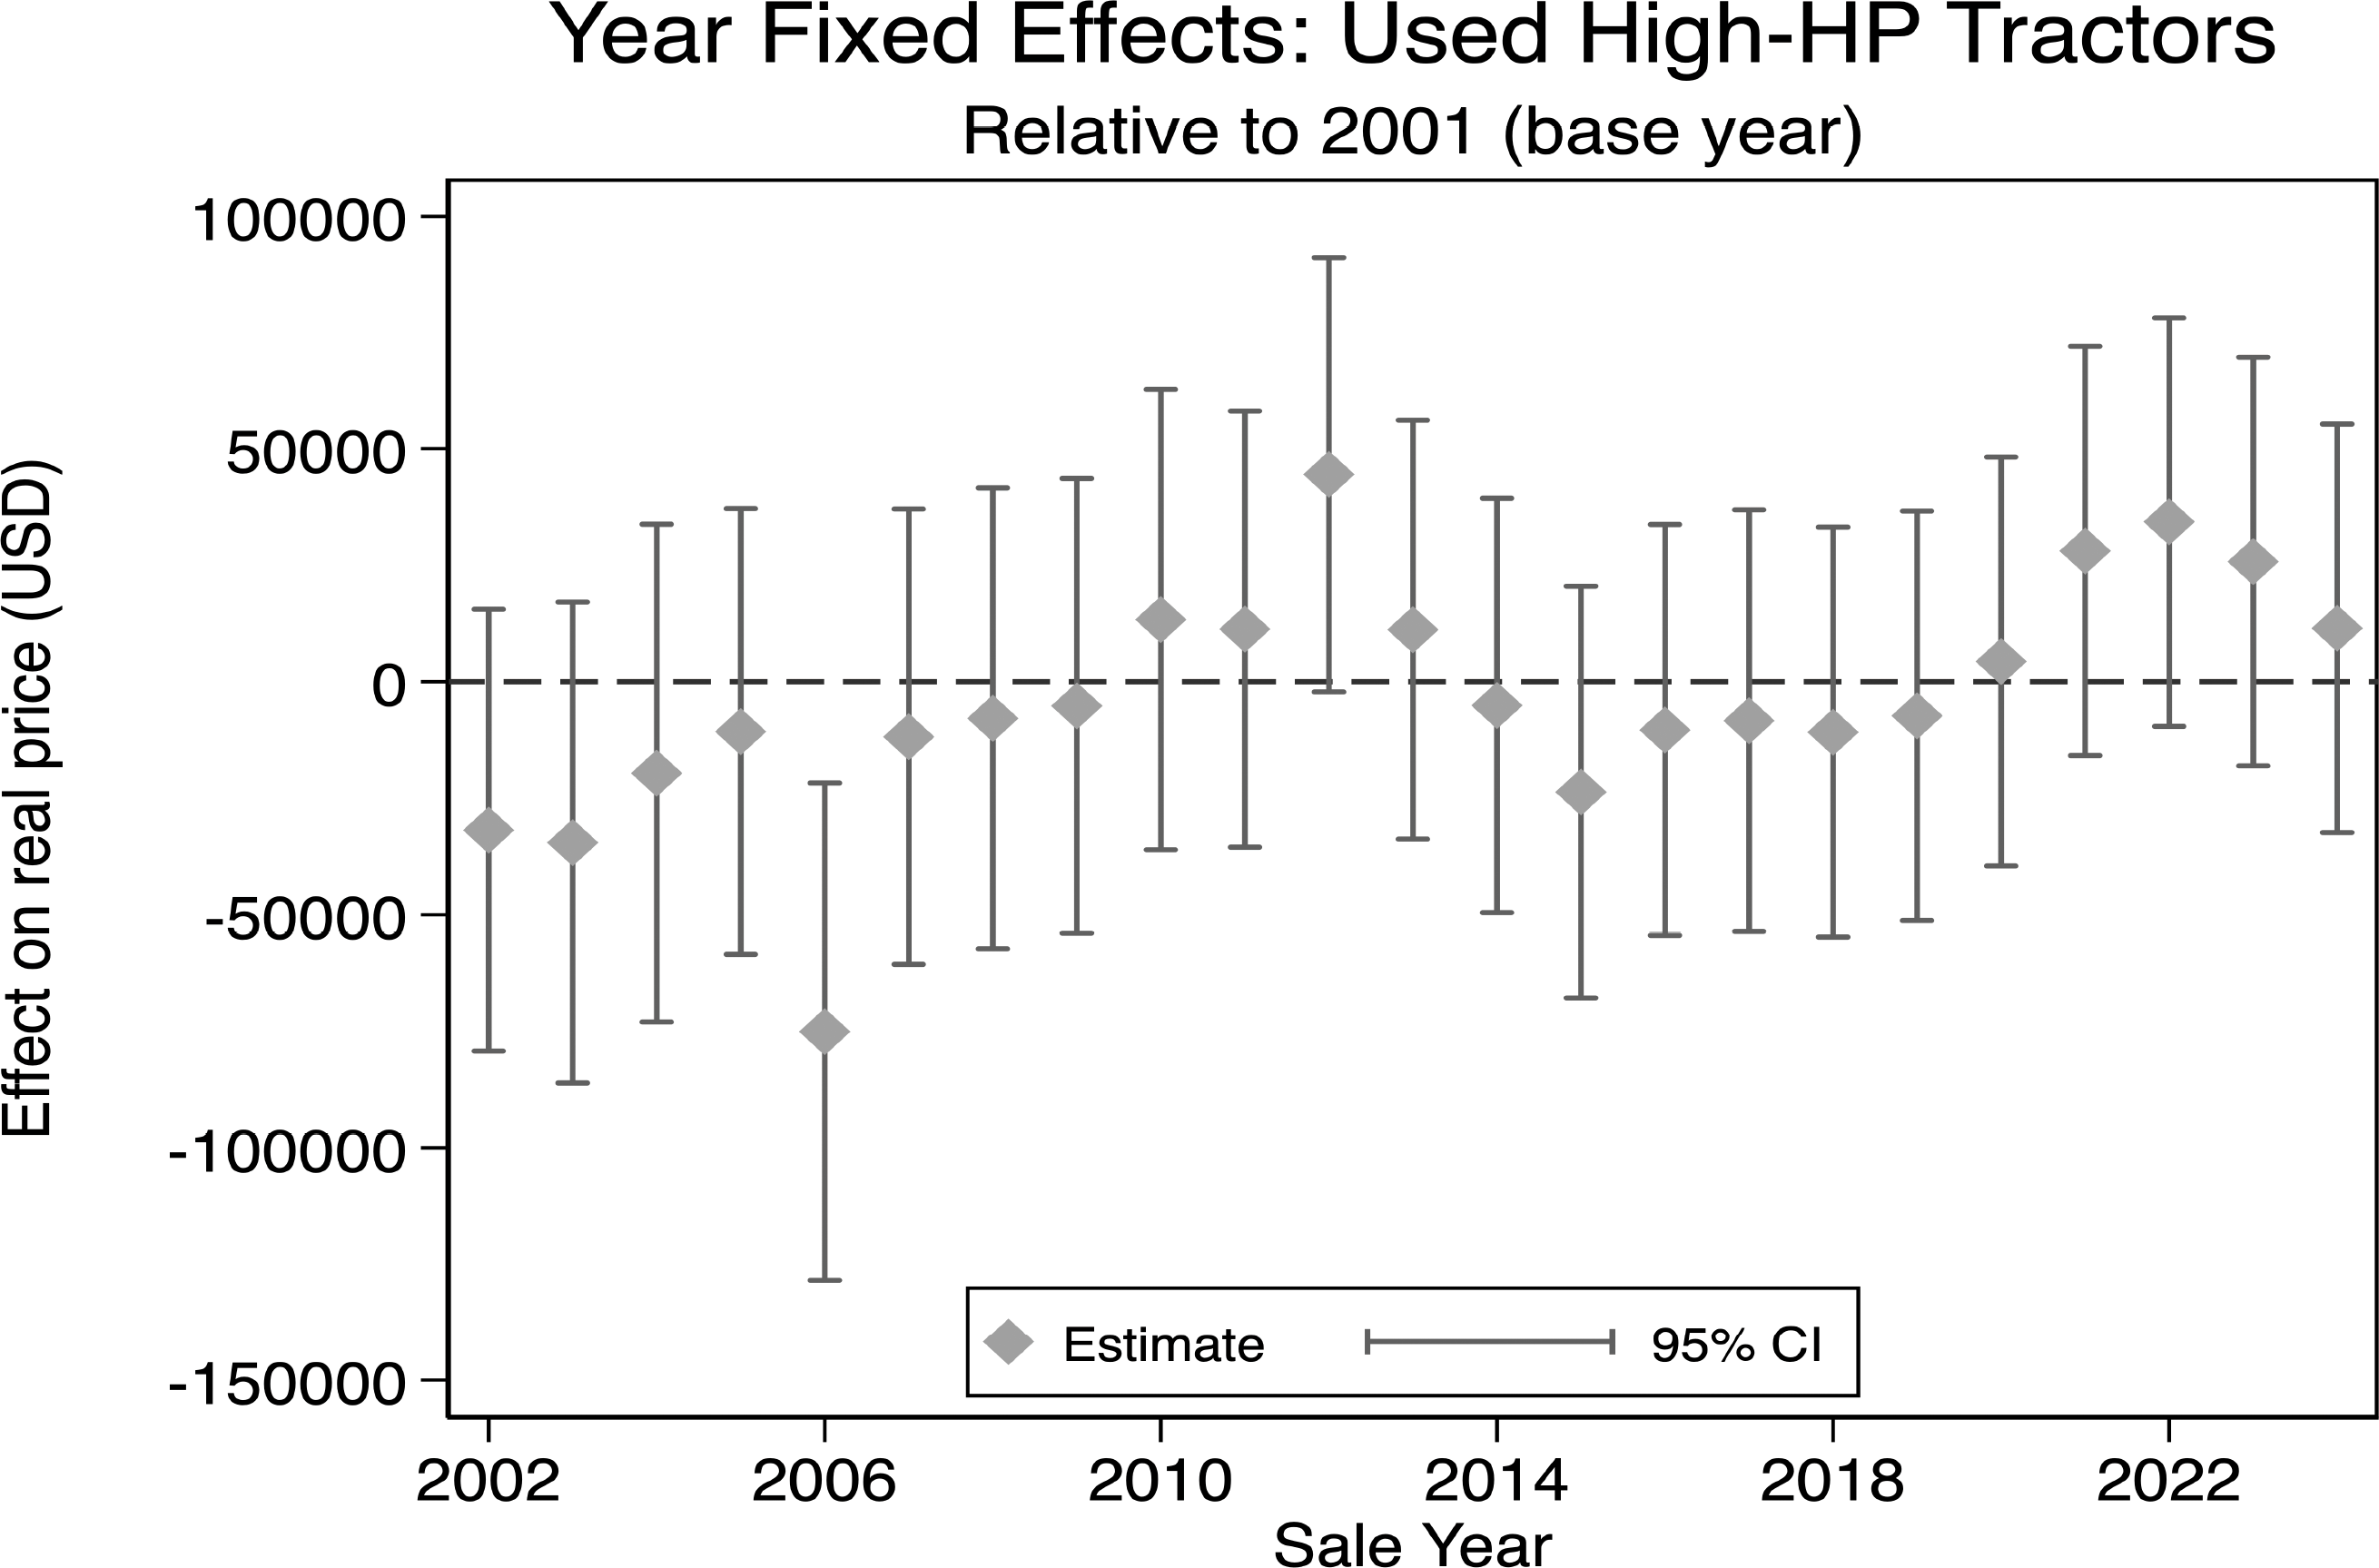
Figure 2 plots the estimated yearly fixed effects and 95% confidence interval. Only 2006 is estimated to be statistically different than the 2001 base year. As previously mentioned the supply chain challenges associated with the COVID-19 pandemic do not appear in our estimates for 2020, 2021, or 2022. However, the choice to deflate all auction prices by the US Producer Price Index for farm machinery and equipment manufacturing (FRED 2025) must capture much of these annual effects. As a robustness check, we re-estimate (2) without year fixed effects. The model fit decreases from an R 2 of 0.903 to 0.880. Although year fixed effects improve model fit, much of the variation is explained by observed machine and market characteristics.
Year fixed effects on tractor auction price.
Conclusion
This study uses detailed auction data for used 300 to 450 horsepower farm tractors and hedonic framework estimated with ordinary least squares to examine the effect of machine characteristics and market factors on auction price. The data is collected from the proprietary database of Tractor Zoom, an online farm machinery marketplace and data solutions provider. The richness of the data allows us to provide updated estimates for the roles of machine characteristics, like usage and age, and market factors, like sales mechanism and seasonality, while controlling for the macroeconomic factors that also influence the farm machinery industry.
Our findings suggest that usage has a significant and nonlinear effect on auction price, machinery brands exhibit different price patterns, tractors sold at retirement auctions exhibit a price premium, and there is a discount for tractors sold during the Midwest US crop growing season. An additional hour of use is estimated to decrease auction price by $118 for tractors with less than 500 hours, $57 for tractors with 500 to 1,000 hours, $26 for tractors with 1,000 to 2,500 hours, $20 for tractors with 2500 to 5,000 hours, and $11 for tractors with 5,000 to 10,000 hours. However, in tractors with greater than 10,000 hours, the estimate is weakly significant. John Deere tractors are estimated to have the highest average auction price, followed by Case IH, Challenger, Versatile, and New Holland. These relative differences do not take into account original selling price, and as a result, should not be interpreted as a brand premium or discount. Additionally, retirement auctions exhibit the largest auction premium, followed by estate, liquidation, dealer, and consignment auction, relatively. Lastly, used tractors sold in January, February, and March exhibit the largest auction premium, and April, June, September, and October exhibit the largest auction discount, respectively.
Although our analysis features the rich Tractor Zoom dataset, further analysis will benefit from additional observations. This study is narrowed to one category of tractor, 300 to 450 horsepower, but there is significant heterogeneity in the features of these machines, namely the drivetrain. As mentioned previously, there are several different drivetrain configurations within this category, and these differences have important impacts on original and used values. As data availability increases, the ability to estimate effects on particular drivetrain configurations or even specific models would strengthen the identification. Additionally, Allison Jr et al. (Reference Allison, Mark, Burdine and Shockley2022) show that factors like condition are important in used farm machinery sales price. Future studies may benefit from having information related to the condition of farm machinery. Further, our analysis did not include original sales price of tractors. Future studies could include this information and provide valuable insights on modern depreciation patterns of farm machinery.
We believe that our analysis has implications for farmers, lenders, and professionals in the farm machinery industry. Farmers will want to consider the nonlinear effects of usage on their farm machinery replacement decisions. Understanding the tradeoffs between increased repairs and maintenance and returns to updated technology may allow for more efficient management of farm machinery fleets. For example, if repair costs and technological deficits do not exceed roughly $90 per hour, replacing a tractor with 1,000 to 2,500 hours with one having fewer than 500 hours would be unlikely to be cost-justified on financial grounds alone. For lenders, a farmers’ machinery is an important component of the income statement and balance sheet, and as a result, impacts collateral values. Lenders can use our estimates to characterize farm customers’ machinery assets. Specifically, our estimates can be used to approximate equipment lease residual values. Lastly, farm machinery professionals may be able to capture premiums by choosing the timing of auctions. Planning auctions for the first part of the calendar year would increase predicted auction prices by as much at $13,984 (June). Additionally, our estimates are suggestive of the nonlinear valuation of usage on farm machinery and potential challenges of moving low hour tractors to a 2nd and 3rd buyer. Depending on the needs of farms and pricing level, the price differential of lightly used tractors may make farms delay replacement decisions, or shift their preference to tractors with higher usage. Although this dynamic is beyond the scope of this analysis, our results point to this important feature of the farm machinery industry.
Data availability statement
Data is proprietary property of Tractor Zoom, and may be available upon request.
Funding statement
None.
Competing interests
None declared.
LLM chatbot use
Claude (Sonnet 4.5) were used to assist with editing and refining the manuscript text.
Appendix
Ordinary least squares estimates of hedonic pricing model for 300 to 450 horsepower tractors
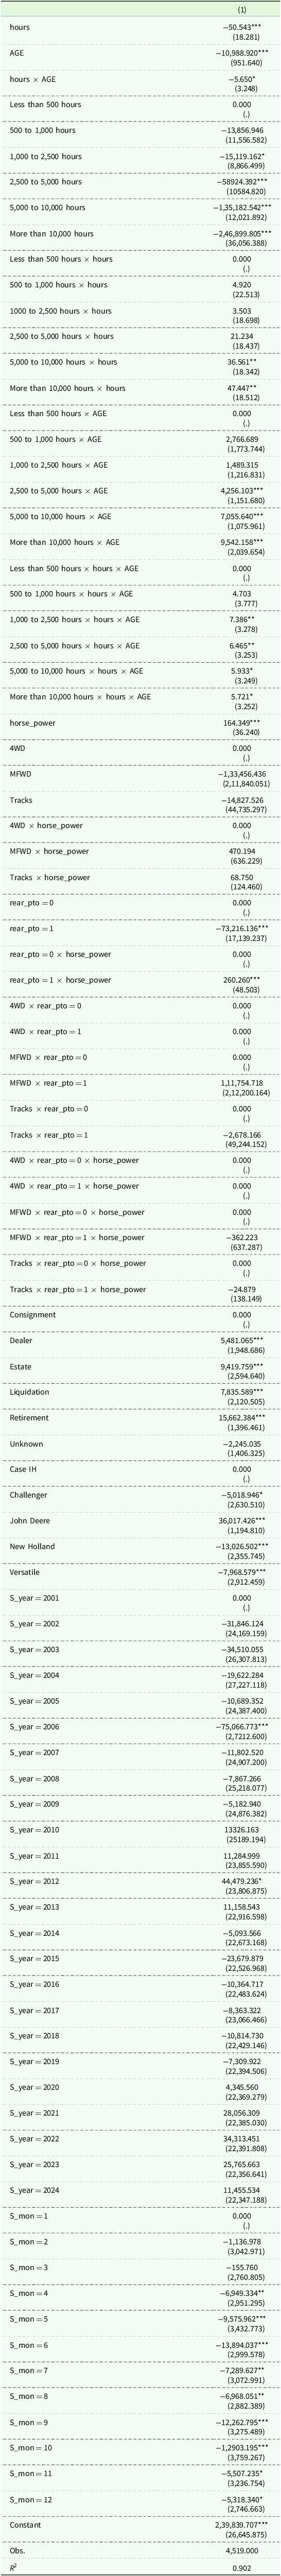
Standard errors in parentheses * p < 0.10, ** p < 0.05, *** p < 0.010 Estimates are in 2024 USD.


 Open access