


1. INTRODUCTION
In recent decades, decreases in surface mass balance (SMB) and increases in ice discharge from tidewater glaciers into the ocean have accelerated ice loss from the Greenland Ice Sheet (van den Broeke and others, Reference van den Broeke2016). Despite the inferred connection between oceanic warming and increased ice discharge (e.g., Holland and others, Reference Holland, Thomas, de Young, Ribergaard and Lyberth2008; Straneo and Heimbach, Reference Straneo and Heimbach2013), our understanding of ice/ocean interactions at the margins of the ice sheet remains limited. In particular, submarine melting of glacier termini is poorly understood, with few observational estimates of melt rates due to the difficulty of collecting in-situ data near actively calving glacial termini. Submarine melting has been proposed as a trigger for glacier calving, retreat and acceleration (O'Leary and Christoffersen, Reference O'Leary and Christoffersen2013; Luckman and others, Reference Luckman2015), and is thought to influence ice front morphology by undercutting termini and creating embayments through enhanced calving rates (Carroll and others, Reference Carroll2015; Fried and others, Reference Fried2015; Slater and others, Reference Slater, Nienow, Goldberg, Cowton and Sole2017a).
To date, many studies have used numerical models, observations and laboratory experiments to show that submarine melting is amplified where subglacial discharge plumes emerge at the glacier grounding line (e.g., Jenkins, Reference Jenkins2011; Motyka and others, Reference Motyka, Dryer, Amundson, Truffer and Fahnestock2013; Slater and others, Reference Slater, Nienow, Cowton, Goldberg and Sole2015; Cenedese and Gatto, Reference Cenedese and Gatto2016). Due to the lower density of subglacial discharge relative to the ambient fjord water, such plumes rise buoyantly along the ice front, entraining warmer fjord waters and melting the ice front and underside of any ice tongue present (e.g., Motyka and others, Reference Motyka, Hunter, Echelmeyer and Connor2003; Jenkins, Reference Jenkins2011, Moyer and others, Reference Moyer, Nienow, Gourmelen, Sole and Slater2017). Submarine melt rates (SMRs) are understood to be a function of the water temperature and velocity of the rising subglacial plume (Jenkins, Reference Jenkins2011), factors which are themselves influenced by the ambient fjord temperature, stratification and the volume and distribution of the emerging subglacial meltwater (e.g., Carroll and others, Reference Carroll2015; Slater and others, Reference Slater, Nienow, Cowton, Goldberg and Sole2015).
Here, we connect variations in floating ice tongue spring SMRs with the presence and location of summer subglacial meltwater plumes and of locally enhanced calving from 2012 to 2014 at Kangiata Nunaata Sermia (KNS), southwest Greenland.
2. STUDY SITE
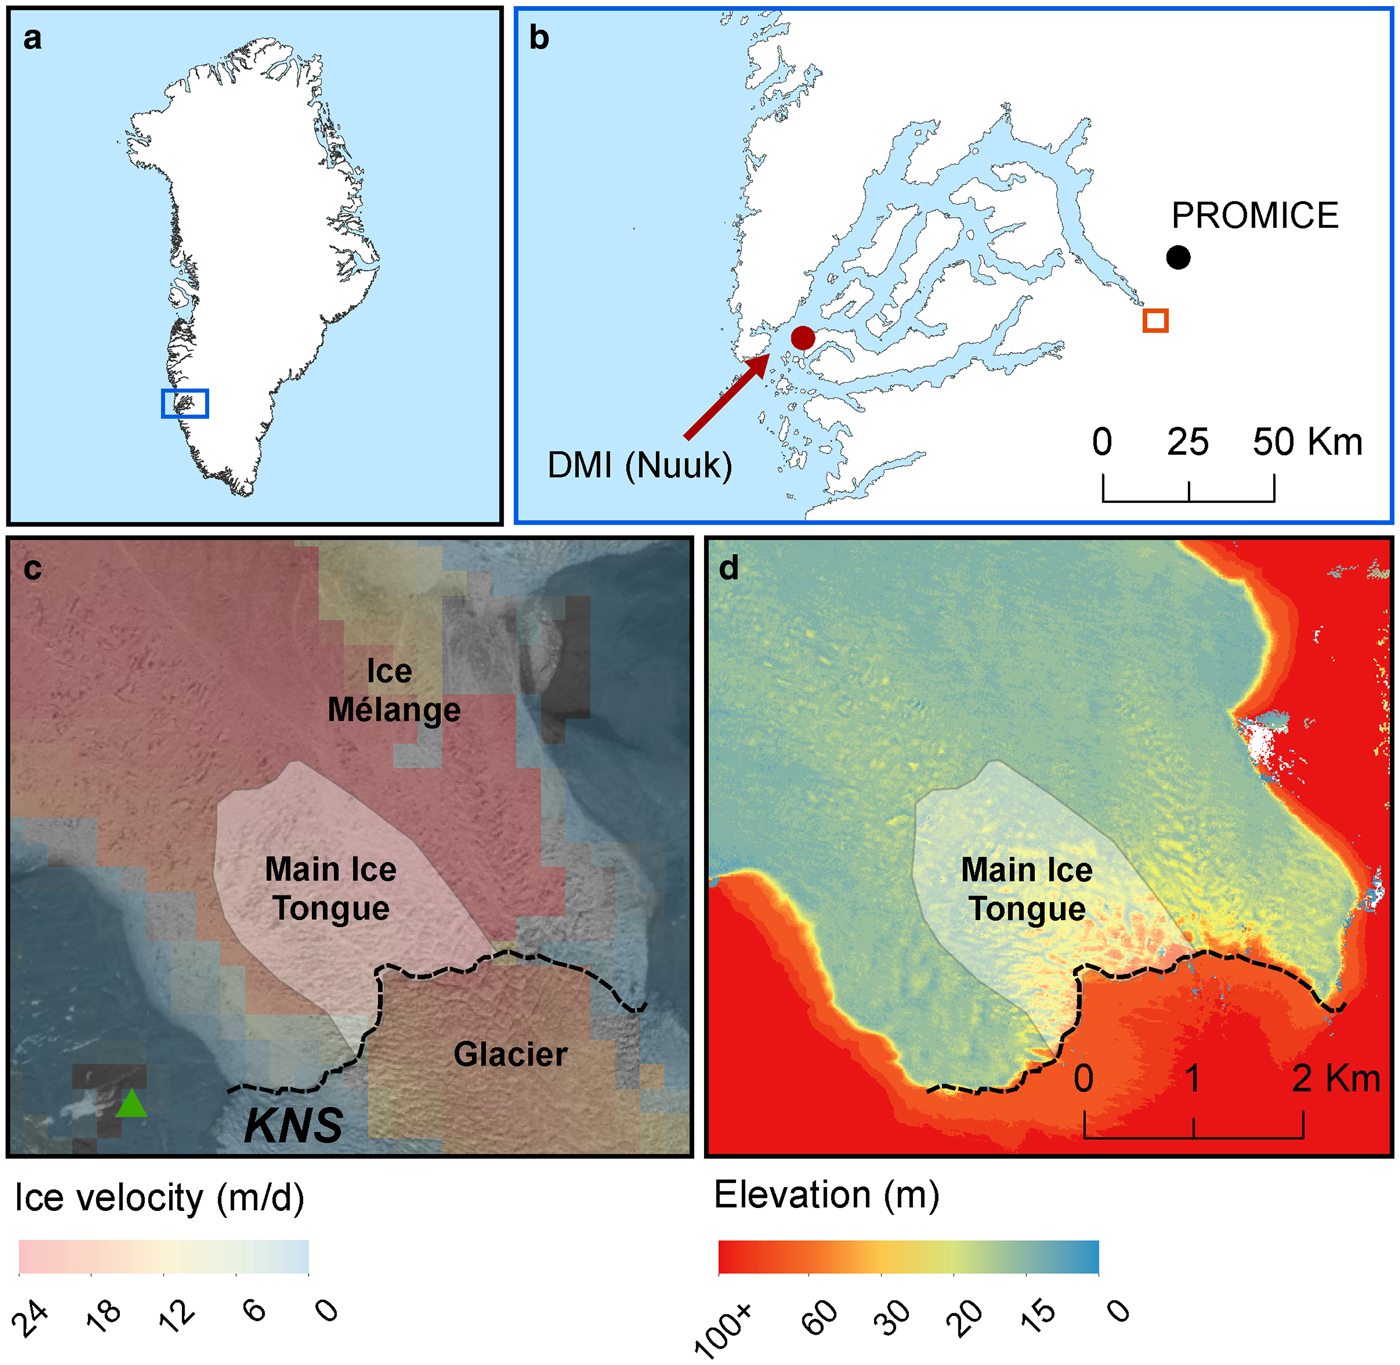
Our study is focused on KNS, the largest tidewater glacier in southwest Greenland, which drains into Kangersuneq Fjord at the head of the extensive Godthåbsfjord system (Fig. 1). The glacier front is 4.5 km wide and has a maximum grounding line depth of ~250 m below sea level (Mortensen and others, Reference Mortensen2013). In common with many Greenlandic tidewater glaciers, KNS forms a floating ice tongue over the winter, which extends 2–3 km from the glacier grounding line and decreases in freeboard with distance down-fjord (Figs 1d and 2a; Moyer and others, Reference Moyer, Nienow, Gourmelen, Sole and Slater2017). Analyses of fjord water properties show that Kangersuneq Fjord is stratified with relatively warm subsurface waters (up to 2.5°C) overlain by cooler water masses (between 0 and 1°C) (Mortensen and others, Reference Mortensen2013; Motyka and others, Reference Motyka2017).
Study area, including (a) Greenland location map where blue rectangle indicates the extent of (b); (b) fjord-scale location map within the wider Godthåbsfjord system with location of two weather stations: Danish Meteorological Institute (DMI) Nuuk (red filled circle) and PROMICE NUK_L (black filled circle). The open orange square corresponds to the location of (c, d); (c) a Landsat 8 band 8 satellite image of the KNS glacier ice tongue, acquired on 27 May 2014. The black dashed line indicates the estimated grounding line position (hand-digitized using both a Landsat 8 image from 12 June 2014 and the TanDEM-X DEM from 5 June 2014), the green triangle indicates the location of the University of Alaska Fairbanks time-lapse camera and the semi-transparent white polygon indicates the main ice tongue extent. Ice velocity from 27 May to 12 June is overlain, derived from the feature tracking of Landsat 8 imagery (Rosenau and others, Reference Rosenau, Scheinert and Dietrich2015); and (d) sample TanDEM-X derived elevation for KNS ice tongue, glacier and surrounding bedrock areas from 14 May 2014.
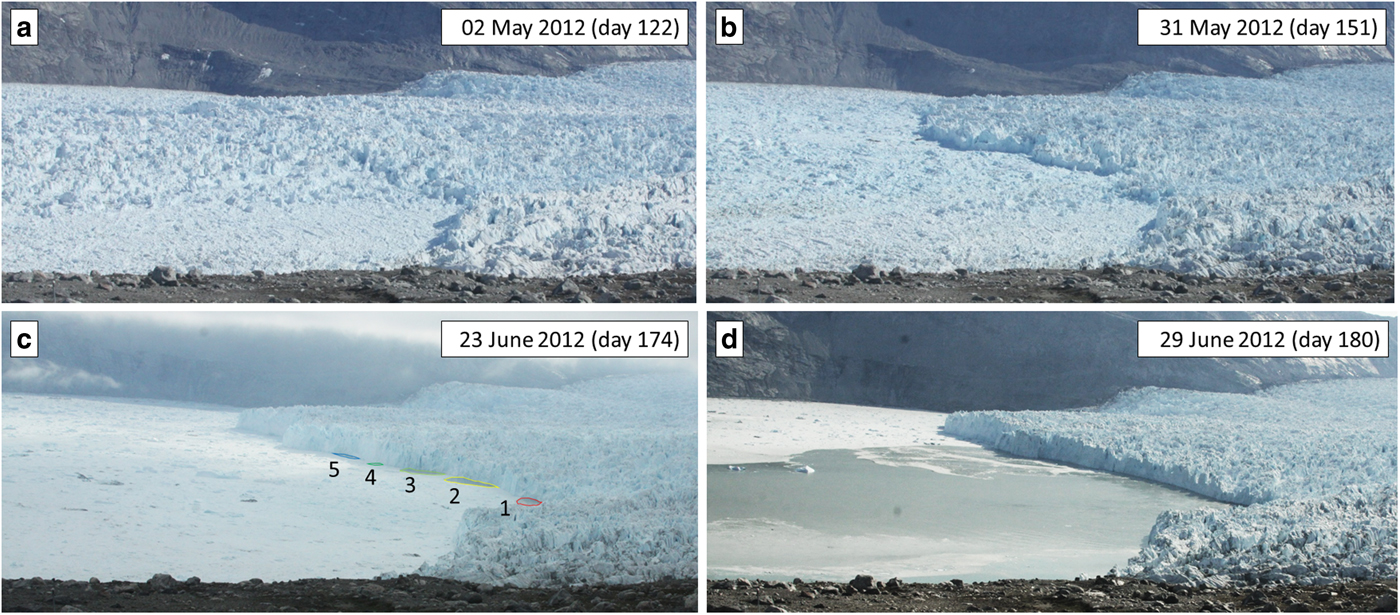
Sample time-lapse images used for plume presence detection: (a) ice tongue present; (b) no plumes visible on fjord surface; (c) multiple, separate plumes visible on fjord surface, with colours and numbers used for plume location classification (see Figs 4a, b); plumes 6 and 7 (not visible here) are located east (to the left) of plume 5; and (d) a single, connected surface expression of a plume visible on fjord surface.
3. DATA AND METHODOLOGY
3.1. Elevation and ice velocity data
Five 2.5 m resolution digital elevation models (DEMs) of the study area were generated from conventional SAR interferometric processing of bi-static TanDEM-X imagery (Dehecq and others, Reference Dehecq2016), as detailed in Moyer and others (Reference Moyer, Nienow, Gourmelen, Sole and Slater2017). DEMs were acquired for the following dates: 13 May 2012, 17 March 2013, 27 May 2013, 14 May 2014 and 5 June 2014. We used both ICESat and Operation IceBridge (OIB) Airborne Topographic Mapper (ATM) elevation data (Krabill, Reference Krabill2016) to perform co-registration and corrections to our derived DEMs. ICESat elevations were used for calibration over non-ice-covered terrain and OIB ATM elevations were used to correct a tilt in the data over the ice-covered fjord (Moyer and others, Reference Moyer, Nienow, Gourmelen, Sole and Slater2017) (Fig. S1). This tilt, ~0.45 m km−1 down-fjord, was introduced during DEM co-registration due to the limited coverage of the ICESat lines over stable bedrock regions. OIB ATM data from 25 April 2012 and 15 April 2014 were used to correct our 2012 and 2014 DEMs, respectively. As there was no OIB campaign over our study area in 2013, we corrected our 2013 DEMs using OIB ATM data from 8 April 2011, chosen due to similar fjord sea-ice cover in both years (Fig. S2), likely due to comparable inner-fjord water (Motyka and others, Reference Motyka2017) and air temperatures.
Three 20 m horizontal resolution ice velocity maps were generated using conventional feature tracking of spring 2013 TerraSAR-X imagery (e.g., Paul and others, Reference Paul2015), and acquired from the following image pairs (to correspond with our 17 March and 27 May 2013 DEMs): 12 and 23 February; 8 and 19 April; 30 April and 11 May (see Moyer and others (Reference Moyer, Nienow, Gourmelen, Sole and Slater2017) for more details). For 2012 and 2014, we use velocity maps generated from combined feature tracking of Landsat 7 and 8 imagery (Rosenau and others, Reference Rosenau, Scheinert and Dietrich2015) for the following image pairs: 6 and 22 May 2012 (to correspond with our 13 May 2012 DEM) and 27 May and 12 June 2014 (to correspond with both our 14 May and 5 June 2014 DEMs). These velocities are freely available from the Technische Universität Dresden's Geodetic Data Portal (https://data1.geo.tu-dresden.de/flow_velocity/). All velocity maps can be seen in Fig. S3.
3.2. Ice tongue surface and SMRs
To assess potential elevation changes driven by SMB, ice tongue surface melt rates were estimated using a simple positive degree-day approach (Hock, Reference Hock2003), details of which can be found in the Supplementary materials and Moyer and others (Reference Moyer, Nienow, Gourmelen, Sole and Slater2017). Degree-day modelling was also used to estimate catchment-wide runoff from surface melting during the melt season at elevations below 2000 m, above which most meltwater refreezes within the snow pack (e.g., Pfeffer and others, Reference Pfeffer and Meier1991; Langen and others, Reference Langen2015, Reference Langen, Fausto, Vandecrux, Mottram and Box2017). Daily air temperatures were acquired from a Geological Survey of Denmark and Greenland PROMICE weather station located ~21 km NE from the KNS terminus (Ahlstrom and others, Reference Ahlstrom2008) (Fig. 1b). Daily precipitation data were acquired from the Danish Meteorological Society (DMI) weather station in Nuuk, ~105 km west of the KNS terminus (Cappelen, Reference Cappelen2016) (Fig. 1b). The ArcticDEM (Morin and others, Reference Morin2016), sampled to 90 m horizontal resolution, was used to estimate KNS catchment-wide runoff.
Ice tongue SMRs were estimated by differencing along-fjord flowline surface elevation in combination with ice velocities, following the methodologies in Moyer and others (Reference Moyer, Nienow, Gourmelen, Sole and Slater2017). Flowlines were created every 25 m along the KNS ice tongue, starting 150 m from the grounding line (in order to exclude noise in velocity data as the ice moves across the grounding line) and extending ~2 km down-fjord (see Fig. 3). To accommodate temporal changes in ice velocity, separate flowlines were created for each DEM date, resulting in a different ice tongue shape each year. Elevations along each flowline were smoothed using a two-sided moving average with a 625 m window, which was the smallest smoothing window that significantly reduced the effect of large crevasses on the ice elevation gradient, and then converted to thickness values assuming ice tongue floatation and hydrostatic equilibrium. Noise in velocity data along each flowline was reduced by using a linear regression of ice tongue velocity against distance down-fjord.
Submarine melt rates (SMR) of KNS ice tongue flowlines, locations of plume surface expressions (grey polygons hand-digitized from Landsat images in Table S2), and near-terminus flow routing coloured to indicate total upstream drainage area for (a) 13 May 2012, (b) 17 March 2013, (c) 27 May 2013, (d) 14 May 2014 and (e) 05 June 2014. Dashed black lines indicate estimated location of the grounding line in June of each year (hand-digitized from Landsat 8 imagery). Background images are all Landsat 7 and 8, acquired for (a) 25 July 2012, (b, c) 01 May 2013 and (d, e) 12 June 2014. The chosen flow routing f-values (ratio of subglacial water pressure to ice overburden pressure) show the best spatial association between plume surface expressions and spatial variability in melt rate. Note that some colours seen in the flow routing are not in the colourbar (e.g., purple), as they are the result of overlapping channels (e.g., blue and red channels, but with purple being indicative of a net large upstream area).

As we only have one DEM for 2012 and for comparison purposes, we estimate steady state SMRs, assuming ice thickness at a fixed location does not change in time. SMR accounts for thinning due to stretching in both the flow direction and perpendicular to flow:
 $$SMR = \; - v_x\displaystyle{{\partial H} \over {\partial x}} - H\displaystyle{{\partial v_x} \over {\partial x}} - H\displaystyle{{\partial v_y} \over {\partial y}} - SMB\; $$
where H is the ice thickness (m), v x and v y are the ice velocity (m d−1) in the along- and across-flowline direction, and x and y represent distance in the along- and across-flowline direction. We include a potential contribution from SMB, although it will later be shown that this is negligible in our case. Note that a term representing across-flow thinning, − v y(∂H/∂y), does not contribute as, by definition of a flowline, v y = 0 on the flowline. To best capture the general trend in SMRs and in order to smooth out unrealistic melt rate estimates resulting from the heavily crevassed nature of the ice tongue (and thus short-length scale high amplitude variations in elevation), exponential fits were applied to estimated flowline melt rates (following Moyer and others, Reference Moyer, Nienow, Gourmelen, Sole and Slater2017).
3.3. Uncertainties in SMR estimates
Uncertainties in our SMR estimates are associated with the quality of the elevation and velocity data, the smoothing of our flowlines and our assumption of an ice tongue in steady state. We here discuss each in turn.
There are two types of errors associated with the elevation data: the absolute error in elevation (and thus thickness, H) and the error in the elevation gradient, which impacts ∂H/∂x in Eqn (1). Error in the absolute measured elevation derived from the TanDEM-x data results from the DEM construction process and typically has an uncertainty of ±2 m over areas of slope <12° (Rizzoli and others, Reference Rizzoli, Bräutigam, Kraus, Martone and Krieger2012). Error in the elevation gradient results from our DEM tilt correction using OIB ATM data, and we define it as the largest difference in slope between the OIB ATM lines and the corrected TanDEM-X elevations, as estimated over 2 km long segments of very thin sea ice where successive OIB ATM flights show near-constant slope (Fig. S1). The resulting elevation gradient errors are ±1.78 m (for 2012 and 2014) and ±0.38 m (for 2013) over the ~2 km long ice tongue.
Uncertainties in ice tongue velocity are often the result of poor image co-registration, surface changes and transformations (e.g., changes in illumination or reflectance of surface features like snow) and mismatches between similar but not corresponding features (in this case, crevasses in the ice tongue) (Paul and others, Reference Paul2015; Rosenau and others, Reference Rosenau, Scheinert and Dietrich2015). Uncertainties in Landsat-derived ice tongue velocity for 2012 and 2014 were downloaded directly from the Technische Universität Dresden's Geodetic Data Portal, with mean uncertainties in the velocity of up to ±1.1 and ±0.23 m d−1 for 2012 and 2014, respectively. Uncertainty in our 2013 TerraSAR-X derived ice tongue velocity was estimated following Paul and others (Reference Paul2015), with mean uncertainties in the velocity of ±0.09 m d−1.
Uncertainties in both elevation and velocity data were combined via standard error propagation techniques to calculate the preliminary error in our SMR estimates (ΔSMR), as follows:
 $$\Delta SMR = \; \sqrt {{\left[ {\Delta \left( {v_x\displaystyle{{\partial H} \over {\partial x}}} \right)} \right]}^2 + {\left[ {\Delta \left( {H\displaystyle{{\partial v_x} \over {\partial x}}} \right)} \right]}^2 + {\left[ {\Delta \left( {H\displaystyle{{\partial v_y} \over {\partial y}}} \right)} \right]}^2} $$
where Δ(v x(∂H/∂x)),Δ(H(∂v x/∂x)) and Δ(H(∂v y/∂y)) are the errors associated with the first three terms on the right-hand side of Eqn (1), respectively. The first error term, Δ(v x(∂H/∂x)), was estimated as follows (with the second and third terms estimated in a similar fashion):
 $$\Delta \left( {v_x\displaystyle{{\partial H} \over {\partial x}}} \right) = \left \vert {v_x\displaystyle{{\partial H} \over {\partial x}}} \right \vert \sqrt {{\left( {\displaystyle{{\Delta v_x} \over {v_x}}} \right)}^2 + {\left( {\displaystyle{{\Delta \displaystyle{{\partial H} \over {\partial x}}} \over {\displaystyle{{\partial H} \over {\partial x}}}}} \right)}^2} $$
In addition to the uncertainty in elevation and velocity data, there are other potential sources of error that must be considered and which we treat separately. Smoothing the flowline elevations also results in uncertainty in our final SMRs, which we assess using a sensitivity analysis. Varying the moving average window size by ±125 m results in an additional SMR uncertainty of ±25%, which has been directly applied to the preliminary SMR errors, above.
Finally, the assumption of an ice tongue in steady state increases uncertainty in our SMR estimates. We know that the ice tongue is not in steady state between March and May 2013, as seen in thickness changes between our two 2013 DEMs, which result from a slower moving glacier. To estimate potential errors resulting from this assumption, we estimated non-steady state SMRs for March and May 2013. We assumed a linear trend of thickening between the two DEMs (see Eqn (3) from Moyer and others (Reference Moyer, Nienow, Gourmelen, Sole and Slater2017)), accounted for by subtracting a daily rate of thickness change from our 2013 steady state melt rate estimates. On average, ice tongue non-steady state melt rates are 0.12 m d−1 (23%) and 0.23 m d−1 (27%) lower than steady state estimates for March and May 2013, respectively (Fig. S4). These average percentage differences fall within the mean percentage differences in melt rate resulting from uncertainty in our elevation and velocity datasets (see Table S1), which range from 26 to 46%. In addition, assuming an ice tongue is in steady state does not change the overall magnitude of the melt rates. As such, while the ice tongue is not in a steady state (at least for 2013), we believe that SMRs can be reasonably approximated under the assumption of an ice tongue with a steady state geometry, as we estimate here, and which is necessary for meaningful comparison to years when we only have one DEM for estimating melt rates.
3.4. Subglacial discharge plumes, calving activity and hydrology
To investigate the correspondence between the presence and location of subglacial discharge plumes post-ice tongue disintegration and spatial patterns in ice tongue SMRs, we created a time series of the expression of runoff plumes at the fjord surface using time-lapse imagery from a camera located on a bedrock ridge ~1 km from the western edge of the KNS calving front (Fig. 1c). Images of the western half of the calving front were taken every 4 hours from 18 May 2012 (day 139) until 22 July 2013 (day 203). We assigned each plume a number from 1 to 7, based on its location and moving west to east along the calving front (Fig. 2c). Plumes 6 and 7 (not pictured in Fig. 2c) occur infrequently. To avoid including open water resulting from wind or calving activity, we only identified plumes that were visibly turbid, thereby indicating a subglacial origin. In addition, while plume surface expressions are not visible at the same time as the ice tongue is intact, we assume that plume positions are the same for the period prior to the disintegration of the ice tongue.
A time series of calving activity was also created from the time-lapse images, by viewing each image for visible signs of calving and recording the time and location of each event along the calving front (either western or eastern side). Visible signs of calving include actively captured calving events, changes in fjord surface characteristics between two images (i.e., non-turbid open water adjacent to the ice front with small bergy bits), and obvious changes in ice front morphology between two images.
To assess potential spatial variations in the subglacial hydrological network below the grounded part of KNS and the predicted locations of any emerging subglacial channels along the calving front, we performed a standard hydropotential analysis with the MATLAB toolbox TopoToolBox (Shreve, Reference Shreve1972; Schwanghart and Scherler, Reference Schwanghart and Scherler2014), using BedMachine v3 bed and surface topography (Morlighem and others, Reference Morlighem2017) to calculate the subglacial hydraulic potential (ɸ):
 $$\Phi = \rho _{\rm w}gz + f\rho _igh$$
where ρ w and ρ i are the densities of meltwater (1000 kg m−3) and ice (910 kg m−3), respectively, g is the acceleration due to gravity (9.81 m s−2), z is the bed elevation (m), and ℎ is the ice thickness (as provided in the Bed Machine v3 product). f is the ratio of the subglacial water pressure to the ice overburden pressure (e.g. Banwell and others, Reference Banwell, Willis and Arnold2013), which is in general poorly known and we thus apply a range of values from f = 0.1 to f = 1 consistent with sparse borehole water pressure observations from Greenland (Meierbachtol and others, Reference Meierbachtol, Harper and Humphrey2013; Andrews and others, Reference Andrews2014). A value f = 0.1 means that the subglacial water pressure is a tenth of the ice overburden pressure, so that the subglacial hydrological system is at low pressure, such as might be associated with efficient subglacial drainage, while a value f = 1 means that the subglacial water pressure is equal to the ice overburden pressure, so that the subglacial system is at high pressure, as might be associated with inefficient subglacial drainage (Fountain and Walder, Reference Fountain and Walder1998).
4. RESULTS AND DISCUSSION
4.1. Variations in SMRs
Using our flowline methodology, we find that near-terminus spring SMRs for the floating ice tongue at KNS vary both temporally and spatially (Figs 3 and Fig. S5; Table S1), with mean melt rates taken over the full extent of the ice tongue ranging from 0.8 ± 0.3 m d−1 in March and May 2013 to 1.3 ± 0.6 m d−1 in May 2012. Maximum melt rates occur under the western half of the ice tongue in May 2012, reaching over 7 m d−1 ~150 m down-fjord from the KNS grounding line. Surface melt rates, estimated using a positive degree-day model, are at least one order of magnitude lower than our mean SMRs (Table S1), and are thus considered negligible (see Supplementary materials for more details).
Our melt rates agree well with those previously estimated in the Godthåbsfjord system. Estimated mean melt rates over the full KNS ice tongue (up to 1.3 ± 0.6 m d−1) are in line with our previous 2013 mean melt rate estimate of 0.8 ± 0.3 m d−1 (Moyer and others, Reference Moyer, Nienow, Gourmelen, Sole and Slater2017) while our maximum melt rate (just over 7 m d−1) compares well with modelled average KNS ice front estimates of 3–7 m d−1 (Motyka and others, Reference Motyka2017). Our melt rates are also the same order of magnitude as those estimated under Greenland tidewater glacier floating termini between 2000 and 2010, which reach over 2.0 m d−1 in both central west (Jakobshavn and Rink) and east (Daugaard Jensen) Greenland (Enderlin and Howat, Reference Enderlin and Howat2013).
Variations in SMRs depend on multiple factors, scaling with both ambient water temperature and plume velocity (e.g., Holland and Jenkins, Reference Holland and Jenkins1999; Jenkins, Reference Jenkins2011). Ambient winter and spring water temperatures measured at depths between 120 and 150 m (in which the deepest draft of the ice tongue sits) in Kangersuneq Fjord do not change substantially from 2012 to 2014, averaging ~1.5°C for all months during our study period, with the exception of March 2013, which averaged 2.0°C (Mortensen and others, Reference Mortensen2013; Motyka and others, Reference Motyka2017). As such, it is unlikely that changes in ambient water temperature at depth (~33% increase from 2012 to 2013) are driving the temporal variations seen in our SMR estimates (~38% decrease in ice tongue averaged melt rate from 2012 to 2013).
4.2. Subglacial discharge plumes
The presence of subglacial plumes, resulting from surface and basally generated meltwaters, also influences SMRs. In the winter and early spring, subglacial discharge from surface meltwater is expected to be negligible. Plumes may however still be generated by subglacial discharge resulting from frictional melting beneath the grounded part of the glacier (Christoffersen and others, Reference Christoffersen, O'Leary, van Angelen and van den Broeke2012). To assess the potential influence of basal frictional melting on driving winter and spring plumes, we estimated basal meltwater flux for the entire KNS catchment using a simplified equation for basal melt rate (Christoffersen and others, Reference Christoffersen, O'Leary, van Angelen and van den Broeke2012), dependent upon ice velocity and density, basal drag and the latent heat of fusion (see Supplementary materials for equation and data sources). Estimated basal meltwater fluxes were 29.4, 28.9 and 29.1 m3 s−1 for 2012, 2013 and 2014, respectively. Frictional melting is likely therefore able to sustain active plumes through the winter and into early spring, augmenting SMRs. However, once the melt season begins, runoff from surface melting will dominate, sustaining larger plumes and promoting higher melt rates. This is likely the case in May 2012, when the melt season began early and where we estimate May runoff reaching 500 m3 s−1 (Fig. 4e) and melt rates exceeding 7 m d−1.
(a, b) Time series of subglacial plume surface expression for (a) 2012 and (b) 2013 (see Fig. 2c for plume locations), where hollow circles indicate separate, individual plumes and filled circles indicate plumes seen as a single large coalesced plume on the fjord surface; the red vertical line indicates the date of ice tongue disintegration and the grey dashed vertical line indicates the date of the last time-lapse image; (c–e) Time series of (c) daily average air temperature (solid lines, left axis) and cumulative positive degree day (PDD) sum (dashed lines, right axis), (d) daily precipitation, and (e) catchment-wide surface runoff over KNS from degree-day modelling for 2012 (black lines) and 2013 (blue lines).

Subglacial plumes, sourced primarily from glacier surface meltwaters exiting at the grounding line, can be observed at the surface of the fjord near the KNS grounding line in late-spring and summer each year, following ice tongue disintegration. Analysis of time-lapse imagery from 2012 shows that nearly all of the observed plumes on the fjord surface (~97%) occurred along the western half of the calving front (Figs 3a and 4a, plumes 1–5). We note, however, that due to the restricted view from the time-lapse camera, it is possible we are missing occurrences of surfacing plumes on the eastern side of the calving front. Nevertheless, the surface expression of plumes west of the calving front center for nearly all of the melt season suggests consistent delivery of meltwater, via a network of several subglacial channels, at corresponding locations along the glacier grounding line (e.g., Slater and others, Reference Slater2017b). In instances where there is only one large plume visible on the fjord surface, it is impossible to tell which subglacial channels are ‘active,’ or if the channel network is unstable, particularly if one channel is dominant. Several channels could have persisted from the previous melt season, sustained by the release of frictional meltwater generated from basal sliding or from surface melt runoff due to an early on-set to the melt season, thereby promoting the high melt rates observed in May 2012 under the western side of the ice tongue (e.g., Fig. 3a).
The surface expression of plumes is infrequent in 2013 (Fig. 4b), likely due to the much lower catchment-wide surface runoff volume across the melt season (2.1 and 4.8 km3 for May to October 2013 and 2012, respectively, based on degree-day estimates), resulting in lower subglacial discharge at the grounding line and fewer plumes reaching the surface of the fjord (e.g., Slater and others, Reference Slater, Nienow, Cowton, Goldberg and Sole2015; Carroll and others, Reference Carroll2016). In addition, the surface expression of plumes occurs much earlier in 2012 (day 156) than 2013 (day 199), likely due to the warmer air temperatures observed in 2012 (Fig. 4c) causing both an earlier break-up of the ice tongue and an earlier on-set of the melt season.
4.3. Subglacial hydrology network
The spatial pattern of our SMR estimates for 2013 changes between March and May, with higher melt rates under the eastern side of the ice tongue in mid-March, followed by higher melt rates under the western side of the ice tongue by the end of May (Fig. 3b, c), suggesting a change in the primary location of subglacial plumes exiting the glacier. In 2014, our melt rate estimates are again higher beneath the eastern side of the ice tongue, potentially indicating an oscillating subglacial hydrological network beneath KNS, with the main subglacial channels shifting between the western and eastern side of the ice tongue.
Results from our hydropotential analysis suggest that the location of the emerging subglacial runoff is sensitive to subtle changes in subglacial water pressure. Using a basal water pressure from 90 to 100% of the ice overburden pressure predicts a major subglacial channel on the far eastern side of the calving front, as well as two smaller channels on the western half of the calving front (Figs 3b, d, e and Figs S6b, c). This channel configuration is consistent with the higher melt rates on the eastern side of the fjord that we observe in March 2013 and May and June 2014. Reducing the basal water pressure to anywhere from 10 to 80% of ice overburden results in a significant change in inferred channel location, with a major subglacial channel now predicted on the western side of the calving front (Figs 3a, c and Figs S6d–f), closer to where we see most large plumes emerging at the fjord surface in 2012, and where we observe higher SMRs under the spring ice tongue. The predicted locations of subglacial runoff are therefore sensitive to changes in basal water pressure, suggesting that near-terminus subglacial channels are likely mobile and highly dynamic (e.g., Slater and others, Reference Slater2017b).
4.4. Calving and ice front shape changes
Further analysis of the 2012 time-lapse imagery reveals that the majority of the calving events observed during the melt season (~91%) occur where we predominantly see subglacial plume surface expressions and where we estimated higher SMRs under the spring ice tongue. The occurrence of increased calving over areas of high submarine melting has been observed at tidewater glaciers in central west Greenland (e.g., Fried and others, Reference Fried2015) and Alaska (e.g., Bartholomaus and others, Reference Bartholomaus, Larsen and O'Neel2013), where calving is driven by thermal undercutting of the ice front via submarine melting (e.g., O'Leary and Christoffersen, Reference O'Leary and Christoffersen2013). These areas of increased calving can create pronounced embayments along the calving front, often located above subglacial outlet channels (e.g., Chauché and others, Reference Chauché2014; Fried and others, Reference Fried2015), and as we observe along the western half of the KNS ice front during the 2012 melt season (Fig. S7). As we have limited time-lapse imagery for 2013 and no imagery for 2014, we cannot determine whether the relationship between subglacial plume presence, submarine melting and calving holds true for other years at KNS. Ice velocities approaching the terminus are not significantly different across the width of the ice tongue in any given year, suggesting a similar ice flux delivery to the terminus across the calving front. We argue therefore that the presence of subglacial meltwater plumes has a large influence on localized calving, which must shift with time along the ice front, or else the terminus planform shape would change gradually to reflect the dominance of calving that we observe on the western side in 2012.
5. CONCLUSIONS
Dynamic changes in tidewater glaciers have led to increases in ice discharge from the Greenland ice sheet over recent decades, yet the processes controlling these dynamic changes remain poorly understood, particularly the role of submarine melting. Here, using high-resolution DEMs and ice velocity, we estimate SMRs under the seasonal ice tongue of KNS in southwest Greenland from 2012 to 2014, revealing significant near-terminus spatial and temporal variations in spring melt rates. We estimate SMRs of up to 7.3 ± 2.3 m d−1 under the western side of the ice tongue in May 2012, with the spatial pattern of melt rate corresponding to the locations of surface expressions of subglacial discharge plumes during the melt season of the same year. In addition, the greatest abundance of observed calving in 2012 occurs where we predominately see subglacial plumes. The spatial pattern of estimated SMR varies from 2012 to 2014, with areas of higher melt switching between the western and eastern side of the ice tongue. We attribute these changes to a switching of subglacial flow paths, a hypothesis supported by modelled subglacial flow routing, which shows that the main channel will emerge on either the eastern or western side of the fjord, dependent on subtle changes in the ratio between basal water pressure and ice overburden pressure. Our results provide a new empirically derived link (i.e., non-laboratory or modelled result) between the presence of subglacial discharge plumes, and thus subglacial outlet channel locations, and areas of higher submarine melting and calving at tidewater glacier termini, and can be used to improve our understanding of the coupling between tidewater glacier termini and the ocean.
SUPPLEMENTARY MATERIAL
The supplementary material for this article can be found at https://doi.org/10.1017/jog.2019.27
ACKNOWLEDGEMENTS
ANM is supported by a University of Edinburgh Principal's Career Development PhD Scholarship. We acknowledge NERC grants NE/K015249/1 (to PWN) and NE/K014609/1 (to AJS) and DLR projects XTI_GLAC0296 and LAN1534 (to NG). Time-lapse imagery was acquired under NSF grant PLR-0909552 (to MT and MF). PROMICE and DMI data are available at http://www.promice.dk and http://www.dmi.dk, respectively. ArcticDEM was created from DigitalGlobe Inc. imagery, funded under NSF awards 1043681, 1559691, and 1542736.


 Open access