


Background
Changes in COVID-19 disease severity were observed throughout the COVID-19 pandemic in England, with large fluctuations in the number of individuals dying with COVID-19 between 2020 and 2022. The highest mortality rates were among those aged over 80, with the highest rates reported between April and May 2020 and in early 2021 [1].
In England, there were two official measures of COVID-19 deaths: a count of death registrations where COVID-19 was reported as a cause of death, reported by the Office for National Statistics (ONS), and a count of individuals who have died within 28 days of a positive SARS-COV-2 test, reported by the UKHSA [Reference Seghezzo2].
In early 2022, following a stabilization in deaths from March 2021, a reduction in deaths with COVID-19 reported as the cause of death was observed. This decrease was accompanied by a less substantial reduction in the number of deaths within 28 days of a positive COVID-19 test. A study conducted by UKHSA supported this observation, showing the proportion of 28-day deaths that had COVID-19 on the death certificate dropped from 80%–90% in mid-December 2021 to 55% in February 2022 [Reference Seghezzo2].
The reduction in deaths among those testing positive for SARS-CoV-2 was related to several factors, including the emergence of new variants resulting in changes to disease severity, with the omicron variant notably associated with a lower risk of severe COVID-19 [Reference Petrone3]. Furthermore, the national vaccination programme meant that by January 2022, 77.7% of the adult population had received a primary vaccination course ([Reference Andrews4, 5].
This analysis utilizes national-level SARS-CoV-2 testing data, applying a matched cohort design to understand the mortality risk in the acute phase of infection, relative to those without the disease. We compare the risk of death among individuals testing positive and negative for COVID-19 throughout the pandemic and specifically in early 2022. Focusing on individuals tested in early 2022 helps assess whether the risk of death following COVID-19 remained elevated among those testing positive during a period associated with reduced disease severity. This analysis also investigates the impact of vaccination status on mortality risk.
Methods
To examine temporal changes in mortality risk within 28 days of a SARS-CoV-2 test, we developed a linked dataset of individuals who tested positive and negative from 1 March 2020 to 31 March 2022. Testing data and information on individuals’ COVID-19 vaccination records, hospital records, and death records were obtained from datasets held by UKHSA.
Data sources
In England, comprehensive, national-level SARS-CoV-2 testing data are collected in real time. Between March 2020 and April 2022, SARS-CoV-2, polymer chain reaction (PCR), and lateral flow device (LFD) testing were available across hospital and community settings in England [6, 9].
Second generation surveillance system
Positive SARS-CoV-2 test data are collected through UKHSA’s Second Generation Surveillance System (SGSS). SGSS captures laboratory test result information for infectious diseases from diagnostic laboratories in England, and for COVID-19, incorporates positive test results reported by individuals to the NHS. These data include tests from two testing pillars, Pillar 1 captures swab tests processed via UKHSA and NHS laboratories, including those with a clinical need and health and care workers; and Pillar 2 captures swab testing in the wider population through commercial laboratory partnerships and LFD tests [10]. Cases are counted at the disease episode level, with episodes measured from an individual’s earliest specimen date; separate episodes are counted if positive test results are over 90 days apart. SGSS records are validated and enhanced with personally identifiable information (PII) from the NHS Spine [7]. The key PII variables captured are NHS number, forename, surname, date of birth, sex, ethnicity, and residential postcode.
Unified sample dataset
Negative SARS-CoV-2 testing data from England are collected through the UKHSA’s Unified Sample Dataset (USD), a repository for all COVID-19 testing data developed at the start of the COVID-19 pandemic for the production of routine SARS-CoV-2 positivity metrics. The USD contains all positive and negative SARS-CoV-2 test results from Pillar 1 and Pillar 2. The key PII variables included are NHS number, forename, surname, date of birth, sex, and residential postcode.
National Immunisation Management System
The National Immunisation Management System (NIMS) is a database of individuals resident or registered with a GP in England, which contains individual person records for the population in England and details of their COVID-19 vaccination record. The key PII variables included are NHS number, forename, surname, date of birth, sex, ethnicity, and residential postcode.
NIMS data act as the gold standard for patient information, with patient records obtained directly from the NHS spine [7].
Death registration data
Individual death records were obtained from the national death registration data collated by ONS. These person-level data include information on cause of death, coded using the International Classification of Diseases (ICD-10) system. The key PII variables included are NHS number, forename, surname, date of birth, sex, ethnicity, and residential postcode.
Secondary uses service data
Secondary uses service (SUS) data include information on all hospital attendances and admissions in England and their associated diagnoses and treatments. This is the preliminary version of hospital episode statistics (HES) data and covers hospital admissions from 2019 onwards. Diagnosis records and medical condition records are captured using the International Classification of Diseases (ICD-10) coding system. The key PII captured in these data is the NHS number.
Dataset production
To create the cohort for analysis, positive SARS-CoV-2 episode data from SGSS and negative test data from USD were cleaned, and entity resolution methods were carried out to facilitate robust linkage between individuals testing positive and negative to create a complete testing record for each person.
The entity resolution methods to create the cohort linked the testing data to the NIMS and then the death registration data, first deterministically using NHS number, full name, sex, date of birth, and postcode, and then probabilistically using combinations of these personally identifying information (PII). NIMS and death registration data contain validated patient identifiers for all individuals in England who were alive in December 2020 and those who have died since the start of 2020. All NIMS records and 99.89% of death registrations have validated NHS numbers, and almost 100% of records in both datasets have complete name, sex, date of birth, and postcode information. Therefore, triangulation using these data ensures the testing data are enriched with validated and robust PII information.
Following entity resolution, the resulting cohort included only test records with a valid NHS number. The validated records were then linked to additional data sources (HES, vaccination records) using the NHS number to obtain explanatory factor information.
Inclusion and exclusion
Validated positive and negative records were included in the cohort if they tested between 1 March 2020 and 31 March 2022 and were aged over 18 at their test. The individual’s earliest positive test date and a randomly selected negative test from the time period were selected. Individuals could be included in both the positive and negative test groups; however, individuals testing negative were only included if they had not already tested positive.
Test records outside of the study period or without minimum PII were excluded.
Key indicator development
Vaccination status information was derived from the NIMS data, defining individuals as being fully vaccinated or unvaccinated at their test date. A full vaccine course was defined as two or more doses, at least 21 days apart, where 14 days had elapsed between the test and last vaccination, and unvaccinated was defined as receiving less than two doses.
Information on the testing Pillar was derived from the SGSS and USD testing data.
SUS hospital data from 2019 to the test date provided information on individuals’ comorbidities and previous hospital admissions. Charlson comorbidity indices were calculated using ICD-10 codes for diagnosed clinical conditions made prior to individuals’ selected COVID-19 test with the R comorbidities package and categorized as: mild (score of 1–2), moderate (score of 3–4), and severe (score of 5 or more) [Reference Huang8]. Prior inpatient hospital admissions in the 2 years prior to their selected test were indicated, where the hospital admission date was before the test date. Separate admissions were counted if admission dates were > 1 day apart. The number of hospital admissions was categorized as 1, 2, 3, 4, and 5+ admissions.
Study design
To assess the relative risk of death, a matched cohort design was applied. Individuals testing positive and negative were matched using a 1:1 ratio on sex, 5-year age band, region, Index of Multiple Deprivation (IMD) decile, week of test, testing pillar, and comorbidity score. The matched study design approach also only assesses associations among persons being tested; therefore, the results do not make any inference on persons who have not been tested.
Analytical methods
The risk of death within 28 days of a SARS-CoV-2 test per 100 000 people was calculated among those testing positive and negative in the matched cohort. Risk and odds ratio of death were calculated for the whole time period (March 2020–April 2022), by 3-month intervals, and for the focus time period (January 2022–April 2022).
Further analyses were carried out, limited to those testing in the focus time period, stratified by demographic and testing factors included in the matching (sex, age, region, IMD, testing pillar, and comorbidity score).
Conditional logistic models were used to compare the risk of death among those testing positive and negative, first applying univariable conditional logistic models, followed by multivariable models adjusting for the impact of vaccination status and prior hospitalizations on risk of death.
Multivariable models were built using a forward stepwise approach, and each potential confounder was considered using likelihood ratio tests.
To investigate how the risk of death changed by vaccination status and number of hospital admissions in the 2 years preceding the test, interaction terms were applied to the unadjusted and adjusted conditional logistic models.
Results
Overall study period: 1 March 2020–31 March 2022
After applying the exclusion criteria, the cohort contained 12 315 272 test-positive and 32 179 716 test-negative individuals tested between 1 March 2020 and 31 March 2022. After matching, the study cohort contained 7 113 734 test-positive and negative individuals. The test-positive and negative individuals had the same distribution by the variables matched on (sex, age band, week of test, IMD, lower super output area of residence (LSOA), testing pillar, and Charlson comorbidity score). Fifty-four per cent of test-positive and negative individuals were female, and the median age was 41 (minimum 18, maximum 113). Twenty-nine per cent were resident in the Midlands and East and North of England, and they were evenly distributed across the IMD deciles. Ninety-eight per cent of both groups had no comorbidities, and 92% were tested via testing Pillar 2 (Supplementary Table 1).
For the overall time period, the risk of death was 537 per 100 000 people among test-positive individuals, compared to 198 among the test-negatives. The odds of death within 28 days of a SARS-CoV-2 test were 3.28 times higher among test-positives compared to test-negative individuals (95% CI: 3.21–3.35).
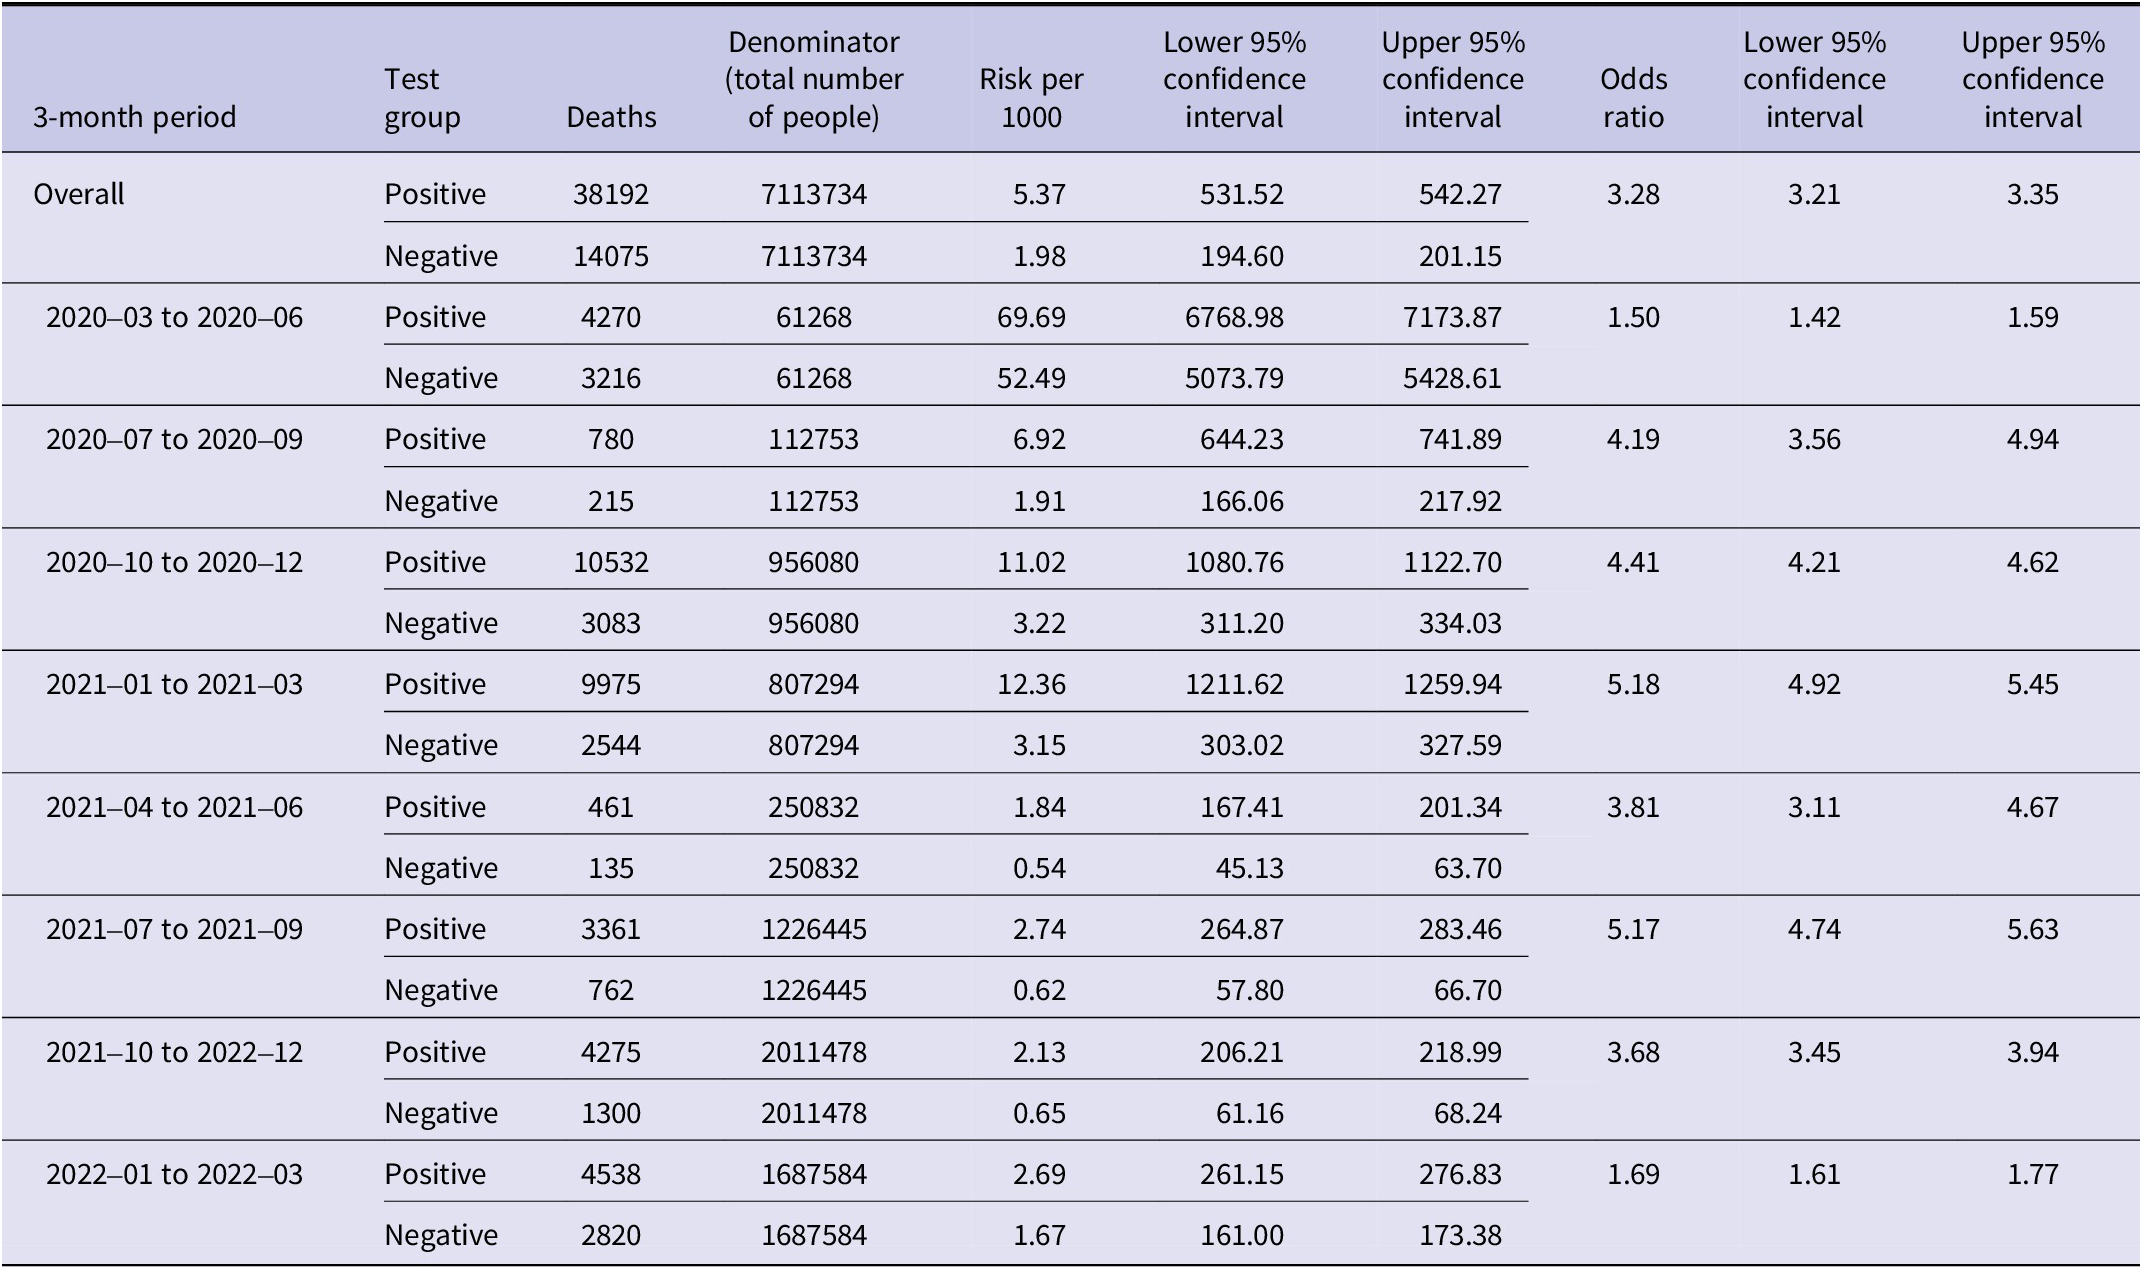
The risk of death was highest in both test-positive and test-negative individuals early in the pandemic (March–June 2020) (Table 1), and at this time, the odds ratio was lower at 1.50 (95% CI: 1.42–1.59). The odds peaked between January 2021 and March 2021 at 5.18 (95% CI: 4.92–5.45). The odds ratio fell to 1.69 (95% CI: 1.61–1.77) from January 2022 to April 2022, which is the time period we focus on in this analysis.
Odds ratios between death within 28 days of a positive test and death within 28 days of a negative test by 3 months period

[Table 1] Long description
The table is organized by 3-month periods, each with two rows: Positive and Negative test groups. Columns are 3-month period, test group, deaths, denominator, risk per 1000, lower and upper 95 percent confidence intervals for risk, odds ratio, and lower and upper 95 percent confidence intervals for odds ratio. For the overall period, Positive group: 38192 deaths out of 7113734, risk per 1000 is 5.37, odds ratio 3.28 (CI 3.21 to 3.35). Negative group: 14075 deaths, risk per 1000 is 1.98. For 2020–03 to 2020–06, Positive: 4270 deaths, risk 69.69, odds ratio 1.50 (CI 1.42 to 1.59); Negative: 3216 deaths, risk 52.49. For 2020–07 to 2020–09, Positive: 780 deaths, risk 6.92, odds ratio 4.19 (CI 3.56 to 4.94); Negative: 215 deaths, risk 1.91. For 2020–10 to 2020–12, Positive: 10532 deaths, risk 11.02, odds ratio 4.41 (CI 4.21 to 4.62); Negative: 3083 deaths, risk 3.22. For 2021–01 to 2021–03, Positive: 9975 deaths, risk 12.36, odds ratio 5.18 (CI 4.92 to 5.45); Negative: 2544 deaths, risk 3.15. For 2021–04 to 2021–06, Positive: 461 deaths, risk 1.84, odds ratio 3.81 (CI 3.11 to 4.67); Negative: 135 deaths, risk 0.54. For 2021–07 to 2021–09, Positive: 3361 deaths, risk 2.74, odds ratio 5.17 (CI 4.74 to 5.63); Negative: 762 deaths, risk 0.62. For 2021–10 to 2022–12, Positive: 4275 deaths, risk 2.13, odds ratio 3.68 (CI 3.45 to 3.94); Negative: 1300 deaths, risk 0.65. For 2022–01 to 2022–03, Positive: 4538 deaths, risk 2.69, odds ratio 1.69 (CI 1.61 to 1.77); Negative: 2820 deaths, risk 1.67. Across all periods, odds ratios for death within 28 days are higher for the Positive group than the Negative group.
Focused time period: 2 Jan 2022–2 April 2022
Analysis of the focused time period, from 2 January to 2 April 2022, included 1 687 584 test-positive individuals matched to 1 687 584 test-negative individuals.
As with the overall time period, test-positive and negative individuals had the same distribution of the demographic variables on which they were matched. The median age of tests was 45 (minimum 18, maximum 112), and 56% were female, 30% were residents in the Midlands and East of England, and 29% in the South of England. There was a higher proportion of residents in the most deprived IMD deciles. Most individuals had no comorbidities (97%) and were tested via Pillar 2 (90%) (Supplementary Table 2).
The test-positive and negative individuals differed slightly in terms of vaccination status and number of previous hospital admissions. A slightly higher proportion of test-positive individuals had at least two vaccine doses at the time of test compared to test-negative individuals (88% and 86% respectively). More test-negative individuals were vaccinated within the 3 months before their test compared to the positives (52% and 46% respectively). A slightly higher proportion of test-negative individuals had no hospital admissions recorded in the 2 years prior to their test, compared to the test-positive individuals (94% vs. 92%) (Supplementary Table 2).
During this focused time period, among the 1 687 584 test-positive individuals, 4 538 died within 28 days of their earliest test, compared to 2 820 of the 1 687 584 test-negative individuals (Supplementary Table 3).
The risk of deaths within 28 days of a SARS-CoV-2 test was 269 per 100 000 among test-positive and 167 among test-negative individuals, compared to 537 and 198, respectively, across the whole pandemic (Supplementary Table 4).
Univariable analysis showed the odds of death within 28 days of a SARS-CoV-2 test was 69% higher (OR:1.69, 95% CI: 1.61–1.77) among test-positive compared to those test-negative individuals (Supplementary Table 4).
When adjusting for vaccination status and the number of previous hospital admissions, the risk of death following a positive test result was still higher compared to a negative test result; however, the odds ratio attenuated slightly to 1.63 (95% CI: 1.55–1.72) (Supplementary Table 4).
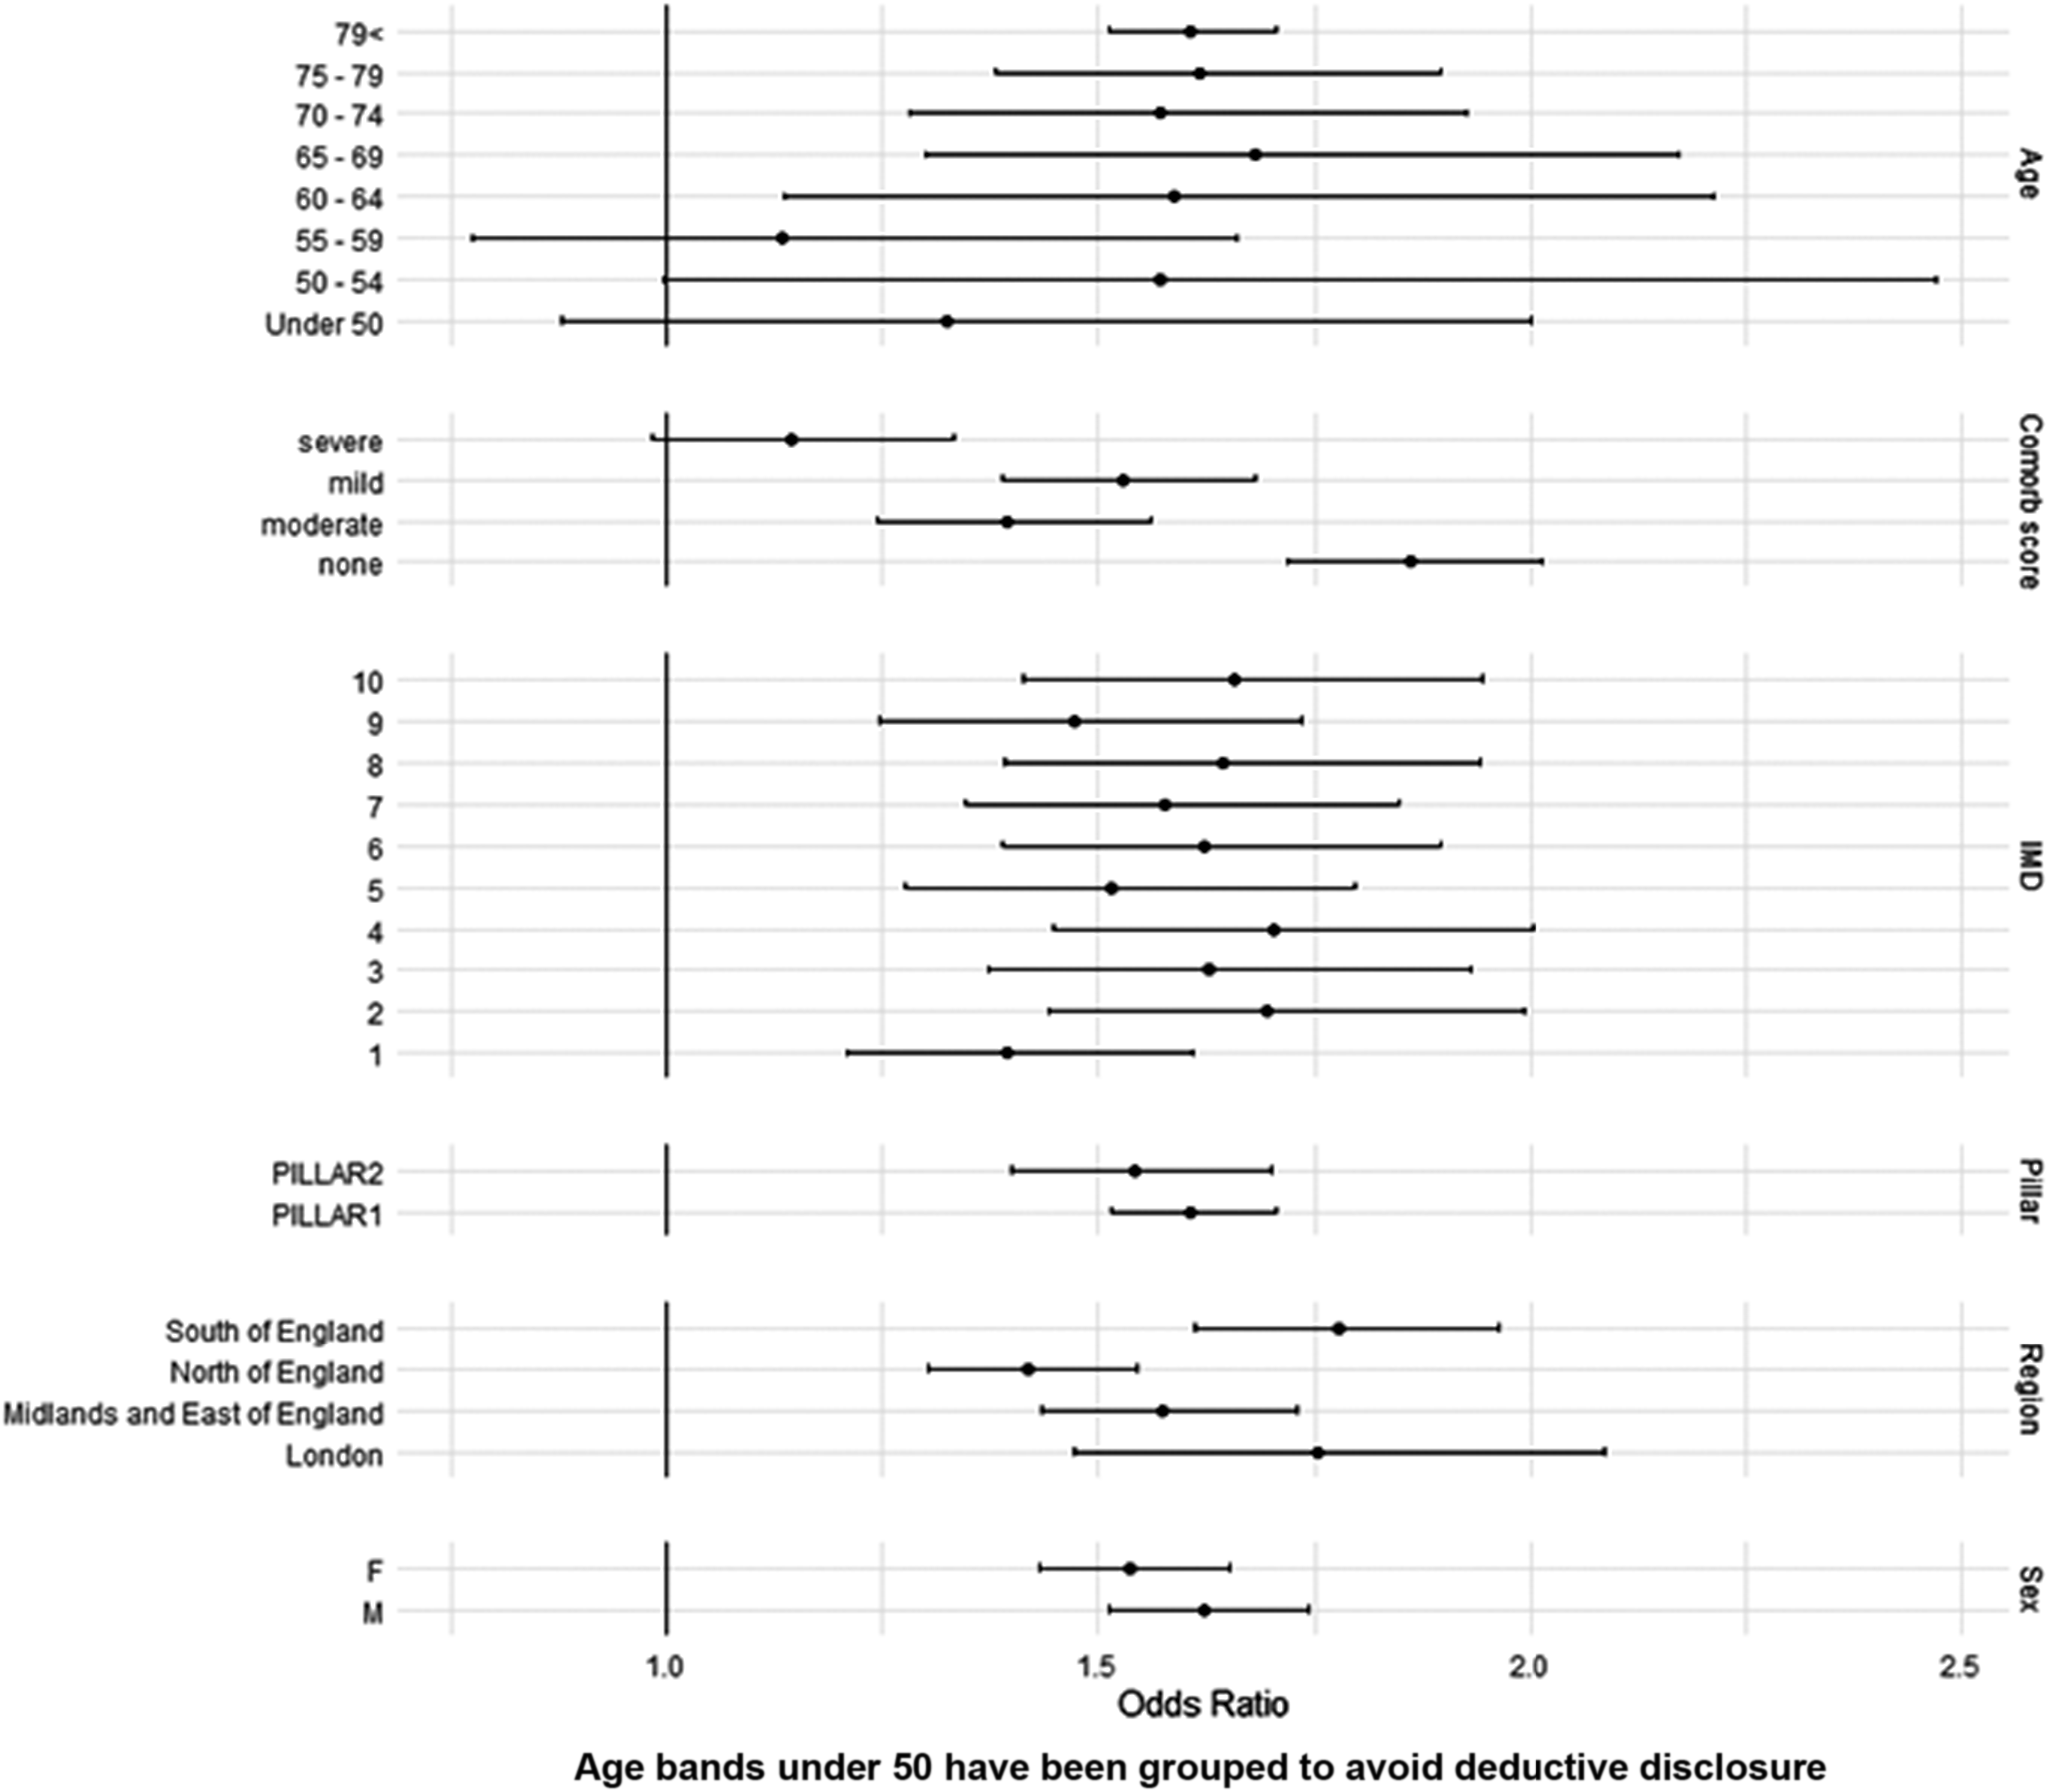
When comparing test-positive to test-negative individuals, the highest adjusted odds ratios were seen among those who were male (OR: 1.70, 95% CI: 1.58–1.83), aged over 60 (OR: 1.61, 95% CI: 1.15–2.25), resident in the least deprived areas (IMD 10) (OR: 1.42, 95% CI: 1.23–1.65), tested via Pillar 1 (OR: 1.68, 95% CI: 1.58–1.79), and with no reported comorbidities (OR: 1.89, 95% CI: 1.74–2.04) (Figure 1 and Supplementary Table 4).
Adjusted odds ratios of death within 28 days of a SARS-CoV-2 test during the focused time-period (Jan 2022 to April 2022), stratified by demographic factors.

[Figure 1] Long description
From top to bottom, the forest plot displays horizontal lines with central points and confidence intervals for each subgroup. Age groups (Under 50 to 79 and above) are at the top, showing increasing odds ratios with age. Comorbidity score categories (none, moderate, mild, severe) follow, with higher scores generally associated with higher odds ratios. IMD deciles (1 to 10) are next, with odds ratios distributed across deciles. Pillar categories (PILLAR 1, PILLAR 2) are shown, with PILLAR 2 having a higher odds ratio. Regional categories (London, Midlands and East of England, North of England, South of England) are listed, with South of England showing the highest odds ratio. Sex categories (M for male, F for female) are at the bottom, with males having a higher odds ratio. The x-axis is labeled Odds Ratio, ranging from 1.0 to 2.5. Confidence intervals are wide for most categories, but only cross 1 for Under 50s and 55-59 age groups.
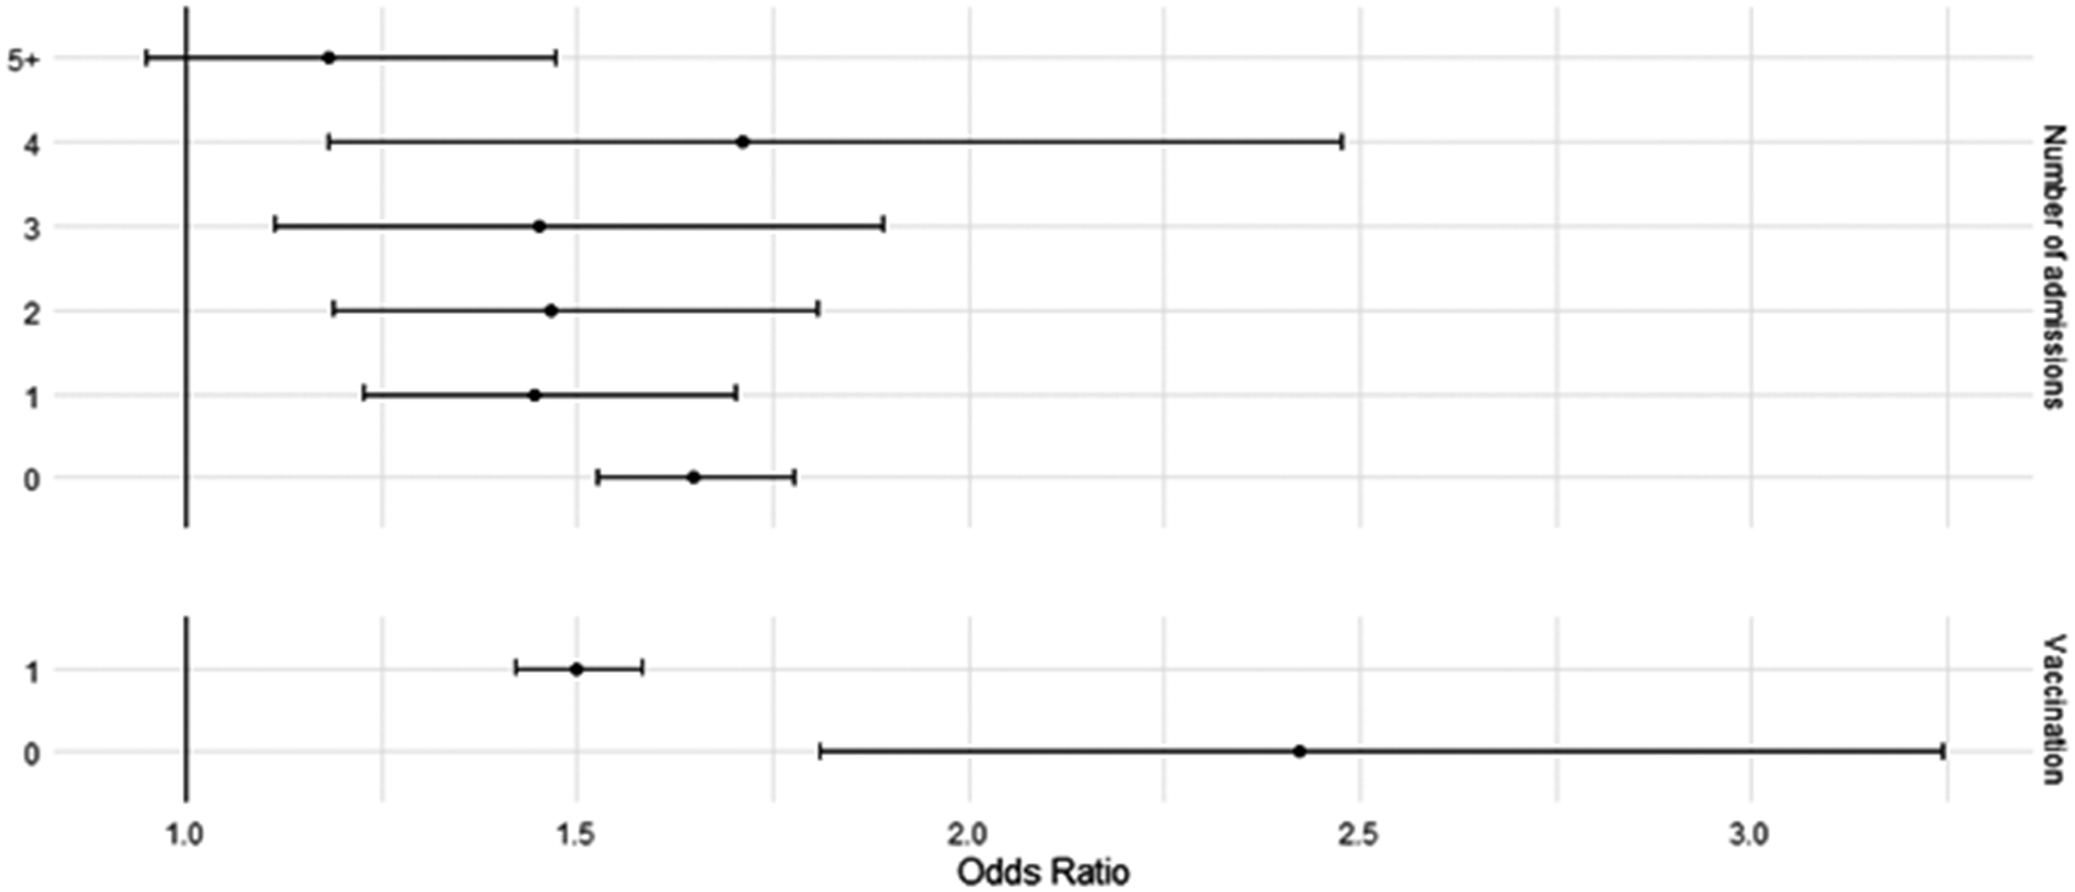
When stratifying for vaccination status and number of previous hospitalizations, the univariable and multivariable conditional logistic models show the odds of death were higher among test-positive compared to test-negative individuals in all strata. Among those who were unvaccinated, the adjusted odds ratio of death was 2.38 (95% CI: 1.85–3.38), compared to an adjusted odds ratio of 1.55 (95% CI: 1.23–1.65) among those who had at least two doses (Figure 2 and Supplementary Table 5).
Adjusted odds ratios of death within 28 days of a SARS-CoV-2 test during the focused time-period (Jan 2022 to April 2022), stratified by vaccination status and number of previous hospital admissions.

The highest number of deaths was seen among test-positive and negative individuals with over five previous hospitalizations. However, the highest unadjusted and adjusted odds ratios were seen among those with no previous hospital admissions (aOR 2.50, 95%CI: 1.85–3.38) compared to all other groups, where the odds ratios were below 1.79 (Figure 2 and Supplementary Table 5).
Discussion
It is well understood that during the pandemic, COVID-19 infection resulted in an increased risk of death. The results of this study support this, showing from March 2020 to April 2022, there was a 228% increased risk of death among those testing positive compared to negative, with this increased risk peaking at 418% from January 2021 to March 2021.
Following widespread vaccine coverage and the dominance of the less severe omicron variant from early 2022, a reduction in disease severity and deaths was observed. This resulted in the step-down of national non-pharmaceutical interventions to reduce the transmission of COVID-19 in England. However, our results show that during this period, despite the observed lower number of COVID-19 deaths compared to the rest of the pandemic, there was still a substantially increased risk of dying within the 28 days following a positive COVID-19 test when compared to those testing negative.
After accounting for multiple demographic and disease characteristics in the matching criteria, we observed that individuals testing positive for COVID-19 had a 69% higher risk of death compared to those testing negative.
With 78% of the adult population having received a full COVID-19 vaccination course (2 doses) by January 2022, through this study, we wanted to understand whether the risk of death among those with COVID-19 remains substantially increased only among certain population groups. Further adjustments were made to account for differences in vaccination status, accounting for differing risk among unvaccinated individuals and those with at least two doses, and for the number of hospital admissions in the 2 years preceding a COVID-19 test, to reflect differing risks among individuals with complex health needs. After these adjustments, the increased risk of death remained, with those testing positive exhibiting a 63% higher risk of death compared to those testing negative. Our results also found the highest increased risk was seen among those testing positive with no previous hospital admissions. This is likely due to those with multiple previous admissions being more likely to have pre-existing, severe health conditions, having an increased risk of death, regardless of their COVID-19 test result, compared to those without pre-existing conditions. However, there may be other differences among this group that could not be captured in these data. For example, we may have been unable to link some individuals to a hospital record due to data quality, or they may have severe comorbidities that are only reported in a primary care setting and were therefore not present in their hospital records.
This study benefits from the use of multiple national person-level data sources, allowing accurate data linkage and the creation of a large cohort and robust control group. The matched cohort approach reduces selection bias and ensures similarity in characteristics between positive and negative testing populations, facilitating the comparison of outcomes in similar populations and enabling control for potential confounding variables.
There are some limitations to this study; for example, excluding individuals without NHS numbers and complete PII records could result in the potential exclusion of individuals who do not engage with healthcare, which may affect the generalizability of the results. The study also excludes those who do not test or report their SARS-CoV-2 tests, which may bias against those who experienced barriers to testing. Also, the matched cohort design means the cohort may not be entirely representative of the broader population; however, representativeness analyses carried out during the study development stage showed relative alignment of the matched cohort with the overall population. Furthermore, with such large datasets, the impact of being unable to find suitable matches was minimal.
It is also important to note that the reason for testing may have an impact on the findings, particularly in the later time period when testing rules were relaxed. Negatives may be testing because they are symptomatic, or because they are contacts of cases, or before going to see vulnerable populations. The latter two may mean the negatives have a lower risk of death than the positives, and may contribute to the continued increased risk of death in the positives.
This national-level study shows that despite widespread vaccination and an observed reduction in the COVID-19 severity in England at the end of the pandemic, the risk of death following COVID-19 remained. However, the highest risk was still observed among those who are unvaccinated, which supports the continued need for COVID-19 booster vaccination campaigns targeting those most at risk of severe disease.
Supplementary material
The supplementary material for this article can be found at http://doi.org/10.1017/S0950268826101472.
Data availability statement
Any research conducted using these data must be done as a formal academic collaboration between UKHSA and an academic institution. Proposals for collaboration will be considered by the COVID-19 Vaccine and Epidemiology team to evaluate the scientific quality and feasibility of the proposal.
Acknowledgements
We thank the Data Operations team at UKHSA for coordinating data flows and the IT infrastructure to build the dataset. We thank the Health Data Science team at the Nuffield Department of Orthopaedics and Musculoskeletal Science, including Annika M. Jödicke, Martí Català, Albert Prats Uribe, and Daniel Prieto Alhambra, for their inputs into the methods used. We also thank Ines Campos-Matos and Jaime Borjas Howard for their help in the study design and methodology for investigating risk by vaccination status.
Author contribution
Conceptualization: K.H., M.K., H.A.; Data curation: K.H., H.A.; Formal analysis: K.H., N.A., H.A.; Investigation: K.H., G.D., M.K., H.A.; Methodology: K.H., N.A., M.K., H.A.; Project administration: K.H., H.A.; Visualization: K.H., H.A.; Writing - original draft: K.H., H.A.; Writing - review & editing: K.H., H.A.; Supervision: G.D., M.K., H.A.
Competing interests
The authors declared no conflicts of interest.
Ethical standard
UKHSA has legal permission, provided by Regulation 3 of The Health Service (Control of Patient Information) Regulations 2002, to process confidential patient information under Section 3(i) (a)–(c), 3(i)(d) (i) and (ii), and 3(iii).
Funding statement
This work was performed as part of UKHSA’s routine work to monitor COVID-19. No external funding received.


 Open access