

The milk from dairy cows contains 12–14% solid matter composed of proteins (2.5–4%), fat (3–5%), and lactose (~5%) (Osorio et al., Reference Osorio, Lohakare and Bionaz2016). Milk is used in the food industry in many different ways. Not only is milk a very nutritious food but also the by-products released during the production of dairy products carry additional nutritional properties. The best example is the whey, which is released as a waste/by-product during cheese processing. 10 kilos of milk are used to produce 1 kilo of cheese, and approximately 9 kilos of whey are released as a result of the process. Whey contains high amounts of protein. Among them β-lactoglobulin (BLG) represents about 50% of the total whey proteins in bovine milk and possesses high levels of secondary, tertiary and, in most cases, quaternary structures (Kinsella and Whitehead, Reference Kinsella and Whitehead1989; Edwards et al., Reference Edwards, Creamer and Jameson2009). In addition to protein, whey powders include lactose sugar. Whey is often an ingredient of choice as an additive in the food industry due to its multi-purpose functional properties (Huffman, Reference Huffman1996). Before its industrial processing in different food products, the interactions of the ingredients in whey and their response to changing process conditions such as temperature, pH and humidity must be known. As a result of the studies carried out for this purpose, it has been observed that the milk sugar lactose in whey is affected by the temperature and the water content, and it has been stated that possible changes in lactose molecules affect the shelf life of this type of food product (Vuataz, Reference Vuataz2002).
Similarly, BLG protein is known to be affected by temperature and pH changes of the environment (Aymard et al., Reference Aymard, Durand and Nicolai1996; Fang and Dalgleish, Reference Fang and Dalgleish1997). Not only changes in ambient conditions, but also the interaction of BLG protein with other molecules, affect its functional properties and taste (Guichard and Langourieux, Reference Guichard and Langourieux2000). In recent studies, especially on taste and oral processing, it has been reported that BLG interacts with the mucin protein in the saliva (Çelebioğlu et al., Reference Çelebioğlu, Gudjónsdóttir, Meier, Duus, Lee and Chronakis2015) and, as a result of this interaction, the model food products containing BLG change the friction coefficient in the oral environment and create changes in taste perception (Vardhanabhuti et al., Reference Vardhanabhuti, Cox, Norton and Foegeding2011; Çelebioğlu et al., Reference Çelebioğlu, Gudjónsdóttir, Chronakis and Lee2016; Çelebioğlu et al., Reference Çelebioğlu, Lee and Chronakis2020). It is stated that BLG protein also interacts with lactose sugar and this interaction continues during the drying process and storage conditions (Thomas et al., Reference Thomas, Scher and Desobry2004a). It has been shown that the BLG-lactose interaction stabilizes lactose crystallization (Costantino et al., Reference Costantino, Curley, Wu and Hsu1998) and thus prevents the formation of undesirable properties like particle caking, Maillard reaction, lipid oxidation and so on (Burin et al., Reference Burin, Jouppila, Roos, Kansikas and Buera2000; Özkan et al., Reference Özkan, Withy and Chen2003; Thomas et al., Reference Thomas, Scher, Desobry-Banon and Desobry2004b). Lactose crystallization in products such as milk powders increases the amount of free fat molecules ((Kim et al., Reference Kim, Saltmarch and Labuza1981) In order to prevent lactose crystallization, the use of high molecular weight molecules such as proteins (Levine and Slade, Reference Levine and Slade1986; Nasirpour et al., Reference Nasirpour, Scher, Linder and Desobry2006) or sugars other than lactose have been recommended in the literature (Nasirpour et al., Reference Nasirpour, Landillon, Cuq, Scher, Banon and Desobry2007).
At this point, the interaction of lactose with BLG and mucin protein is an interesting subject to investigate. Although there are some studies related to lactose and BLG as mentioned above, there is no literature on the interaction of lactose and mucin protein. Since mucin protein has both a high molecular weight and a highly glycosylated structure (Bansil and Turner, Reference Bansil and Turner2006), its interaction with lactose can be used functionally. Mucin, as the major salivary protein, is an important protein related to oral food processing and digestion. Through the various stages of oral processing and digestion, foods continuously mix with saliva and mucins interact with food components (Çelebioğlu et al., Reference Çelebioğlu, Lee and Chronakis2020). Therefore, the mucin–lactose interaction or the change of BLG–lactose interaction in the presence of mucin may give important clues about the taste and bioavailability properties of a wide range of products such as milk/whey powder containing lactose and BLG.
In line with all these motivations, this study aimed to investigate the interactions of BLG–lactose, mucin–lactose and BLG–lactose–mucin at molecular level. Different temperatures and pH values were used to compare the conditions of different processing and digestion environments. The fluorescence spectroscopy technique was chosen as the optimum technique for this research. Fluorescence spectroscopy is based on the presence of intrinsic fluorophores such as tryptophan (Trp, the dominant fluorophore) and tyrosin (Tyr) residues, in which the emission spectra (both intensity and (λmax), the maximum peak positions) are sensitive to the local environment of the Trp residues, and can thus provide useful information on both conformational and structural changes of proteins (Lakowicz, Reference Lakowicz2006). Recently, the interaction of BLG and mucin was studied with fluorescence, resulting in useful and interesting clues about the way these two proteins interact (Yılmaz et al., Reference Yılmaz, Lee and Chronakis2021). However, there is no integrating study examining the interaction of lactose, BLG and mucin molecules with fluorescence spectroscopy. It is envisaged that explaining the molecular level interactions between them will contribute to food process optimizations to produce functional products with improved sensory properties and bioavailability.
Material and methods
Sample preparation
BLG from bovine milk, lactose and porcine gastric mucin (PGM) (Type III) were purchased from Sigma Aldrich and were used as received. Protein solutions with the concentration of 1 mg/ml were prepared by dissolving proteins in 100 mM phosphate-buffered saline (PBS) solutions. By addition of HCl or NaOH as appropriate, the pH values of the buffer solutions were adjusted to pH 6.8, which may represent the milk, oral and intestine pH, and adjusted to pH 3 to represent gastric/stomach environment. The pH 6.8 and pH 3, where BLG is negatively and positively charged respectively, were also useful to observed the charged dependent interaction behavior of the protein. All buffer solutions were filtered (polyethersulfone 0.20 mm).
A dilution series of lactose solutions (0.7–23.4 μM) was prepared in PBS solutions at pH 6.8 and 3. For each data point, 1 ml of the appropriate lactose solution was added into 1 ml BLG or PGM (1 mg/ml) solution. The change in fluorescence emission intensity was measured after 2 min of adding mucin to the BLG. The addition of a constant volume of quencher to the protein solution avoided complications due to dilution effects within titration type experiments.
Fluorescence spectroscopy measurement
All intrinsic fluorescence measurements were carried out using an FS5 Spectrofluorometer (Edinburgh Instruments, Livingston, UK) with a 150 W Xenon lamp and a single photon counting photomultiplier (PMT) detector (Hamamatsu, R928P). The excitation wavelength range (λex) was at 280 nm and the emission wavelength range was from 290 to 420 nm (measured every 2 nm). Other settings of the instrument were; a slit width of 2 nm (for both excitation and emission) and a photomultiplier (PMT) detector voltage of 1245 V.
The change in fluorescence emission intensity of samples at three different temperature conditions (25, 37, and 45°C) were measured to determine quenching capacity, binding, and thermodynamic parameters. To account for the possibility that lactose might absorb energy at the established emission wavelength, a blank was made for each lactose concentration, where the lactose solution was replaced by PBS. The respective spectrum of each lactose solution was then subtracted from the emission spectrum of the corresponding mixture (Brandão et al., Reference Brandão, Silva, García-Estévez, Mateus, de Freitas and Soares2017). Each measurement was repeated in triplicate and the mean and standard deviation were calculated. To correct the inner filter effect, the suggested method of Birdsall et al. (Reference Birdsall, King, Wheeler, Lewis, Goode, Dunlap and Roberts1983) was used but it should be noted that no significant changes on the measured data were observed because the studied concentrations were low enough to not have an impact on the linearity of emitted light.
Scanning electron microscopy, sem
The samples were freeze-dried before the test. To do this, the final protein-lactose mixtures were placed into 15-mL round-bottomed flasks and were frozen at −40°C, then the samples were freeze-dried (Vertical Freeze Dryer Biobase BK-FD18P-T, High-tech Zone, Jinan, Shandong, China) for 36 h. Water content of all samples was measured after freeze-drying and samples had less than 2% water (dry basis). A scanning electron microscope (TESCAN-MAIA3) operating at 5 kV accelerating voltage was used to examine the surface of the mixture of protein and lactose samples. By using double sided adhesive tape, thin layers of powder samples were mounted on aluminum stubs and then sputter-coated with carbon and with gold/palladium.
Statistical analysis
Data obtained in this study was expressed as the mean ± standard deviation of triplicate measurements. Data were statistically analyzed for multiple comparisons using SPSS software (version 28, IBM SPSS Inc., Armonk, NY, USA) for analysis of variance (ANOVA). Duncan's novel multiple-range test was applied to compare different samples, with significance established at P < 0.05.
Results and discussion
Fluorescence intensities of BLG and lactose mixtures
Changes in the intrinsic fluorescence intensities (FI) of milk/whey protein BLG in the presence of increasing concentration of milk sugar lactose are shown in Figure 1. There was a linear increase in BLG FI when the lactose concentration increased from zero to 10 mM according to the values measured at both pH 3 and pH 6.8 at room temperature. The increase has also been observed at 37 and 45°C, but at these temperatures the FI changes depending on the concentration are irregular.
Fluorescence intensity spectra of BLG in the presence of lactose (0–10 mM) at different pH (pH 3 and 6.8) and temperature conditions (25, 37, and 45 ˚C).
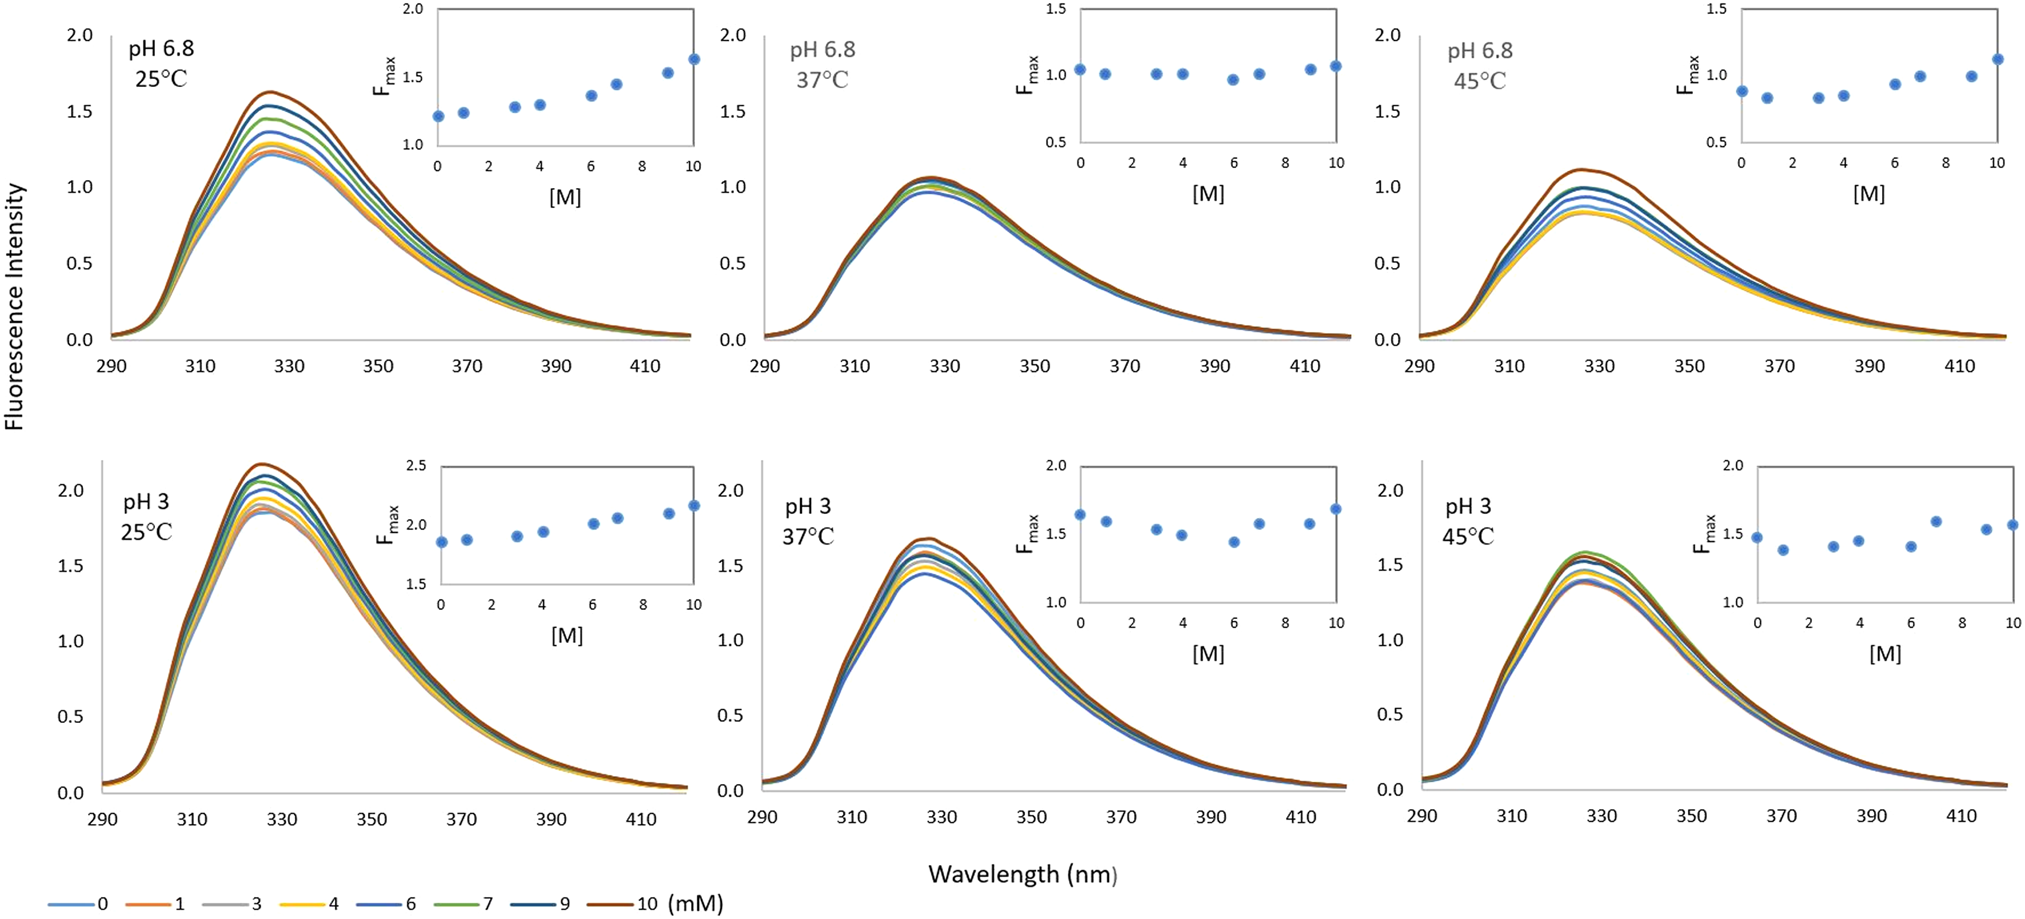
The indole group of Trp alone has λmax at around 340 nm but λmax for BLG was observed at a shorter wavelength (λem = 326). This usually means that the main fluorescing residue of the protein is shielded from aqueous solvent. The main fluorescing residue of BLG is Trp-19, which is located in the more hydrophobic environment of the protein molecule (Liang and Subirade, Reference Liang and Subirade2012). However, there was no change in λmax value depending on both pH and temperature, which may indicate that the pH and temperature changes do not affect the environment of the fluorescent Trp residue of BLG significantly, regardless of lactose existence. The emission maximum of Trp is highly dependent on the details of its surrounding environment but indole can also display a substantial spectral shift upon forming a hydrogen bond to the imino nitrogen (Lakowicz, Reference Lakowicz2006). According to Arakawa et al. (Reference Arakawa, Prestrelski, Kenney and Carpenter2001) a direct interaction between lactose and the polar groups of proteins is formed, especially with hydrogen bonds. Thomas et al. (Reference Thomas, Scher and Desobry2004a) suggested that this type of interaction may develop between lactose and milk proteins in whey powders and influence lactose crystallization by stabilizing the model whey powders against lactose crystallization.
There was no lactose-dependent quenching of the BLG fluorophore in the range of 0–10 mM lactose concentration. On the contrary, there was a continuous increase in the F max value of the BLG protein when the lactose concentration increased, especially at 25°C. This may be a sign that in the presence of lactose molecules, Trp residues of BLG are better protected from the solvent and giving higher FI. Similarly, a rise in FI of ligand-binding protein like glucose/galactose-binding protein have been observed in the literature. Pickup et al. (Reference Pickup, Khan, Zhi, Coulter and Birch2013), for instance, mentioned the glucose-induced three-dimensional change in glucose/galactose-binding protein into a fluorescence change that is related to glucose concentration.
Some processing and storage conditions may affect this molecular interaction. For instance, freeze drying could develop hydrogen bonds between lactose and BLG. In addition, Maillard reaction may occur due to covalent interaction between lactose and BLG during storage of BLG and lactose containing powders. However, FI measurements in this study have been performed without any freeze drying or storage but still a sign of interaction between lactose and BLG was observed.
Temperature and pH dependent change in fluorescence intensity
The effect of temperature on the changes in FI was compared in the absence of lactose and at the highest lactose concentration in the BLG protein solution (Table 1). In both cases, the highest FI was measured at 25°C, while the FI decreased as the temperature increased. These temperature dependent changes are similar at pH 3 and pH 6.8. However, when the temperature was increased from 25 to 37°C in the presence of lactose, the FI decreased more rapidly and an extra increase in the temperature to 45°C had no further effect on the FI.
The maximum fluorescence intensity values (F max) of BLG alone and BLG–lactose mixture to compare the changes with temperature and pH
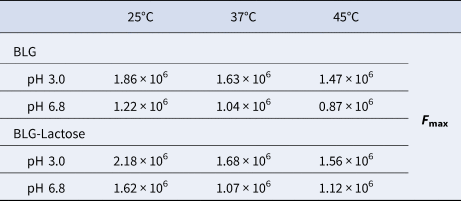
The percentage changes in F max at pH 6.8 were calculated as 33.3, 2.8 and 27.1% at the temperature of 25, 37 and 45°C, respectively. The same calculation was also applied for pH 3 and the results were 17.1, 2.6 and 6.1% at the temperature of 25, 37 and 45°C, respectively. The results indicated that the changes at 25°C were the most drastic one at both pH conditions. In addition to the smallest change in FI at 37°C, there is no significant difference according to the pH value.
The adverse temperature dependence of FI as in our BLG-lactose complex indicated that the stability of the complex decreases with rising temperature. In other words, BLG-lactose interaction boosts the FI but the complex due to this interaction is thermally unstable. It should be noted that the lactose effect on FI at 37°C is not as drastic as at 45°C (Table 1), which means that the decrease in FI at 37°C was mainly due to BLG's instability. Ghalandari et al. (Reference Ghalandari, Divsalar, Saboury, Haertlé, Parivar, Bazl, Eslami-Moghadam and Amanlou2014) showed that total fluorescence of BLG was more accessible to quencher at 37°C compared to 25°C. Moreover, Thomas et al. (Reference Thomas, Scher and Desobry2004a) mentioned that the lactose in whey powders produced by spray drying or freeze-drying was very sensitive to changes in temperature and water content.
The pH dependent FI changes can be monitored more clearly in Table 1. Regardless of the presence of lactose, the highest FI was obtained at pH 3 at all temperatures. In our previous studies, it was observed that BLG had a higher FI at pH 3 due to the preserved Trp residues within ‘hydrophobic pockets’. This is explained by the charged dependent conformational change of BLG at pH 3 where BLG is overall positively charged and more hydrophobic in the sense that nonpolar solutes are more effectively shielded from aqueous solvents and a more compact configuration is formulated (Cardamone and Puri, Reference Cardamone and Puri1992). Meanwhile, at close to pH 3, BLGs are known to be mainly monomeric, yet they are mainly dimeric at a neutral pH (Busti et al., Reference Busti, Gatti and Delorenzi1998) and this pH dependent monomer–dimer transition may also change the FI of BLG. Mills and Creamer (Reference Mills and Creamer1975) reported that Trp fluorescence of BLG was reduced in intensity by association of the monomeric proteins into dimers, which is consistent with the trend shown in Table 1.
Fluorescence intensities of mucin and lactose mixtures
When we examined the pH-dependent change of the interaction of lactose with mucin protein by fluorescence spectroscopy technique, unlike the lactose-BLG mixture, the lactose–mucin mixture gave a higher FI at pH 6.8 (Fig. 2). Since the isoelectric point of mucin is around 2, the mucin becomes more negative when the pH is 6.8. However, at pH 3, the mucin molecules become protonated and the negative charge value decreases. This was shown in the result of our previous zeta potential studies (Yılmaz et al., Reference Yılmaz, Lee and Chronakis2021).
Fluorescence intensity spectra of mucin with and without lactose (10 mM) at different pH (pH 3 and 6.8) conditions.
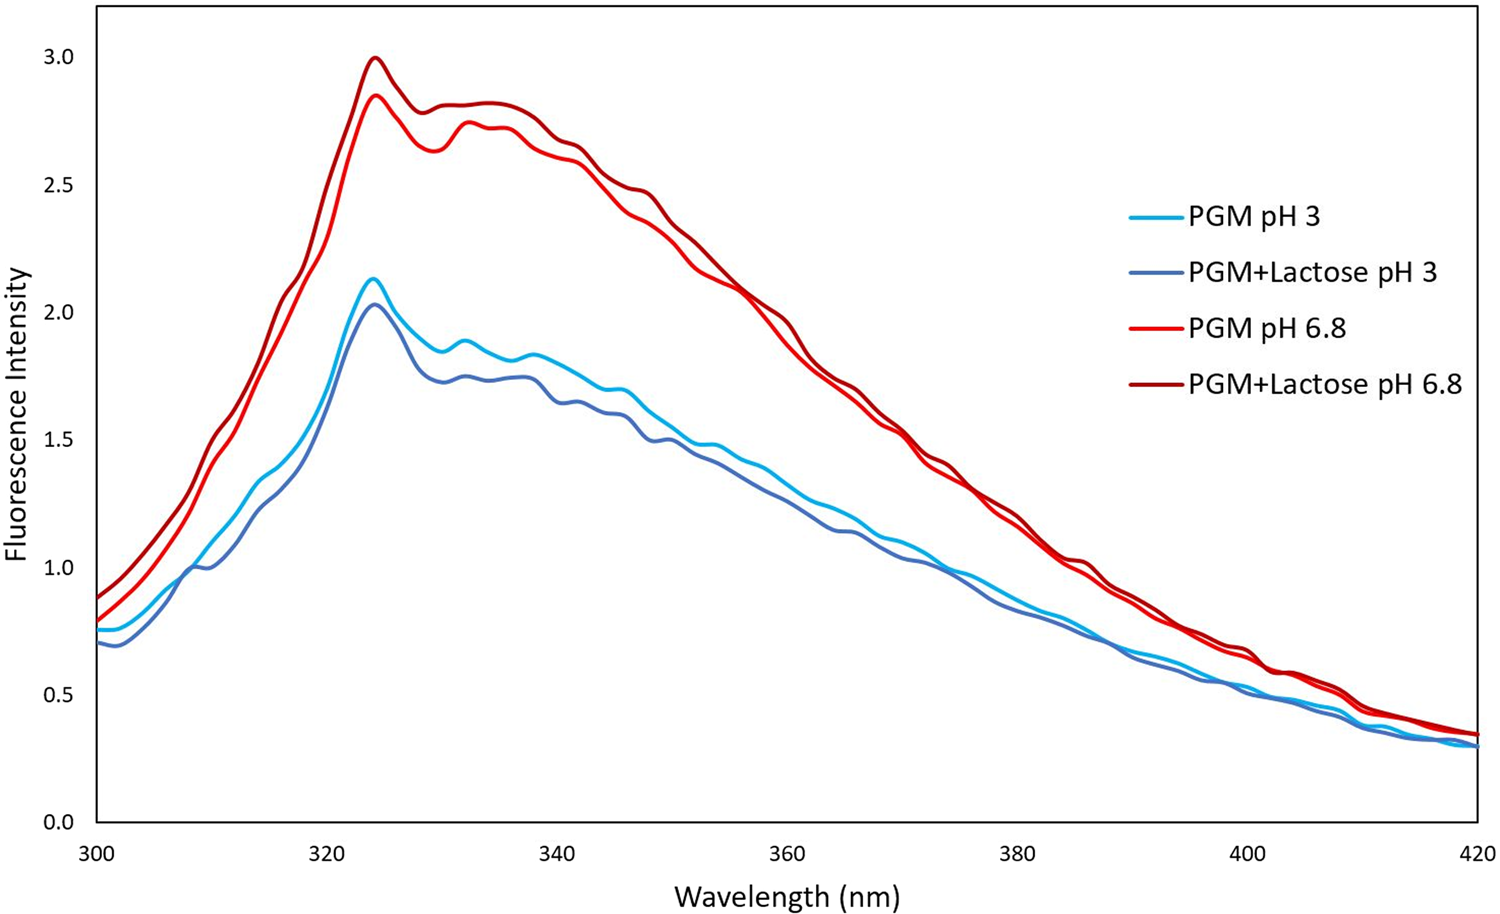
It is well known that gastric mucin undergoes a conformational change from a random coil conformation at pH ≥ 4 to an anisotropic, extended conformation at pH < 4 where mucin molecules cluster together (Cao et al., Reference Cao, Bansil, Bhaskar, Turner, LaMont, Niu and Afdhal1999; Celli et al., Reference Celli, Liu, Dadmohammadi, Tiwari, Raghupathi, Mutilangi and Abbaspourrad2020). Moreover, at low pH values, mucin molecules have increasing exposure of hydrophobic binding sites due to conformational transitions (Smith and LaMont, Reference Smith and LaMont1984).
According to Figure 2, it was observed that the presence of lactose did not have a significant effect on the mucin protein FI value. For this reason, no trace of interaction was found between mucin and lactose according to fluorescence spectroscopy results.
sem images of BLG–lactose and mucin–lactose mixtures
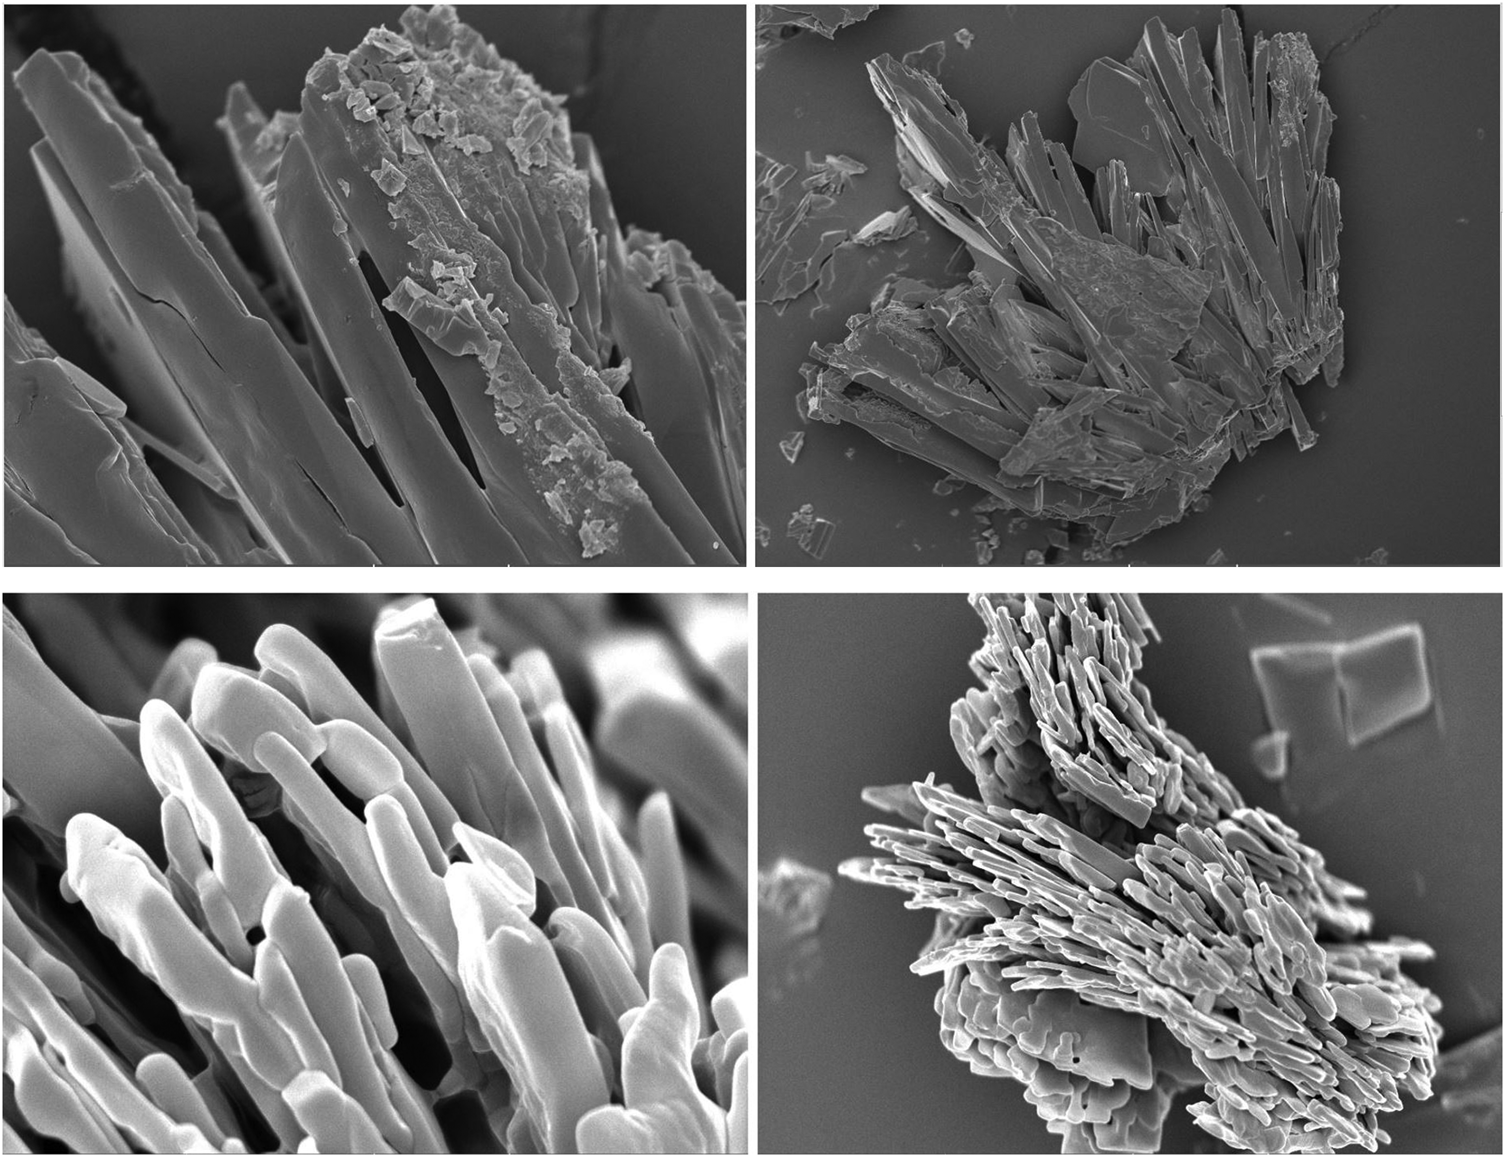
sem was used as a complementary technique to confirm the fluorescence spectroscopy results of protein–lactose systems. When BLG-lactose and mucin–lactose interactions were examined with sem images, we observed lactose crystals gathered around and on the BLG molecule, but lactose molecules could not be seen in the presence of mucin (Fig. 3). The sem results support the fluorescence results in the sense that lactose molecules surrounding the BLG surface probably protected the fluorophore against solvent quenching, at least to some extent. The same does not happen with mucin. Presumably, lactose molecules vanished inside the comparatively large mucin molecules and so had no significant effect on mucin fluorescence.
Scanning electron micrographs of (a) BLG–lactose and (b) PGM–lactose.
Effect of mucin on fluorescence intensity of BLG–lactose mixtures
The pH-dependent FI change of mucin is negligible when compared to the FI change of BLG protein. This was also shown in our previous study; the FI of mucin is very low when compared to BLG. Since mucin is a random coil conformation, the Tyr residues of mucin molecules are quenched due to solvent exposure. The effect of mucin on the lactose–BLG interaction was examined according to the fluorescence results given in Figure 4. An increase of BLG FI has already been shown in the presence of lactose (Fig. 1), but interestingly this increase became more dramatic when mucin was added.
Fluorescence intensity spectra of BLG, lactose and mucin mixture at pH 3 and pH 6.8.
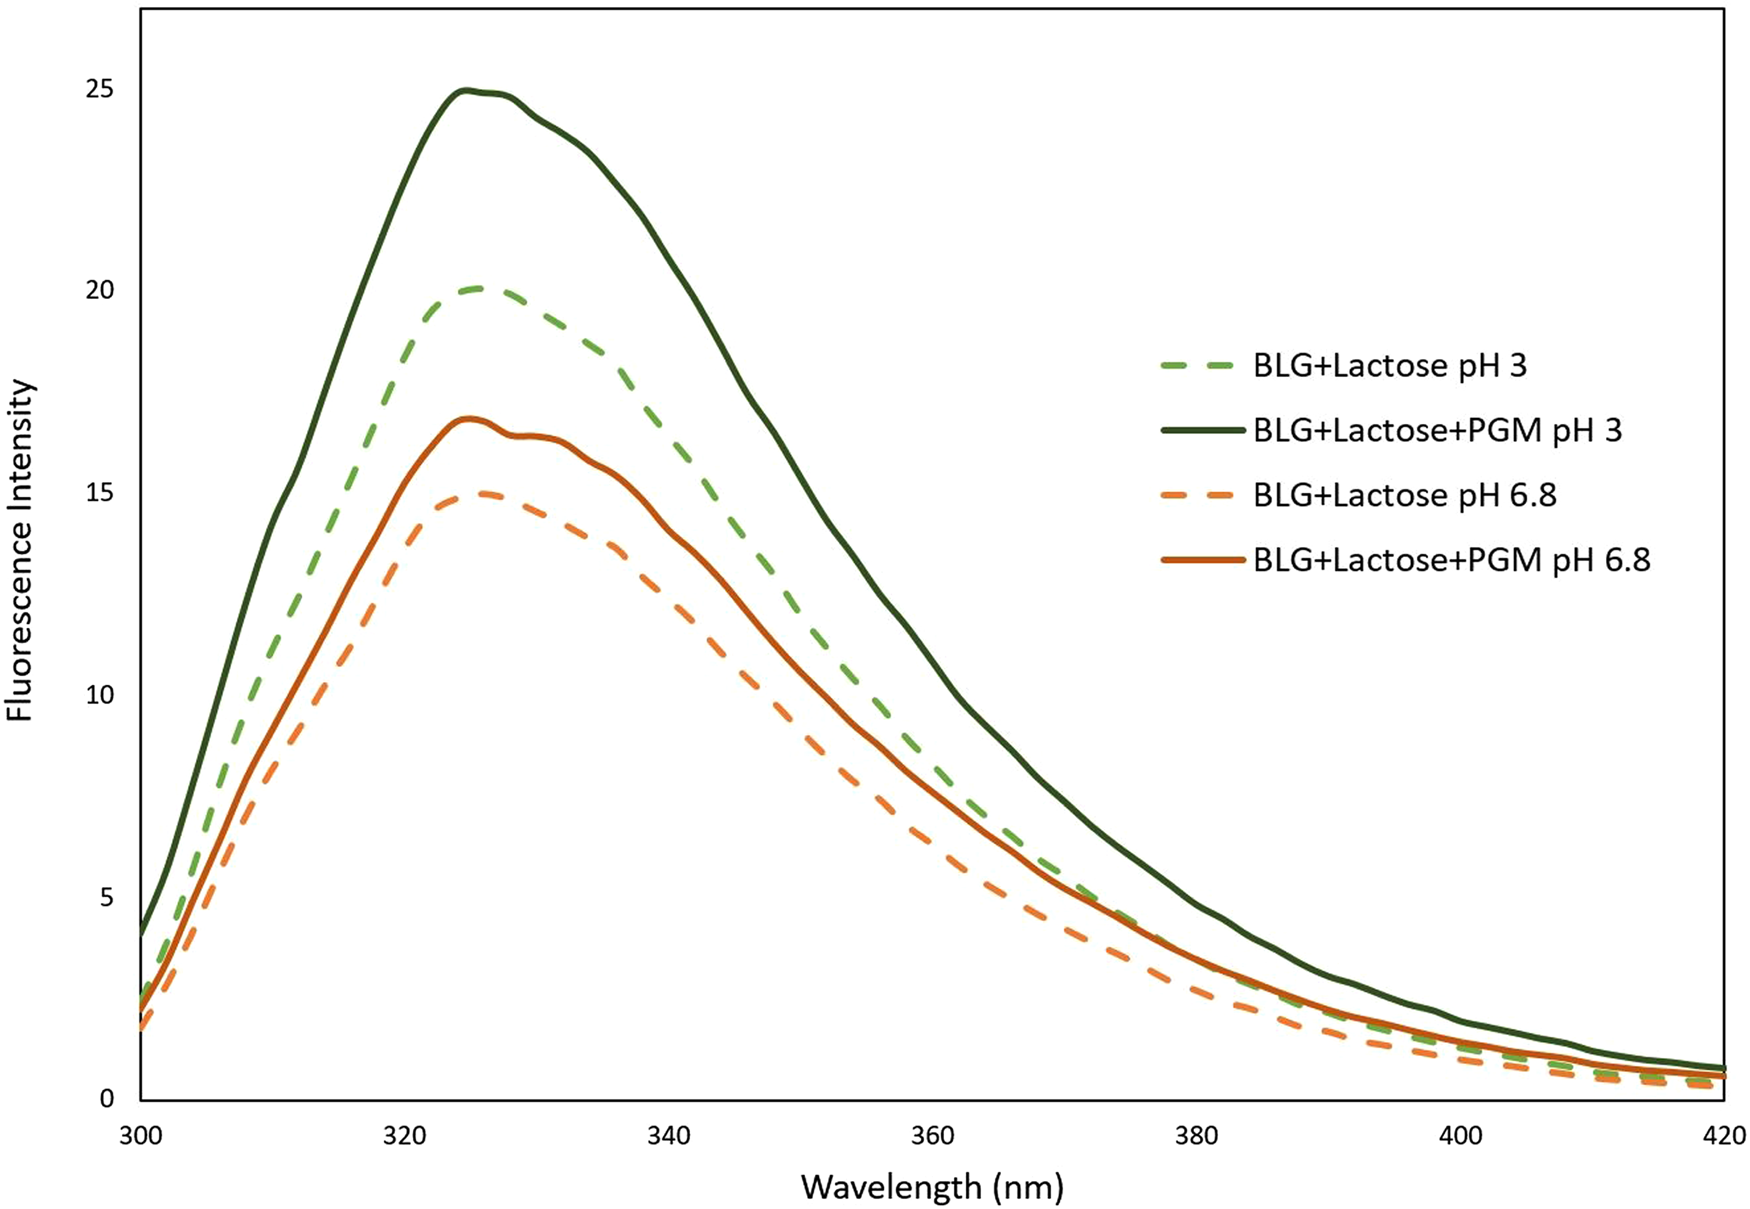
According to our previous study, mucin causes a decrease in the FI of BLG (Yılmaz et al., Reference Yılmaz, Lee and Chronakis2021). However, the increase of FI in the presence of lactose can be explained as follows: lactose binds to BLG, forming a protective barrier around it. When mucin was added after BLG-lactose interaction, the mucin could not bind to BLG and could not change its conformation, because lactose molecules were already bound with BLG. Thus, lactose reduces the binding between BLG and mucin. The fact that mucin caused an extra increase in the FI of BLG may be due to the inability of mucin to form hydrophobic interactions with BLG in the presence of lactose, meaning that mucin would only have electrostatic and hydrogen bond interactions with BLG. Lack of hydrophobic interaction could mean that Trp residues in the hydrophobic part of the BLG molecules continued to be preserved from solvent related quenching. The high FI increase at pH 3 supports the presence of the electrostatic interaction.
When mucin is added to the BLG-lactose mixture, it interacts through electrostatic attraction and the mucin molecules form an extra protective layer around the BLG molecules, reducing exposure to solvent. Therefore, the protected Trp residues (probably not only in the hydrophobic part but also in the outer Trp residues of BLG) result in higher FI. Our prediction of BLG-lactose, mucin–lactose and BLG–lactose–mucin interactions based on both fluorescence and sem results is illustrated in Figure 5.
Illustration of the interactions between BLG–lactose, PGM–lactose, and BLG–lactose–PGM.
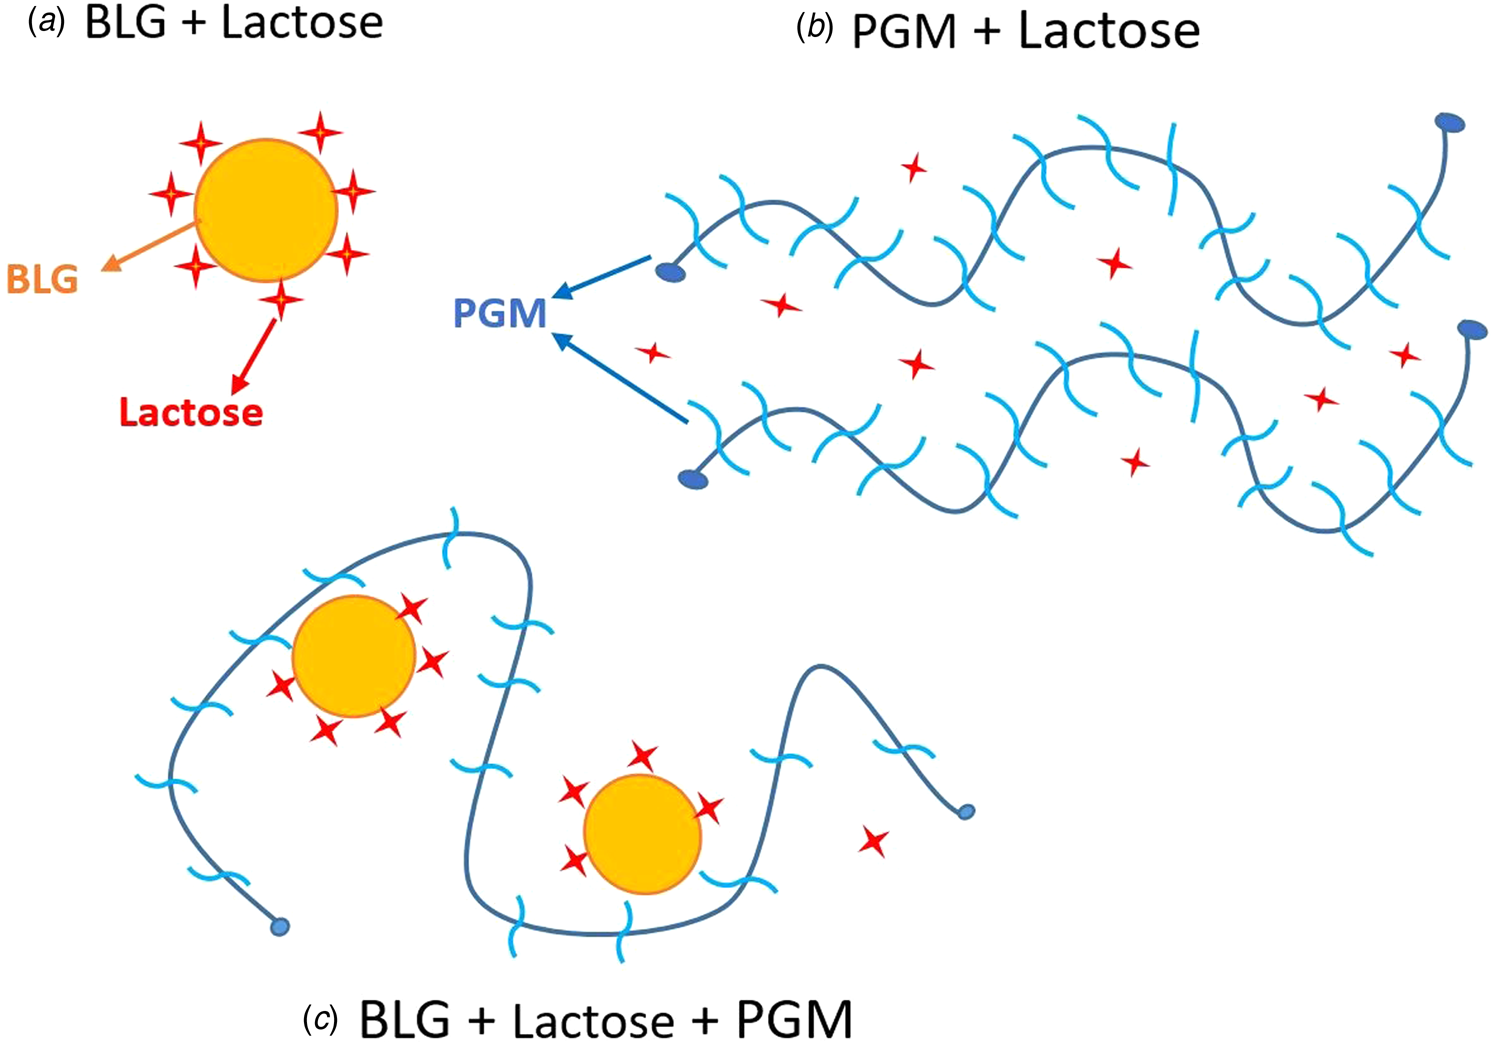
The electrostatic interaction with the proteins can facilitate re-folding of the proteins at low pH (Ali et al., Reference Ali, Prakash, Kulkarni, Ahmad, Madhusudan and Bhakuni1999). Not only the BLG but also the unfolded terminal regions of PGM at pH 3 (Cao et al., Reference Cao, Bansil, Bhaskar, Turner, LaMont, Niu and Afdhal1999; Madsen et al., Reference Madsen, Sotres, Pakkanen, Efler, Svensson, Abou Hachem, Arnebrant and Lee2016) may undergo folding again after binding with BLG, or with BLG–lactose complex. Thus, the indole in BLG Trp can be buried in the hydrophobic protein matrix.
In conclusion, a lactose induced increase in BLG FI has been indicated by our fluorescence measurements, but the complex due to this interaction is thermally unstable. A higher FI at pH 3 is explained by the charged dependent conformational change of BLG at pH 3 where BLG is overall positively charged and more hydrophobic in the sense that nonpolar solutes are more effectively shielded from aqueous solvents. By contrast, lactose does not have a significant effect on the mucin protein FI value. When BLG–lactose and mucin–lactose interactions are examined with sem images, lactose crystals can be seen gathered around and on the BLG molecule, but lactose molecules cannot be seen in the presence of mucin. Mucin added to the BLG-lactose mixture, interacts through electrostatic attraction and the mucin molecules form an extra protective layer around the BLG molecules, thereby reducing solvent exposure. As the Trp residues are protected, FI is increased. As the molecular-level interactions of milk proteins, milk sugars and salivary proteins are critical for a full understanding of the textural, sensory and nutritional properties of food products during digestion, the findings of this study may provide a valuable background for dairy food processing and related applications of BLG–lactose systems.
Acknowledgments
The author acknowledges support from Bartın University which funded the research through BAP Project number 2019-FEN-A-015


 Open access