


Across the United States and for the past 40 years, district-based elections have served as a key tool for increasing the presence of otherwise underrepresented racial and ethnic groups in local elected office. A 1982 amendment to the Voting Rights Act (VRA) and a subsequent Supreme Court decision (Thornburg v Gingles, 1986) precipitated a dramatic shift to district-based local elections in the South; that in turn led to an equally dramatic increase in Black representation in local legislatures (Davidson, Reference Davidson1994). More recently, the California Voting Rights Act (CVRA)—signed into law in 2002—explicitly stated that at-large elections must not be used “in a manner that impairs the ability of a protected class to elect candidates of its choice,” which has led to a dramatic shift towards local district-based elections in that state; nearly one-third of California cities shifted to district-based elections since its passage.
District-based elections are a central feature of local governance in the United States, and they are documented to have a clear impact on racial/ethnic representation in local legislatures. The shift to districts at the local level is largely from multi-member at-large elections, meaning a slate of council members is elected from one election with the entire city as the electorate (Bullock and Gaddie, Reference Bullock and Gaddie1993). District reforms, like those facilitated by the CVRA, divide the city up into geographically defined areas of similar population size, and the constituents of each district elect a single representative. These elections are majoritarian, winner-take-all, and institute single-member representation in the city council (Gerber et al., Reference Gerber, Morton and Rietz1998). Districts disperse electoral power throughout the city and ensure representatives are elected from different neighborhoods. Conversely, electoral power in at-large systems favors the median voter, and in these systems it is difficult for minority candidates to win (Gerber et al., Reference Gerber, Morton and Rietz1998; Trounstine, Reference Trounstine2010).
Extant literature on district reforms has focused on race and ethnic minority representation, primarily because these communities were central in adopting district policies in the first place. We review this literature below, in part to underscore its continuing importance in districting (Hutchings and Valentino, Reference Hutchings and Valentino2004). We expand the question of whether districts increase representation for minorities to include class; wealthy, white-collar communities are consistently over-represented in terms of who gets elected, at every level of government (Carnes, Reference Carnes2013; Reference Carnes2020). Therefore, the central question of our paper is, Does the use of at-large vs. district-based elections affect the descriptive representation of less-affluent residents and neighborhoods on municipal councils?
District reforms to ensure representation for racial and ethnic minorities may also likely impact other dimensions, due to the presence of correlations between race and class. In addition to prioritizing representation of a racial or ethnic minority group, do district reforms disrupt the representation for wealthier individuals and neighborhoods, traditionally robust in at-large city council systems (Schaffner et al., Reference Schaffner, Rhodes and Raja2020)?
To address these questions, we construct a statewide map of all newly drawn city council districts in California in the 2010s—which accounts for council districts in well over 100 cities. We link our map to Census demographics and the residential locations of council candidates. We also draw on a dataset of council candidates and winners where we have, in some cases, via hand-collection of data, attached a variety of characteristics of these individuals, again for candidates and members across the state. With those data in hand, we use a difference-in-difference approach to estimate the causal impacts of district-based elections on the characteristics of council candidates and members, as well as the neighborhoods they are coming from. We operationalize “neighborhoods” as Census block groups, mapped to city council districts in California, for all cities in the state with district elections.
Our results show clear impacts of district-based elections on class-based representation. Specifically, we find that council candidates and members are significantly more likely to reside in lower-income and higher renter-share neighborhoods and are less likely to self-report a “business”-related occupation. While we also replicate prior findings on racial/ethnic (in this case, largely, Latino) representation, our class-based results are true even for (and perhaps especially for) white candidates and members. We include measures for percentages of renters and Supplemental Nutrition Assistance Program (SNAP) recipients, and average per capita income levels in the neighborhood. These measures reflect descriptive representation for the neighborhoods in which candidates and members reside.
We view our results on socioeconomic representation on council as contributing to critical discussions on the lack of representation along these dimensions—and what that might imply for policy outcomes and inequality. Einstein et al. (Reference Einstein, Ornstein and Palmer2022), for instance, document dramatic underrepresentation of renters in elected office and point to that as a potential driver of longstanding homeowner-favoring housing and zoning policy. City council members are also systematically wealthier than the populations they govern (Schaffner et al., Reference Schaffner, Rhodes and Raja2020); while not explicitly in the context of local government, Carnes and Lupu (Reference Carnes and Lupu2023) review the variety of impacts that overrepresentation of the wealthy in office may have on political and policy outcomes. Our results point to one institution that has an impact on these fronts: district-based elections.
1. Drawing theoretical predictions from prior work
1.1. Districts, homeownership, and socioeconomic status
Overrepresentation of the wealthy is documented in every level of American government; only 10% of city council members are from working-class occupational backgrounds, higher than state legislators, members of Congress, governors, Supreme Court justices, or US presidents (Carnes, Reference Carnes2020; Kirkland, Reference Kirkland2021). Aside from occupation, a traditional indicator of wealth or class is homeowner status. Often extolled as a virtue in politics, homeownership is associated with familial economic prosperity and long-term investment in community (Basolo, Reference Basolo2007).
Homeownership is associated with external interest group activity in local politics; in cities with high rates of homeownership, there is less interest group activity in local politics (Anzia, Reference Anzia2022). This indicates more citizen participation and more responsiveness by local leaders, as homeowners participate more in local politics by voting and attending council meetings (Einstein et al., Reference Einstein, Ornstein and Palmer2022). Recent home buyers begin to participate more after purchasing a home, and are activated most by local zoning policies (Yoder, Reference Yoder2020; Hall and Yoder, Reference Hall and Yoder2022). At the local level, land use is a dominant area of policymaking; zoning plans prioritize the interests of homeowners over others to protect most people’s most valuable assets (Trounstine, Reference Trounstine2018; Einstein et al., Reference Einstein, Ornstein and Palmer2022). In both political participation and policy responsiveness to their concerns, homeowners are overrepresented at the local level.
There is little variation in elected officials’ homeowner or renter status; most are owners (Carnes, Reference Carnes2013; Einstein et al., Reference Einstein, Ornstein and Palmer2022). City council members do not rent in large numbers in any system, but Einstein et. al find that renters are no less likely to win than candidates who own their homes. However, they do find a gap earlier in the process, at the candidate recruitment stage (Einstein et al., Reference Einstein, Ornstein and Palmer2022). This finding is commensurate with other scholarship that finds institutional or structural forces, such as socioeconomic status, are major factors in the decision to run for office at all (Welch and Bledsoe, Reference Welch and Bledsoe1988; Spicer et al., Reference Spicer, McGregor and Alcantara2017; Phillips, Reference Phillips2021). Childhood poverty can have indelible dampening effects on people’s confidence in their own qualifications for office when considering candidacy (Levine and Abromowitz, Reference Levine and Abromowitz2023). The lasting insecurity left by poverty diminishes the likelihood that many people who experienced poverty as children will run.
In a survey of candidates for local office in the Chicago area, Oliver et al. (Reference Oliver, Ha and Callen2012) find a lack of congruence with the general population. Most candidates are long-term residents of their communities who own their homes, are over 50, typically white men with college degrees (98). The variety is in occupation; most candidates are motivated by a civic duty to public service with a responsibility to the community. These positions are in the public sector, management, and law industries that can give would-be candidates experience working with the public and like homeownership, can demonstrate a similar long-term investment in the community (99).
Institutional reform that alters the parameters of an election may impact the decision to run for office at the recruitment stage, particularly for candidates with lower-income backgrounds. Due to economic variance in different districts, those who run for office as civic or economic elites are more likely to be diverse than in at-large systems. In this way, districts force diffusion of the centers of local political power. In a model of candidate recruitment, Jacob (Reference Jacob1962) suggests that workers from “brokerage” occupations from any class ought to be engaged. Brokerage occupations include lawyers, restaurateurs and hoteliers, insurance and car salespeople, and local union officials (709). Workers in these industries have transferable skills for politics: “the ability to convince, the art of inspiring trust and confidence” (710). However, the majority of recruited candidates are white collar professionals. Blue-collar workers are harder to recruit for office because they have a harder time fundraising for campaigns that are not considered “safe bets” to win by political elites (Carnes, Reference Carnes2020).
In the absence of party influence in nonpartisan systems, other organizations can emerge in candidate recruitment. For instance, labor unions have a vested interest in developing their members for political office. Where unions are stronger, more workers run and win (Sojourner, Reference Sojourner2013). District systems can diversify who is recruiting as well. Nationally, the vast majority of city council members come from a white-collar background (Carnes, Reference Carnes2013; Reference Carnes2020), but districts have been found to impact council representatives’ income and education level more than nonpartisan elections, local population, median education levels, and racial demographics (Welch and Bledsoe, Reference Welch and Bledsoe1988).
These are all important factors, because policy representing lower-income voters’ interests may be affected by who is in office. For example, land use policies may be impacted by district reforms if the council itself becomes more economically diverse. Wealthy, white neighborhoods are disproportionately represented in at-large systems (Lineberry, Reference Lineberry1977; Heilig and Mundt, Reference Heilig and Mundt(1984)). Fundamental to arguments for district reform is that they facilitate a more diverse city council, as a result of smaller costs of running a smaller-scale campaign in a single district rather than an at-large election with a city-wide electorate. Extant literature has found higher campaign expenditures in at-large races, including within hybrid cities featuring both districts and at-large members (Heilig and Mundt, Reference Heilig and Mundt(1984); Hogan and Simpson, Reference Hogan and Simpson2001; Malinowski, Reference Malinowski2013). Others challenge these conclusions, however, comparing cities to find the size of city and prestige of serving in a larger city’s local government may have more influence over campaign costs. For instance, Adams (Reference Adams2018) found that campaigns for office in small cities bring down absolute and per-voter costs, since holding public office in smaller cities is viewed as less prestigious, which makes candidate background more important. Candidate background, like occupation and socioeconomic status, may matter most in nonpartisan systems as well, in lieu of a party identification heuristic for voters (Krebs, Reference Krebs2001). Given the uniformity of nonpartisan elections in California, we hypothesize that district reforms allow for more economically diverse city government.Footnote 1
1.2. District-based elections and racial/ethnic representation
Extant literature on descriptive representation primarily considers dimensions of race and ethnicity, and for good reason, given the centrality of race and ethnicity in policies adopting district-based elections, and the construction of districts themselves. Early in the 20th century, wards or districts as the vehicle for racial and ethnic minorities’ representation was among the main arguments by Progressive Era reformers supporting at-large systems (Banfield and Wilson, Reference Banfield and Wilson1963; Trounstine, Reference Trounstine2008). Later, following the passage of the VRA in 1965 (and especially following an amendment to the VRA in 1982), many local jurisdictions in the South were court-ordered to adopt districts to address the barriers Black voters faced in electing their preferred candidates; others did so preemptively in anticipation of legal action (Davidson, Reference Davidson1994).
District-based elections increased descriptive representation for African Americans, a consistent finding owing to relative consistency in geographic concentration of Black communities, an ongoing legacy of segregation (Karnig, Reference Karnig1976; Robinson and Dye, Reference Robinson and Dye1978; Engstrom and McDonald, Reference Engstrom and McDonald1981; Engstrom, Reference Engstrom1987; Welch, Reference Welch1990; Trounstine, Reference Trounstine2008). Districts make descriptive representation for these communities more likely, since city-wide turnout and an appeal to a white majority are not necessary to elect a council member (Trounstine and Valdini, Reference Trounstine and Valdini2008; Hajnal, Reference Hajnal2010). Black communities winning city council seats through districts was particularly strong in the South, where they were prohibited from voting en masse until the VRA’s passage in 1965 (Davidson, Reference Davidson1994; Shah et al., Reference Shah, Marschall and Ruhil2013).
Latinos are the largest minority in the country, and the largest racial or ethnic group in California, where they comprise about 40% of the total population (Lopez, Reference Lopez2014; Funk and Lopez, Reference Funk and Lopez2022). Population growth and the CVRA have inspired recent studies on descriptive representation exploring the fortunes of Latino communities in local and state institutions. Collingwood and Long (Reference Collingwood and Long2021) found CVRA-era district reforms in California improved minority representation in high-density Latino cities by more than 20%. Around the country, Latino communities have benefited from districts when densely concentrated within district boundaries, as well as from larger councils with more members, and as Latino candidates may drive mobilization (Taebel, Reference Taebel1978; Bullock and MacManus, Reference Bullock and MacManus1990; Jones-Correa, Reference Jones-Correa1998; Sass, Reference Sass2000; Barreto, Reference Barreto2007).
Studies examining California school board elections find similar results. Abott and Magazinnik (Reference Abott and Magazinnik2020) use the CVRA to find an increase in one additional Latino school board representative for every three elected seats following district reforms in areas with high Latino populations and a high degree of residential segregation. Leal et al. (Reference Leal, Martinez-Ebers and Meier2004) find at-large elections detrimental for Latino representation on California school boards, especially in areas where they constitute a minority. In both city councils and school boards, district reforms have resulted in increased representation for Latino populations, largely with high numbers and in concentrated communities, both consistent with traditional findings.
2. Institutional details
2.1. California city councils
All city council elections in California are nonpartisan. Part of the Progressive Era reform movement that resulted in at-large city councils being the norm, nonpartisan elections were intended to support a motivated and informed public outside of the divisiveness in party politics (Macmanus, Reference Macmanus1978; Schaffner et al., Reference Schaffner, Streb and Wright2001). Nonpartisan elections affect voters’ considerations by removing a prominent heuristic in vote choice: party identification (Kirkland and Coppock, Reference Kirkland and Coppock2018). Effects on minority representation in nonpartisan elections are inconclusive; some find depressed turnout overall and strengthened incumbent advantage, which can both reinforce the status quo (Schaffner et al., Reference Schaffner, Streb and Wright2001). Others find that emphasis on candidates’ professional and political experience may be used to compensate for a lack of party heuristic, but does not translate to an automatic party advantage for candidates (Schaffner et al., Reference Schaffner, Streb and Wright2007; Kirkland and Coppock, Reference Kirkland and Coppock2018). We do not consider the partisanship of candidates or the electorate, because there is no change or variation in the nonpartisan election type in the state. However, nonpartisan elections contribute to the political environment in which district reforms take place.
California council members serve four-year terms, elected via staggered elections every two years.Footnote 2 Most councils have five members; with the exception of the largest cities, deviations from the five-member structure still result in relatively small groups of seven- or nine-members.
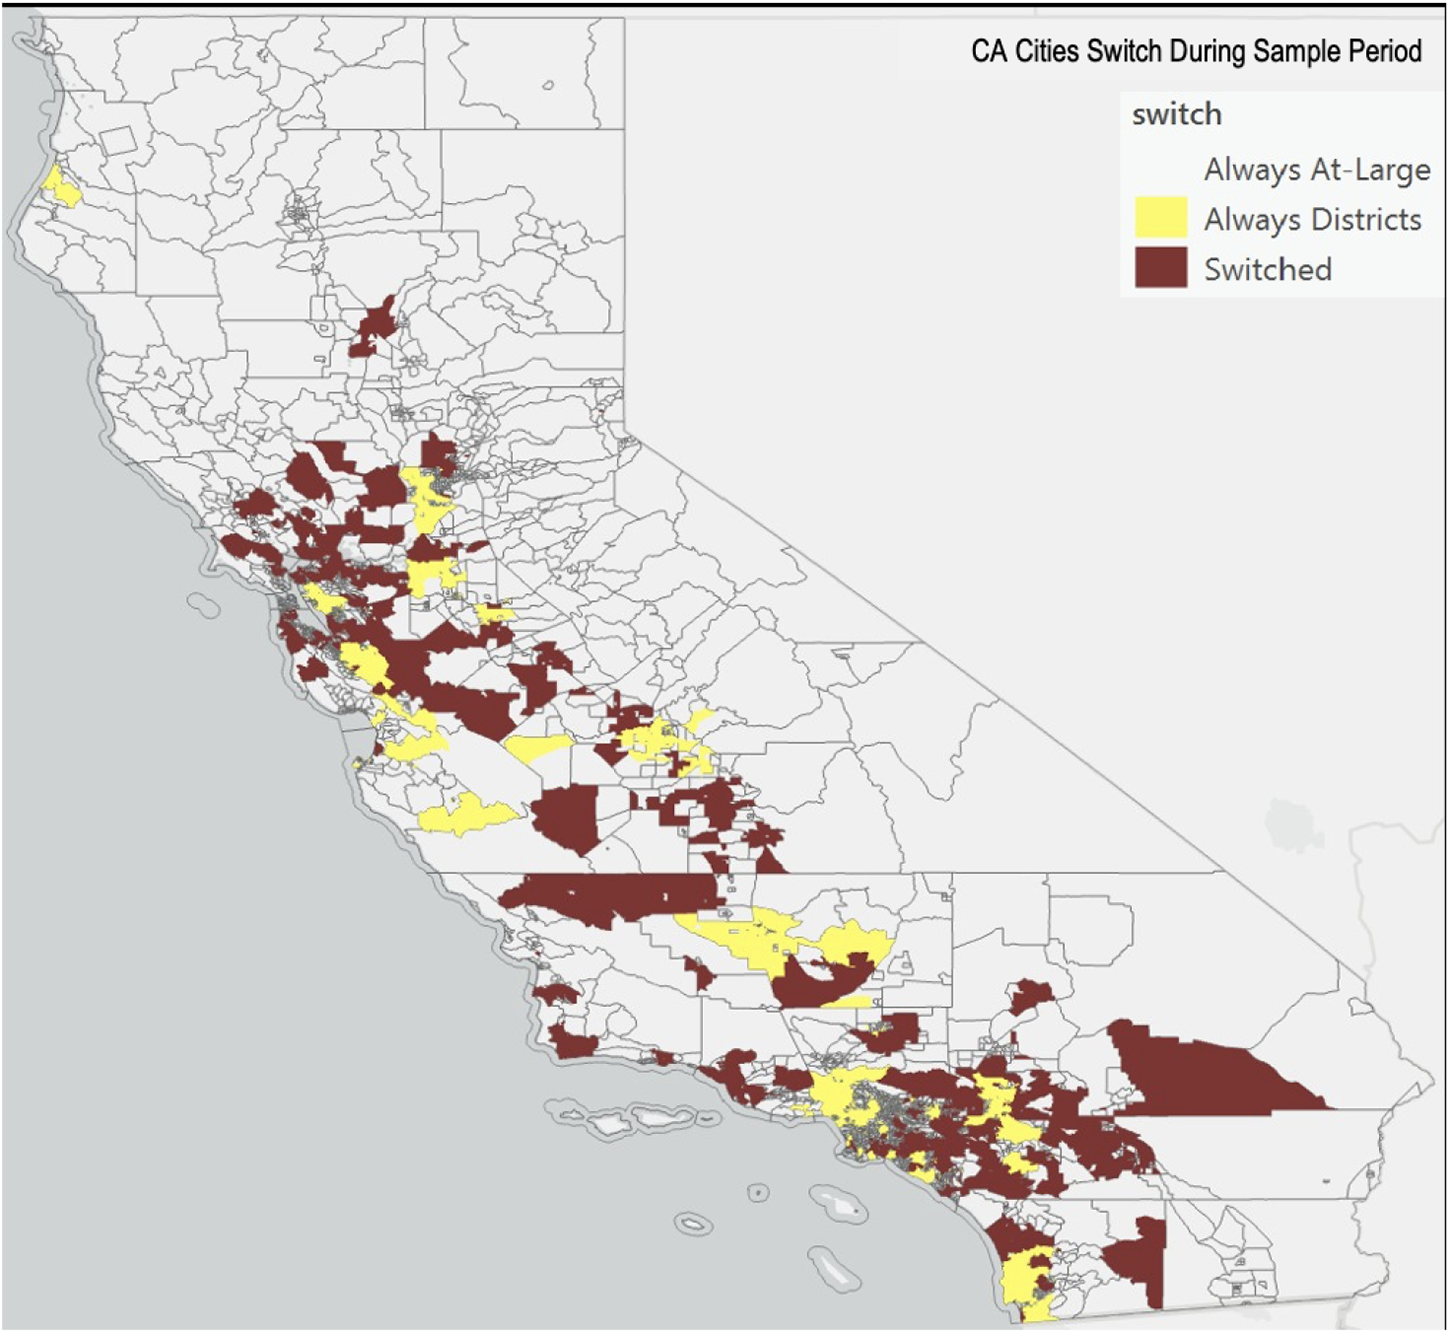
We identify—for all cities in California—whether and when they switched from at-large to district-based elections. We find that by 2011, only 40 cities (roughly 8%) of cities were using district-based elections. As outlined above, this changed dramatically during the 2010s: in our data on all California cities, by 2020, roughly 150 cities (31%) use district-based elections. All but five of the cities that shifted to district-based elections after 2011 did so in the period from 2016 to 2020. We document which cities were always at-large during our sample period, always districted during our sample period, or switched from at-large to district-based in Figure 1. A primary takeaway is that the switching cities are relatively spread throughout the state.
Cities by at-large vs. district-based elections during the sample period (2008–2020).

3. Map of cities shifting to district-based elections
3.1. California Voting Rights Act
To study the impacts of district-based elections on multiple dimensions of council composition, we leverage shifts to district-based elections stemming from the CVRA of 2002. The Act specified that “An at-large method of election may not be imposed or applied in a manner that impairs the ability of a protected class to elect candidates of its choice or its ability to influence the outcome of an election, as a result of the dilution or the abridgment of the rights of voters who are members of a protected class,” with protected class defined as “voters who are members of a race, color or language minority group.” As noted, at the time (and into the early 2010s), with the exception of the largest cities, most cities in California employed at-large elections. We direct readers to Abott and Magazinnik (Reference Abott and Magazinnik2020) and Hankinson and Magazinnik (Reference Hankinson and Magazinnik2023) for detailed discussions of the history of the CVRA and why the largest share of shifts to district-based elections occurred in the 2010s, a decade after the passage of the Act; in short, a major piece of the explanation for the gap in timing is that organizing groups who initiated potential legal action under the Act faced “internal capacity constraints and competing priorities” (Hankinson and Magazinnik, Reference Hankinson and Magazinnik2023).
4. Data
We construct a unique database combining information from the California Elections Data Archive (CEDA), the US Census, the American Community Survey (ACS), the National Association of Latino Elected and Appointed Officials (NALEO), the California Voter Registration Database, and hand-collected information on candidate characteristics. Using this dataset, we analyze block-group-level demographic data and individual-level candidate data to estimate the impact of switching to district-based elections on descriptive representation in 118 California cities. We outline the data construction in greater detail in the remainder of this section.
4.1. District maps and characteristics
Most critical to our analysis is the mapping of Census block groups to city council districts for all cities in California with district-based council elections. Such a mapping allows us to compile and aggregate to district-level a variety of block-group-level demographic, socioeconomic, and partisan characteristics of residents. To do so, we begin from voter file data from 2020, which reports voters’ addresses—which in turn are geocoded to Census block groups—and also the city council district they are assigned to as of 2020. This then immediately facilitates a mapping of block groups to districts. Some share (29%) of block groups are split across districts. However, amongst these split block groups, most are primarily contained within a single district. We drop any block-group–district pairings where less than 50% of the block-group population is contained within the district in question. This generates a unique block-group–district mapping. Amongst these, for each block group in the resulting dataset, the average share of the population contained within the district that we assign it to is 96%.Footnote 3
We then merge a variety of block-group variables into this dataset and aggregate them to the district-level to facilitate our analysis of the composition of districts. We draw especially on block-group-level demographic and socioeconomic characteristics, which are drawn from the 2010 Census and the five-year compilation of the 2008–2012 ACSs. Specifically, we draw in block-group-level counts of population and households by income level, renter/owner status, and receipt of social assistance. We draw on the Census’s special tabulation of citizen voting age population (CVAP) by race/ethnicity as a source for block-group race/ethnic composition. That also draws on data collected from the 2008 to 2012 ACSs.
Aggregating all of these characteristics to the city council district-level provides a snapshot of district composition in the 2010s, when a vast majority of cities that switched to district-based elections did so. These characteristics at the district-level are summarized in Table 1. Given that the aims of the CVRA and shifts to district-based elections were focused on racial and ethnic representation, we split summary statistics by district race composition (majority white vs. not majority white) in Columns 1 and 2, with full sample averages in Column 3. Doing so previews the correlations between racial/ethnic composition of districts and other characteristics (income, partisan composition, etc.), which may in turn imply that these shifts have broader impacts on representation.
Average district characteristics, split by racial composition

4.2. Candidate characteristics
Our main results center around how district-based elections change who runs for council and who is elected. This subsection describes how we construct our dataset on candidate characteristics. The core dataset used is the CEDA, which reports the universe of candidates for local offices in California from 1995 to 2020. We use data from city council elections from 2008 to 2020. We removed cities that held district-based elections throughout the entire period, as they did not experience a system change. Our sample therefore consists of candidates in cities that switch to district-based elections between 2008 and 2020, as well as (for the sake of a clean control group in the difference-in-difference analysis) cities that are at-large the entire time. There are 13,688 candidates in our resulting subset of the CEDA data.
CEDA data list candidates’ names, office contested, voteshare, and victory or loss. The data also note the ballot designation that appeared on the ballot; this is often the candidate’s occupation. We take advantage of the ballot designation to provide at least one measure of candidates’ professional background. The largest share of candidates indicates that their occupation is “businessperson” or something related, so in our analysis, we compare people with business or finance-related occupations to all others. Specifically, we tag a candidate as having a business or finance-related occupation if any of the following strings appear in their ballot designation: business, owner, entrep, executive, investor, capitalist, banking, finance, accounting, accountant. This categorization is similar in spirit to the work of Carnes (Reference Carnes2013), categorizing members of legislatures as being in “profit-oriented professions.”
Then, because candidates who have won in the past and are incumbents often simply list “incumbent” or “city councilmember” as their ballot designation, we tag individual candidates as having a business/finance-related occupation if they ever list any of the above strings across the multiple years that we see them in the data. Most typically, this will be drawn from their first appearance as a candidate. With this approach, roughly 28% of candidates are tagged as having a business/finance-related occupation. Appendix Table A3 lists all categories that we coded, some examples of ballot designations from each category, and the relative frequency of each category.Footnote 4
CEDA data report only the information that appears on the ballot and the results of the election; it therefore does not report candidates’ demographic characteristics. For candidate race and gender, we draw on data from Beach and Jones (Reference Beach and Jones2017) and Beach et al. (Reference Beach, Jones, Twinam and Walsh2024). The online appendix describes their data construction process in more detail; we extend their data to include additional years using the same process.
We gather additional information about candidates by matching candidate observations in the CEDA data to the 2016 California Voter Registration Files, matching by name and city. These data provide candidates’ home address. The home address is then geocoded to Census block groups and matched to Census data to provide some information on characteristics of the neighborhood that a candidate lives in (e.g., income, share of renters, etc.).Footnote 5
4.3. Date of adoption of district-based elections
Finally, we also use the California Election Data Archive to identify the first election year that a city used district-based elections. In elections where cities use district-based elections, the district that a candidate is running within is listed. In cities with at-large elections, this variable is simply blank. As such, we identify the first election that a city used district-based elections by identifying the first year in the data for a city where the district variable is not blank.
Appendix Table A2 provides city-level summary statistics for cities that never use district-based elections during our sample period (which form our control group,  $n$=322), cities that switch to district-based elections during our period (which form our treatment group, $n$=116), and cities that hold district-based elections during our entire sample period (which we ultimately omit from our analysis, $n$=32).Footnote 6 A key takeaway is that cities that form our treatment group are quite similar to cities that form our control group on most dimensions other than population. The cities that adopt district-based elections are larger. The fact that those cities are larger is not surprising; as Hankinson and Magazinnik (Reference Hankinson and Magazinnik2023) note, organizers actively targeted their efforts towards higher population cities. The cities that already used district-based elections prior to 2008 are different on a number of dimensions than the other two categories of cities; they are much larger (even dropping Los Angeles and San Diego) and have higher racial/ethnic diversity. Appendix Figures A10, A11, and A12 graphically depict averages of key outcome variables (measured at city-by-year level) across years and for each of the three categories of cities noted above (switching cities, never districted, always districted).
5. Empirical approach: difference-in-differences
We employ a difference-in-difference analysis of how district-based elections impact who runs and who is ultimately elected to the council. These specifications will address how and whether the potential or “expected” shifts in representation captured in the previous section in fact translate into shifts in who is elected to the council. Our main specifications are estimated at the city-by-election year level, where we take as outcomes the share of candidates or share of winning candidates with some characteristic (e.g., percent white) in that city-by-election year.Footnote 7 We estimate:
 \begin{equation}
\text{(Winning) Candidate Char. Share}_{ct}= \beta \times \text{Post-Districting}_{ct} + \delta_t + \gamma_c + \epsilon_{ct}
\end{equation}
\begin{equation}
\text{(Winning) Candidate Char. Share}_{ct}= \beta \times \text{Post-Districting}_{ct} + \delta_t + \gamma_c + \epsilon_{ct}
\end{equation} Post-Districting is a binary variable equal to one in cities ( $c$) and years ( $t$) that are using district-based elections and zero for cities that have not yet switched to district-based elections or never do during our sample period. We exclude cities that were district-based for the entire sample period,Footnote 8 but include all other California cities. Thus, cities that switch to district-based between 2008 and 2020 serve as the “treatment” group and cities that use at-large elections the entire time serve as the “control” group. We include city and year fixed effects to difference out time-invariant city characteristics and across-city year effects.
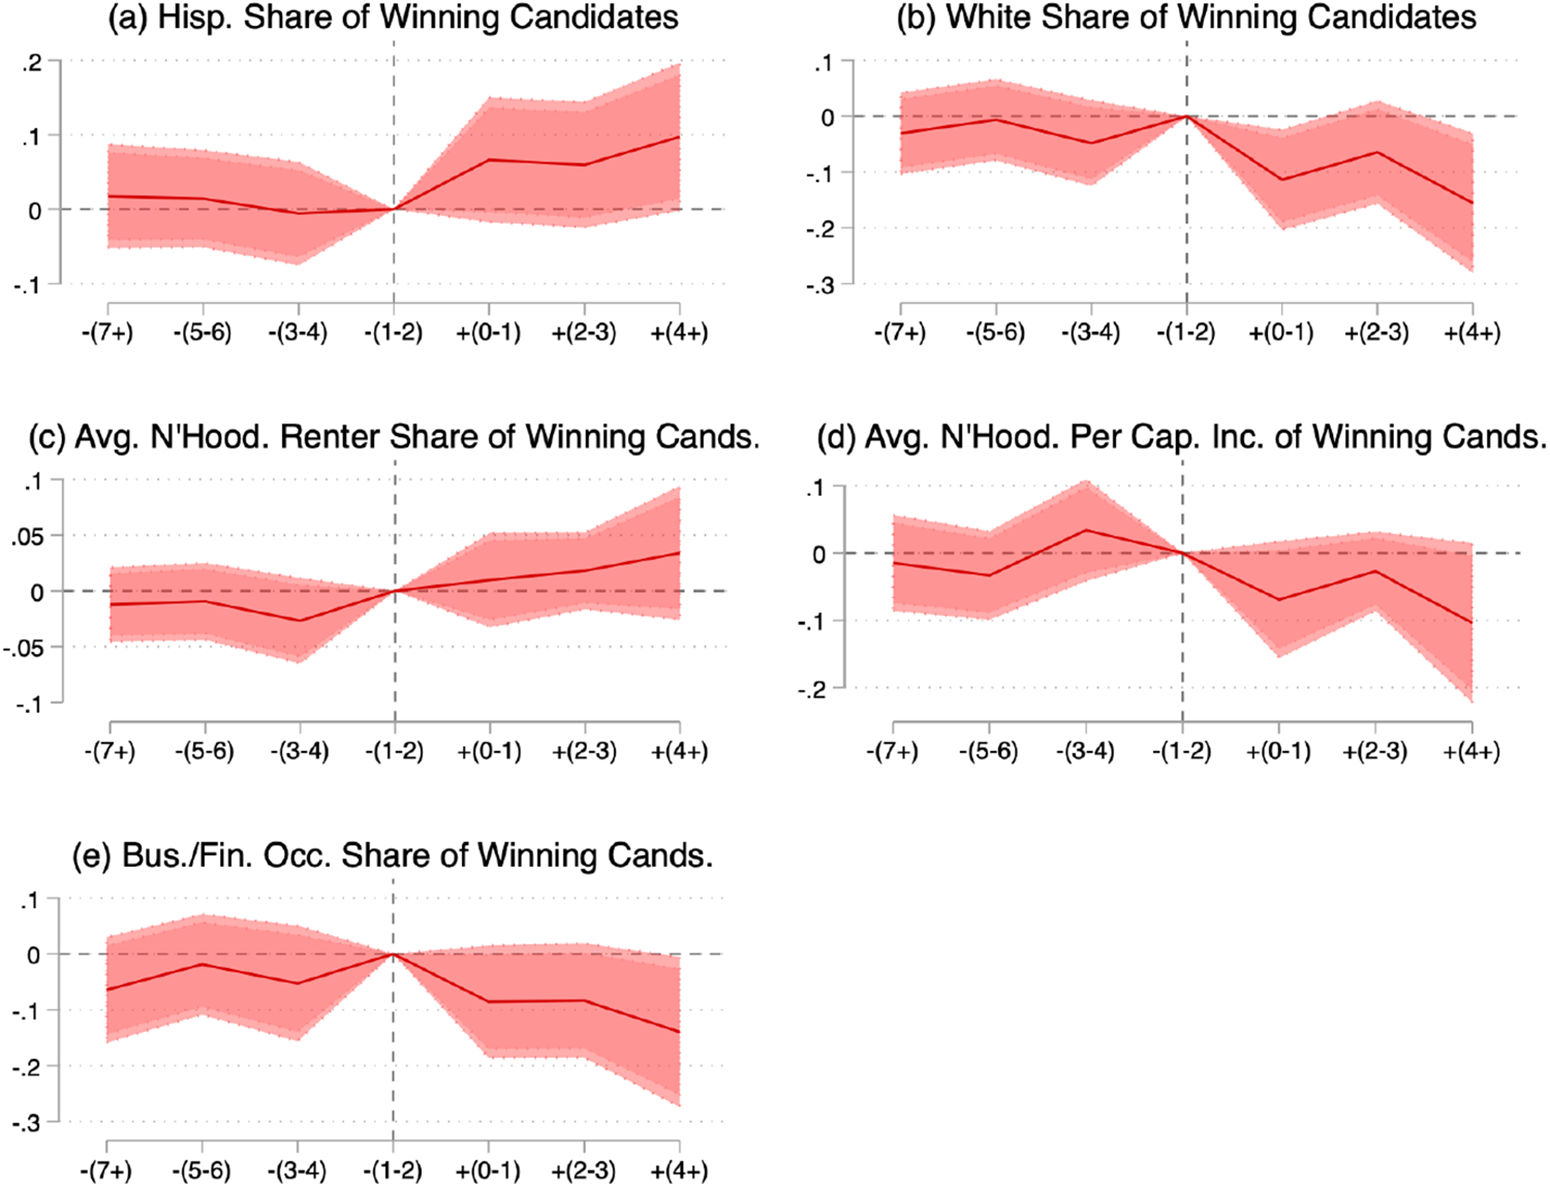
  $\beta$ identifies the causal impact of switching to district-based elections. A critical assumption inherent in difference-in-difference analysis is that treated and control units would follow parallel paths in the absence of treatment. To provide some evidence on this, we also conduct event studies to ensure that there are no differences in trends in the years leading up to treatment (Figure 4).
6. Results
6.1. Main difference-in-difference results
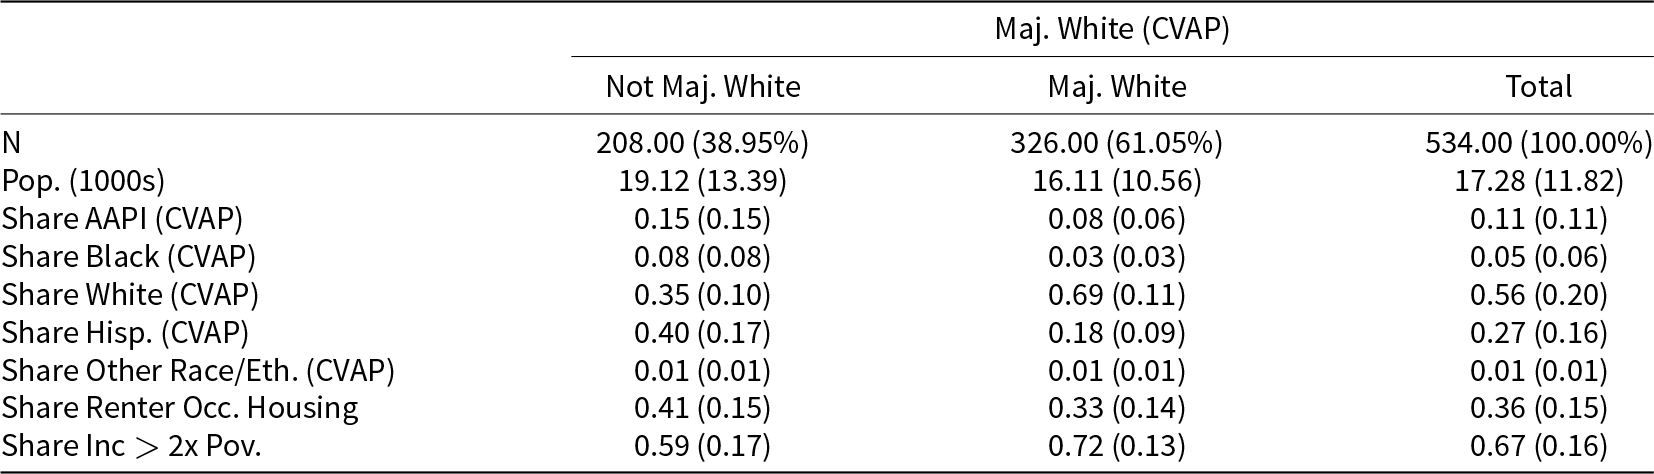
Figure 2 presents results from the difference-in-difference analysis on candidate characteristics aggregated to the city-by-year level. (Our next figure will provide evidence on the types of neighborhoods candidates and winners come from.) Each point (with confidence intervals) in the figure is from a separate regression, matching Eqn. 1 above, but taking on a variety of outcome variables. The figure plots both the shares of all candidates (red dots) and the shares of winning candidates (blue dots) in a given city-year who are of a particular characteristic, listed along the left-hand side of the figure.
Difference-in-difference analysis: how individual characteristics of candidates and winners change under district-based elections.

Even though race and ethnicity is not the central focus of this paper, we describe results on that front first, both to highlight that we observe similar results to prior literature and to orient readers to our figure. Consider the row labeled “Race/Eth: White.” The pair of dots there reports the impacts of district-based elections on the share of candidates (red dot) and winners (blue dot) who are, to use Census-style racial-ethnic categories, non-Hispanic white. We find that there is a significant decrease both in the share of candidates and the share of winners who are white. As in other work on the CVRA, district-based elections generate increases in Hispanic representation; in our paper, we are able to document that a large part of why this happens (as depicted in the figure) is an increase in Hispanic candidate entry, as the impact of districts on the share of candidates and winners is relatively similar.
Next, we turn to evidence in the figure on other dimensions of representation: especially class. The bottom pair of points in the figure reports the impacts of district-based elections on the professional background of candidates and winners. While we cannot observe candidates’ individual-level incomes or socioeconomic status, we do observe their occupation as self-reported on the ballot. We find that the share of both winners and candidates who are in a business/finance-related occupation decreases, providing evidence that district-based elections shift councils away from overrepresentation of individuals from white-collar occupations.Footnote 9
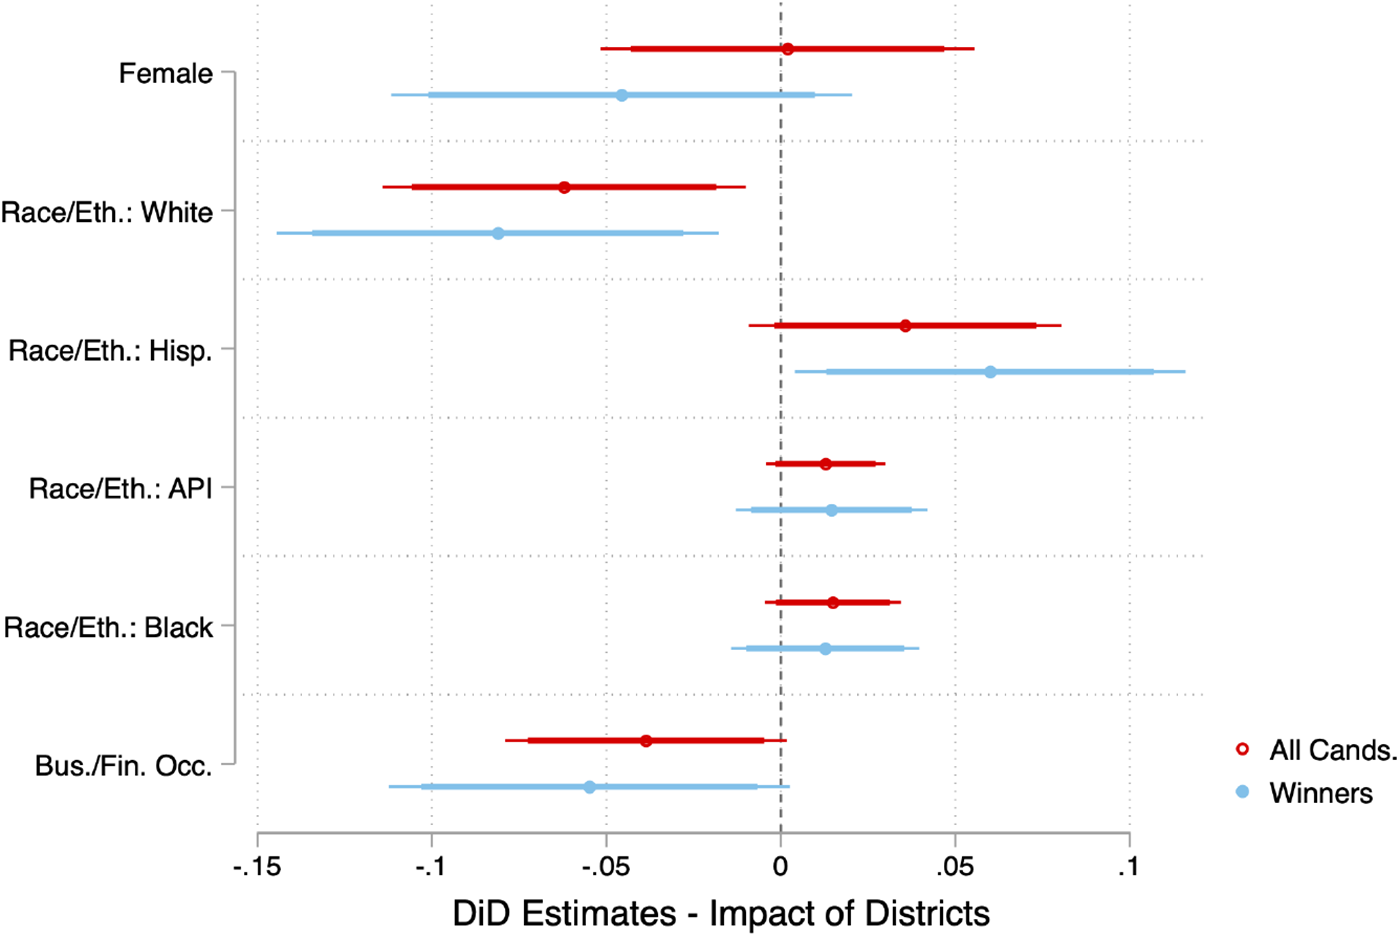
We further explore how district-based elections impact class and socioeconomic status-based representation in our analysis on the types of neighborhoods that candidates come from, which we turn to next. Figure 3 presents results on that set of outcomes. Specifically, we take as outcomes the characteristics of the Census block group that candidates and winners come from. Again, to start with results that link us to much of the existing literature and orient readers to the figure, the first two pairs of estimates report results on the racial/ethnic composition of Census block-group candidates live in. The results reveal that the average winner comes from a neighborhood that is roughly 4 percentage points less (non-Hisp.) white and 4 percentage points more Hispanic. Results are similar, but more muted on neighborhood characteristics for all candidates. The estimation sample standard deviation of the winning candidates’ neighborhood Hispanic population share is 0.24, so the magnitude of our effect is roughly one-sixth of a standard deviation.
Difference-in-difference analysis: how neighborhood characteristics of candidates and winners change under district-based elections.

The remainder of the figure contains results that we view as our primary contribution. The pair of results in the row label “% Renter” captures the renter share of candidates’ and winners’ Census block groups. While we cannot observe whether candidates/winners are themselves renters or homeowners, we do find that district-based elections are associated with increases in candidates/winners from higher renter-share neighborhoods; with the average candidate and winner coming from a neighborhood that is 3 percentage points higher in renter share under district-based vs. at-large elections. The estimation sample standard deviation of winning candidates’ neighborhood renter share is 0.17, so the magnitude of our effect is roughly 0.18 of a standard deviation of the outcome.
The next two pairs of results report impacts on the types of neighborhoods candidates and winners are coming from with respect to income composition. The first pair of points takes as an outcome the average (logged) per capita income of candidates/winners neighborhoods. The second pair of points takes as an outcome the share of block-group residents who are SNAP recipients; because SNAP eligibility is income-based, we draw on this outcome largely as another measure of income distribution of neighborhoods, with this measure capturing the lower end of the distribution.
The high-level result on both outcomes is that we observe a shift towards candidates and winners from lower-income neighborhoods. For instance, the average winning candidate comes from a block group with income that is roughly 6% lower. But here, we observe more sizable differences between the estimates for candidates and winners than many of our other outcomes—with more pronounced impacts for winners. This indicates that while district-based elections have some impact on the entry of candidates from lower-income neighborhoods, a large part of the increased presence of these candidates on the council is from the increased likelihood of winning conditional on running. This is consistent with our predictions, which highlighted that district-based elections may decrease the cost of participating in a contest and therefore increase the likelihood of winning for individuals from a broader range of the income and wealth distribution.
6.2. Robustness of main results
As noted in the description of our methods, we conduct event study analyses to assess the parallel trends assumption that is critical to a difference-in-difference analysis. Event studies from some of our key outcome variables are depicted in Figure 4. The figures plot differences between treatment and control groups at different points in time relative to the years immediately before the implementation of district-based elections. If there were confounding time-varying factors that relate both to our outcome but also to the adoption of district-based elections, this may materialize as trends in our outcomes in the years immediately prior to adoption. Instead, in all figures, there is no difference between treatment and control in the years prior to treatment—indicating parallel trends in the pre-periods.
Event study: district-based elections and share of Hispanic winning candidates.

Additional robustness tests are presented and discussed in the online appendix.
6.3. Drivers of main results
Next, we provide some additional evidence aimed at better understanding the mechanisms driving our main results. Before doing so, it is worth taking stock of our current results and the mechanisms that may be driving them. We have found that district-based elections are causally associated with an increase in shares of: Latino candidates and winners, candidates and winners from higher renter-share neighborhoods, and candidates and winners from lower income neighborhoods. District-based elections, likewise, are causally associated with decreases in shares of: white candidates and winners and candidates and winners from a business/finance-related occupation. Of course, the race/ethnicity results summarized here are largely in line with existing literature; the changes in class-based composition of candidates and winners are our primary focus. The fact that we observe changes in both the composition of candidates and winners already provides some evidence on the mechanism driving our results: results are at least partially driven by candidate entry and not strictly a change in candidate success conditional on entering. We do note, however, that in most of our main results, the effect of district-based elections is at least marginally larger when focusing on the composition of winners relative to the composition of candidates. If candidate entry was the sole driver of changes in council composition, the change in the composition of winners would roughly equal the change in the composition of candidates. Our finding on this front parallels Abott and Magazinnik (Reference Abott and Magazinnik2020), who find that district-based elections increased both the Latino share of school board candidates and school board members in California following the local adoption of district-based school board elections.
Next, in the context of race/ethnic representation, many have argued that we should expect the strongest impacts of district-based elections on the composition of the elected body in relatively racially/ethnically segregated localities; Abott and Magazinnik (Reference Abott and Magazinnik2020) and Trounstine and Valdini (Reference Trounstine and Valdini2008) provide empirical evidence in support of this claim. We ask whether the same is true of the class-based representation that we document: are changes in class-based representation on council contingent on the degree of economic segregation in cities?
Addressing that question in our setting can help further clarify potential mechanisms at play. One mechanism that might drive our results is that district-based elections reduce the cost of campaigning or impact organizing efforts. If those campaign-focused channels were the primary mechanisms driving our results, results should not differ across more and less economically segregated cities. On the other hand, under the assumption that members of an underrepresented group are more likely to vote for own-group members, absent changes in campaigning or organizing, district-based elections should only be expected to change the composition of the elected body in a city where the group members in question are spatially concentrated (Trounstine and Valdini, Reference Trounstine and Valdini2008). Of course, the most relevant mechanisms impacting class-based representation may differ from those impacting racial/ethnic representation.
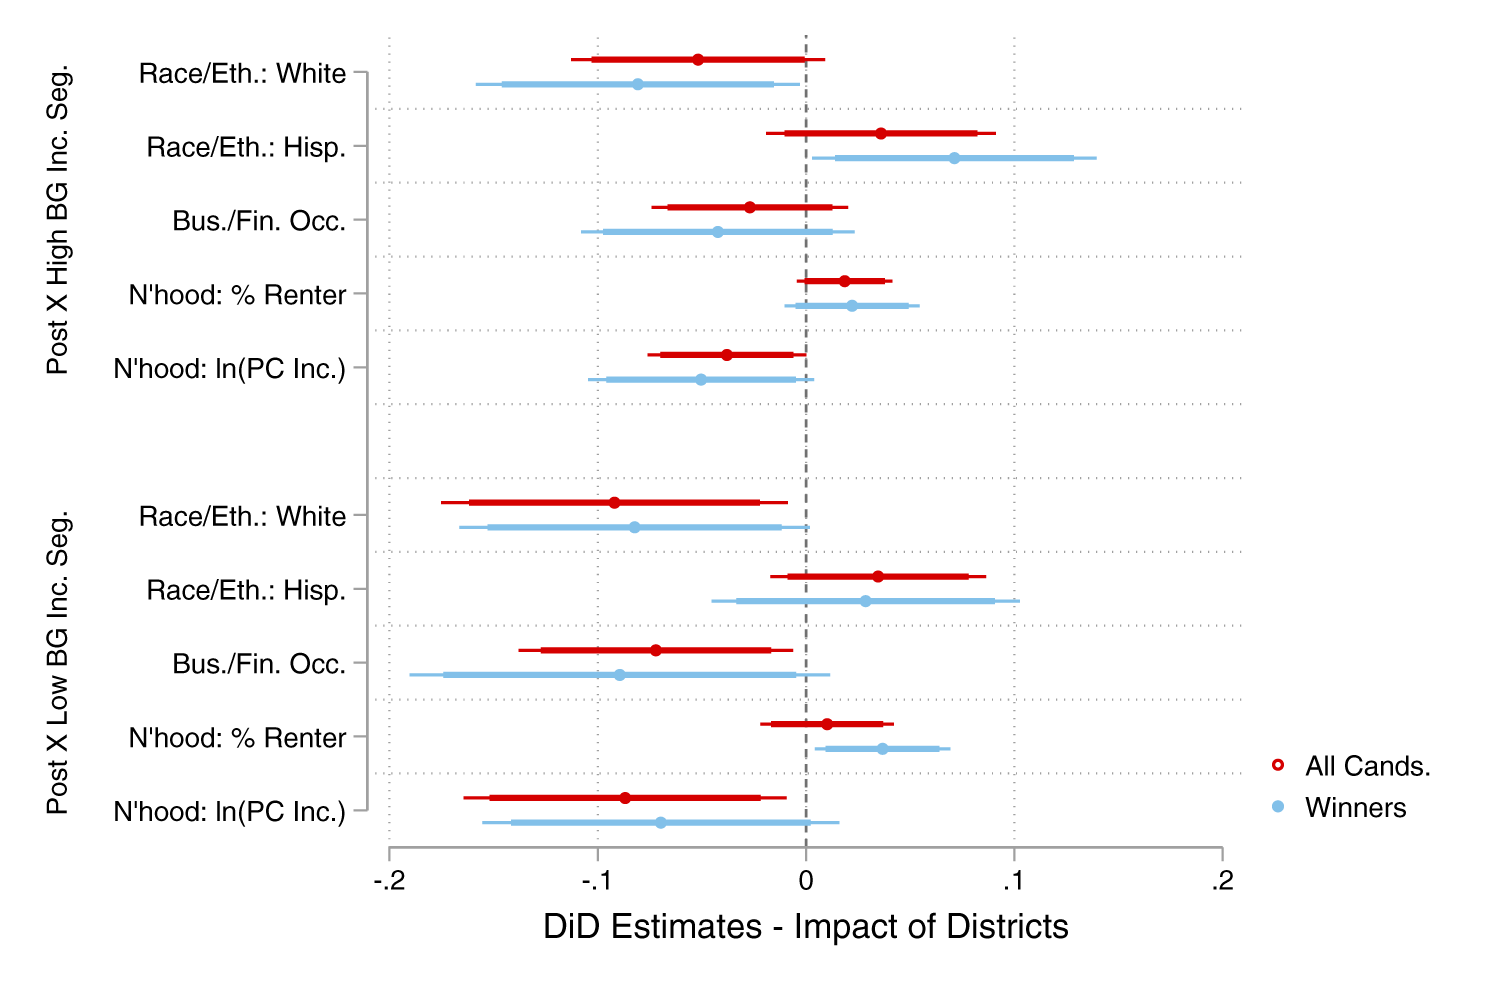
To test the role of economic segregation in our setting, we first construct a measure of how residentially segregated higher-income individuals are. We construct a block-group measure of the share of residents within a block group whose incomes exceed two-times the poverty line; we use that share as our measure of higher-income individuals. The remainder in each block group is the share of lower-income individuals. We then use these data to construct a high-income/low-income dissimilarity index at the city level, an index of segregation frequently used to measure local racial/ethnic segregation. The index runs from 0 to 1, with zero indicating the maximum degree of integration and 1 indicating the maximum degree of segregation of higher and lower income individuals. We split our sample of cities at the median value to define more and less income-segregated cities. We then re-run our main specification with distinct “treatment” variables for our more and less income-segregated cities.
Results are presented graphically in Figure 5. That top panel reports difference-in-difference coefficients for more income segregated cities; the bottom panel reports coefficients for less income segregated cities. As before, each row or pair of coefficients corresponds to a particular outcome. The directional pattern of our results is similar across the top and bottom panels. In fact, for any outcome in the figure, we are not able to reject the hypothesis that the effect of district-based elections is the same in more relative to less income segregated cities. These results do not occur just in newly districted cities with high levels of segregation, which points to the reforms as a driving force. The smaller scale of economy within districts raises the potential for a more diverse slate of candidates for seats in underrepresented neighborhoods, including non-business occupations.
Difference-in-difference analysis: distinct effects of district-based elections in more and less income segregated cities.

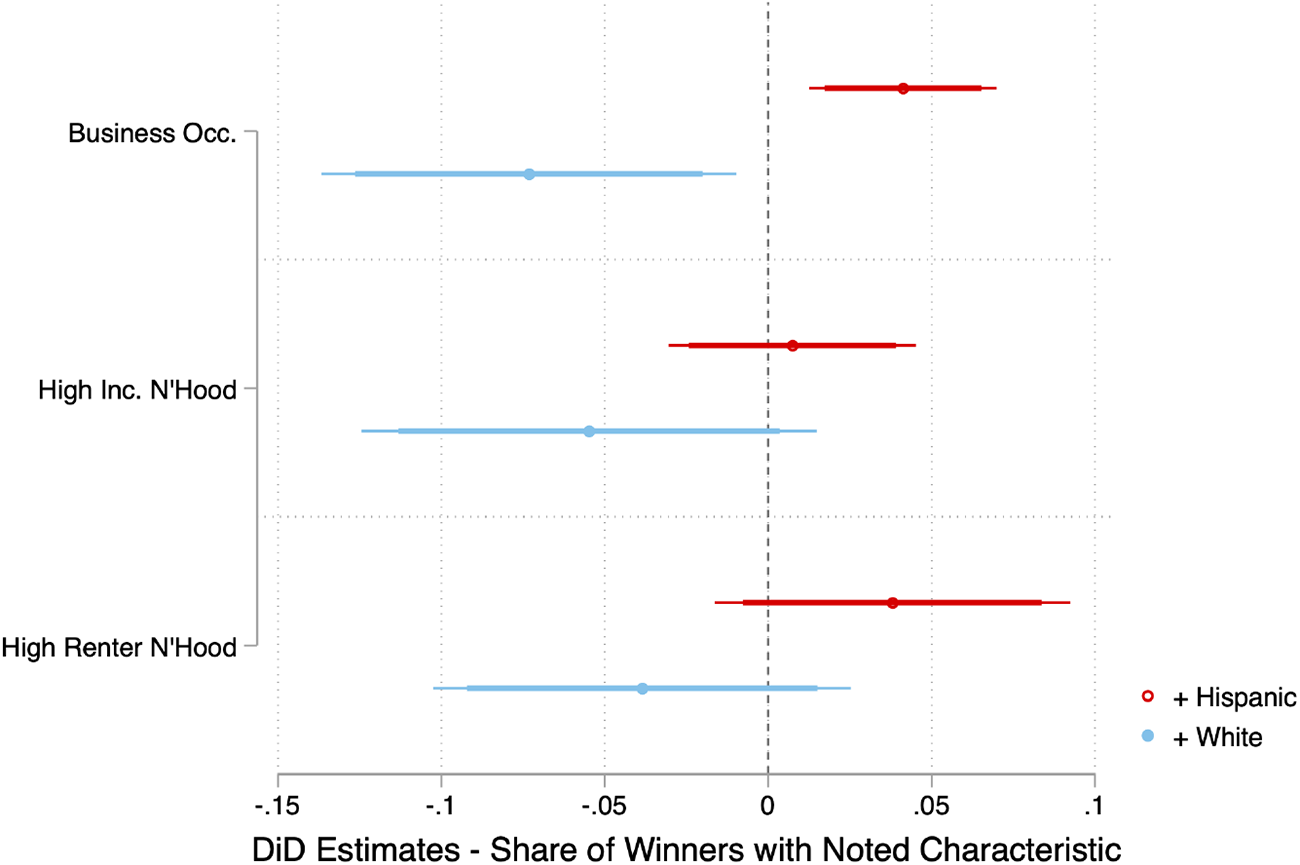
Next, in part because some of the factors assessed in our main analyses are correlated with one another, we test how district-based elections impact the composition of the council with regards to intersections between race/ethnic groupings (in particular, non-Hispanic white and Hispanic) and the other characteristics assessed. To do so, we run the same difference-in-difference specification used elsewhere in this section, but take as outcomes intersectional groups—e.g., share of winning candidates who reside in a Higher Income Neighborhood. Results are depicted in Figure 6 and uncover heterogeneity in the impacts of district-based elections that were concealed by the prior analyses. For example, the “Business Occ.” row reports the effect of treatment on the share of candidates who hold Business Occupations and are Hispanic or White (respectively). In this exercise, “High Income Neighborhood” and “Higher Renter Neighborhood” are defined as those block groups that fall above the sample median in those measures.
Difference-in-difference analysis: winning candidate characteristics interacted with race/eth.

Most notably, we find that two of our main outcomes documenting shifts in class-based representation (share of candidates from “business” occupations and incomes of neighborhoods candidates come from) seem to be driven by white candidates in particular. We find that district-based elections impact racial/ethnic representation and separately impact class-based representation, a departure from the expectation that district-based elections may impact the race or ethnicity of candidates and winners, which would impact other intersecting characteristics.
7. Conclusion
This paper has assessed the impacts of shifting from at-large to district-based elections for all 118 city councils in California that did so between 2008 and 2020. In doing so, it has been our aim to shed light on the broad impacts of district-based elections in local elections, both in who runs and wins elections, and how districts are drawn. While a sizable body of work has studied the impacts of district-based elections on descriptive racial and ethnic representation (Davidson, Reference Davidson1994; Abott and Magazinnik, Reference Abott and Magazinnik2020), there is less known in the modern context and on a wide scale about the two main focuses of this paper: the characteristics of candidates and elected councilmembers, and the far-reaching impacts of how the districts themselves are drawn. We aim to address these questions, focusing in particular on class-based representation. The rapid shift from at-large to district-based elections among city councils in California in the 2010s and our statewide district mapping efforts facilitate our contributions on these fronts.
To briefly summarize our findings: we find increases in the representation of individuals from lower-income neighborhoods and neighborhoods with a higher share of renters. We also find a decrease in winners with “business”-related occupations. These findings are important in light of the dramatic underrepresentation of working-class individuals and renters in local government (Schaffner et al., Reference Schaffner, Rhodes and Raja2020; Einstein et al., Reference Einstein, Ornstein and Palmer2022) and also in light of some recent papers that document a shift in housing policy under district-based elections (Mast, Reference Mast2024; Hankinson and Magazinnik, Reference Hankinson and Magazinnik2023). Beyond the shift in incentives faced by councilmembers elected from districts, our results highlight that changes in housing policy (and likely other policy) may also be a consequence of who serves on the council under district-based elections, in line with evidence that working-class representation in Congress impacts substantive representation (Carnes, Reference Carnes2012).
Our results also contribute to enduring questions: which groups get represented, and by whom? The myriad implications of these two essential roles in democratic representation have animated decades of research. District reforms in city councils have the potential to increase substantive representation for minorities long excluded, namely, people of color and lower classes. While districts are able to remedy underrepresentation for these groups, they are most beneficial for geographically concentrated populations, a direct result of racial and economic segregation. As cities continue to reform electoral institutions to reflect minority communities, we expect district representation to become more ubiquitous, and municipal policy to more closely reflect the preferences of these minority groups. Future research is needed to address more substantive benefits of district reform in the policy areas most important to city councils, such as development, parks, police and fire, and utilities.
Supplementary material
The supplementary material for this article can be found at https://doi.org/10.1017/psrm.2025.10070. To obtain replication material for this article, please visit https://doi.org/10.7910/DVN/NXTJMD.


 Open access