


Myopia is a leading cause of visual impairment worldwide, with prevalence increasing dramatically due to societal changes such as reduced time spent outdoors (Holden et al., Reference Holden, Fricke, Wilson, Jong, Naidoo, Sankaridurg, Wong, Naduvilath and Resnikoff2016; Rose et al., Reference Rose, Morgan, Ip, Kifley, Huynh, Smith and Mitchell2008; Wang et al., Reference Wang, Li, Musch, Wei, Qi, Ding, Li, Li, Song, Zhang, Ning, Zeng, Hua, Li and Qian2021). Despite these environmental influences, within populations, myopia and its underlying quantitative trait, spherical equivalent refractive error (SER), are both highly heritable (Voogelaar et al., Reference Voogelaar, Tedja, Guggenheim, Saw, Tjon-Fo-Sang, Mackey, Hammond, Klaver and Verhoeven2025). While optical correction can restore visual acuity, myopia confers markedly elevated risks of severe complications, including retinal detachment (Ludwig et al., Reference Ludwig, Vail, Al-Moujahed, Callaway, Saroj, Moshfeghi and Moshfeghi2023).
Large-scale genomewide association studies (GWAS) have identified numerous genetic loci associated with refractive error and myopia, enabling the development of polygenic risk scores (PRSs) that quantify inherited susceptibility (Hysi et al., Reference Hysi, Choquet, Khawaja, Wojciechowski, Tedja, Yin, Simcoe, Patasova, Mahroo, Thai, Cumberland, Melles, Verhoeven, Vitart, Segre, Stone, Wareham, Hewitt, Mackey and Hammond2020). Current PRS models explain up to 19% of the variance in refractive error in European populations, but performance drops substantially in non‑European groups, with estimates of 8% in South Asians, 6% in East Asians, and 3% in individuals of African ancestry (Clark et al., Reference Clark, Lee, Du, Wang, Kneepkens, Charng, Huang, Hunter, Jiang, Tideman, Melles, Klaver, Mackey, Williams, Choquet, Ohno-Matsui and Guggenheim2023). Recent work has shown that multitrait analytical approaches, which integrate genetically correlated phenotypes, can further enhance predictive accuracy by leveraging shared biological pathways (Clark et al., Reference Clark, Lee, Du, Wang, Kneepkens, Charng, Huang, Hunter, Jiang, Tideman, Melles, Klaver, Mackey, Williams, Choquet, Ohno-Matsui and Guggenheim2023; Turley et al., Reference Turley, Walters, Maghzian, Okbay, Lee, Fontana, Nguyen-Viet, Wedow, Zacher, Furlotte, Magnusson, Oskarsson, Johannesson, Visscher, Laibson, Cesarini, Neale and Benjamin2018). However, these models have thus far been constructed primarily from European cohorts, limiting their transferability and clinical relevance in diverse populations. As genomic resources increasingly incorporate multi‑ancestry data, there is now an opportunity to improve PRS performance by integrating non‑European GWAS results into PRS construction.
During childhood, the eye undergoes rapid growth and is particularly susceptible to environmental and genetic influences, and thus is a critical period for myopia development and progression (Grzybowski et al., Reference Grzybowski, Kanclerz, Tsubota, Lanca and Saw2020; Zadnik et al., Reference Zadnik, Sinnott, Cotter, Jones-Jordan, Kleinstein, Manny, Twelker and Mutti2015). Throughout childhood, axial length increases, with longer axial length strongly associated with myopia (negative SER values). Axial length provides a direct measure of eye growth and is a key biomarker for monitoring the early stages of myopia (Grosvenor & Scott, Reference Grosvenor and Scott1994; Jiang et al., Reference Jiang, Wang, Yin, He and Li2023; Tideman et al., Reference Tideman, Polling, Vingerling, Jaddoe, Williams, Guggenheim and Klaver2018). Accurately predicting axial length in childhood could therefore enable earlier recognition of children at greater risk, supporting proactive myopia‑control strategies before substantial refractive error develops. Early risk stratification may allow timely implementation of preventive interventions, such as low‑concentration atropine, which has been shown in randomized trials to reduce the onset of myopia in children (Yam et al., Reference Yam, Zhang, Zhang, Yip, Tang, Wong, Bui, Kam, Ng, Ko, Yip, Young, Tham, Chen and Pang2023).
In this study, we developed and evaluated multitrait, multi-ancestry PRSs for refractive error and myopia. Our PRSs explained approximately 20% of the variance in refractive error in Europeans, 18% in admixed Europeans, 14% in South Asians, 13% in East Asians, and 9% in African groups. Notably, the model demonstrated strong clinical predictive power for high myopia among admixed European participants and for moderate myopia among Europeans (Maher, Reference Maher2015). The PRSs also predicted axial length across a range of age groups.
Methods
Construction of PRS Overview
Our study design for GWAS, PRS construction, and evaluation is described in Figure 1. We first collated GWAS summary statistics for SER, myopia, and correlated traits. For each ancestry, we conducted a multitrait analysis and used the results to build ancestry-specific PRSs and a multi-ancestry PRS (meta-PRS). Finally, the PRSs were tested in nonoverlapping individuals from a range of ancestries.
Study overview. Multitrait GWAS summary statistics were generated for each ancestry and used to build ancestry-specific polygenic risk scores (PRSs) and a multi-ancestry PRS (meta-PRS). The meta-PRS was trained on 50% of the validation datasets (EUR Australian Twins; non-EUR UK Biobank) and tested on the remaining 50%. The EUR PRS were additionally evaluated on full datasets, including cross-ancestry performance and axial length in children.

Multitrait GWAS Analysis
For European ancestry samples, we collated GWAS summary statistics for SER, as well as for two traits representing dichotomizations of SER: myopia and hyperopia. We also collated GWAS summary statistics for vertical cup‑to‑disc ratio (VCDR), an optic nerve head measure associated with SER. We further considered data on angle-closure glaucoma (ACG); this form of glaucoma is associated with shorter overall axial (eye) length and hence may be associated with SER and myopia.
The GWAS summary statistics for SER were taken from the large European meta-analysis by Hysi et al. (Reference Hysi, Choquet, Khawaja, Wojciechowski, Tedja, Yin, Simcoe, Patasova, Mahroo, Thai, Cumberland, Melles, Verhoeven, Vitart, Segre, Stone, Wareham, Hewitt, Mackey and Hammond2020), which included individuals from the UK Biobank, Genetic Epidemiology Research on Aging (GERA), and the Consortium for Refractive Error and Myopia (CREAM). We assembled case–control data for myopia (5406 cases, 476,776 controls) and hyperopia (2721 cases, 476,776 controls) from FinnGen (release 12; Kurki et al., Reference Kurki, Karjalainen, Palta, Sipilä, Kristiansson, Donner, Reeve, Laivuori, Aavikko, Kaunisto, Loukola, Lahtela, Mattsson, Laiho, Della Briotta Parolo, Lehisto, Kanai, Mars, Rämö and Palotie2023), as well as myopia (65,574 cases, 333,242 controls) and hyperopia (73,817 cases, 320,870 controls) from the Million Veteran Program (MVP; Gaziano et al., Reference Gaziano, Concato, Brophy, Fiore, Pyarajan, Breeling, Whitbourne, Deen, Shannon, Humphries, Guarino, Aslan, Anderson, LaFleur, Hammond, Schaa, Moser, Huang, Muralidhar and O’Leary2016). The VCDR GWAS summary statistics were obtained from a meta-analysis of UK Biobank (Sudlow et al., Reference Sudlow, Gallacher, Allen, Beral, Burton, Danesh, Downey, Elliott, Green, Landray, Liu, Matthews, Ong, Pell, Silman, Young, Sprosen, Peakman and Collins2015) and the Canadian Longitudinal Study on Aging (CLSA; N = 86,544; Raina et al., Reference Raina, Wolfson, Kirkland, Griffith, Oremus, Patterson, Tuokko, Penning, Balion, Hogan, Wister, Payette, Shannon and Brazil2009). The ACG GWAS summary statistics were drawn from MVP (7129 cases, 439,835 controls).
To confirm that the above traits were suitable for joint modeling, we assessed their pairwise genetic correlations using Linkage Disequilibrium Score Regression (LDSC; Bulik-Sullivan et al., Reference Bulik-Sullivan, Loh, Finucane, Ripke, Yang, Patterson, Daly, Price and Neale2015). All traits were correlated with SER; VCDR and ACG showed modest genetic correlations with SER (r g = .31 and .36, respectively), whereas myopia and hyperopia showed stronger correlations (r g = .80–.86). We hence included all of these traits in a multitrait GWAS conducted using MTAG (2020 release version; Turley et al., Reference Turley, Walters, Maghzian, Okbay, Lee, Fontana, Nguyen-Viet, Wedow, Zacher, Furlotte, Magnusson, Oskarsson, Johannesson, Visscher, Laibson, Cesarini, Neale and Benjamin2018), which integrates correlated GWAS traits to improve GWAS power. MTAG adjusts for sample overlap and produces separate GWAS results for each input trait. For downstream analysis, we selected SER as the output trait for MTAG for European (although given the high correlation, results are expected to be similar for myopia vs. SER). For non-Europeans, we selected myopia as the MTAG output trait (SER was not available in non-Europeans), with the estimates multiplied by −1 so that SER and myopia estimates were positively correlated.
For non-European ancestries, multitrait construction was limited by the availability of ancestry-matched datasets. In the African (AFR) and Admixed European groups, we included myopia, hyperopia, and ACG summary statistics from MVP. In East Asian (EAS) populations, only myopia and hyperopia datasets were available from MVP. Using these ancestry-specific inputs, we produced multitrait GWAS summary statistics for each population.
PRS Construction
PRSs were constructed using SNP effect sizes estimated with SBayesRC, a Bayesian method that models linkage disequilibrium (LD) and incorporates functional annotations across up to 7 million genomewide single-nucleotide polymorphisms (SNPs; Zheng et al., Reference Zheng, Liu, Sidorenko, Wang, Lin, Yengo, Turley, Ani, Wang, Nolte, Snieder, Yang, Wray, Goddard, Visscher and Zeng2024). LD reference panels were drawn from UK Biobank European-ancestry samples for the EUR and Admixed MTAG outputs and ancestry-matched panels for the AFR and EAS analyses. PRSs were then computed in PLINK (Purcell et al., Reference Purcell, Neale, Todd-Brown, Thomas, Ferreira, Bender, Maller, Sklar, de Bakker, Daly and Sham2007) using the resulting SNP weights.
In addition to evaluating ancestry-specific PRSs for each major group, we developed a multi-ancestry PRS (meta-PRS). To determine ancestry-specific contributions, 50% of each validation dataset was used for training, with the remaining 50% serving as an independent validation set. For non-European validation, we used UK Biobank participants (Admixed, AFR, EAS, SAS). UK Biobank is a large-scale prospective cohort of approximately 500,000 individuals aged 40–69 years with autorefraction-derived SER (aveMSE, Data-Field 20261; Sudlow et al., Reference Sudlow, Gallacher, Allen, Beral, Burton, Danesh, Downey, Elliott, Green, Landray, Liu, Matthews, Ong, Pell, Silman, Young, Sprosen, Peakman and Collins2015). For European validation, we utilized the Australian Twins Eye Study (Mackey et al., Reference Mackey, Mackinnon, Brown, Kearns, Ruddle, Sanfilippo, Sun, Hammond, Young, Martin and Hewitt2009; Nilagiri et al., Reference Nilagiri, Lee, Lingham, Charng, Yazar, Hewitt, Griffiths, Sanfilippo, Tsai and Mackey2023), a cross-sectional cohort of 2235 individuals with clinician-measured SER and axial length. We did not use the EUR UK Biobank samples for validation, as these were all included in the discovery GWAS. For the twin dataset, we selected one individual per family to avoid relatedness bias, yielding 339 independent participants aged 18–25 years. This age range was chosen to capture stable SER while avoiding age‑related changes, and individuals aged ≥ 26 years were part of the GWAS discovery dataset (Nilagiri et al., Reference Nilagiri, Lee, Lingham, Charng, Yazar, Hewitt, Griffiths, Sanfilippo, Tsai and Mackey2023). Within each ancestry, linear regression models were fitted to estimate ancestry-specific PRS coefficients, which were then combined to generate the final meta-PRSs.
For comparison, we also evaluated alternative PRS models. First, we constructed a PRS using the 449 genomewide significant SNPs reported from Hysi et al. (Reference Hysi, Choquet, Khawaja, Wojciechowski, Tedja, Yin, Simcoe, Patasova, Mahroo, Thai, Cumberland, Melles, Verhoeven, Vitart, Segre, Stone, Wareham, Hewitt, Mackey and Hammond2020), with the total study sample size (N = 542,934) used to convert z scores to beta coefficients (per‑SNP sample sizes were not provided). In addition, we assessed the published PRS from Clark et al. (Reference Clark, Lee, Du, Wang, Kneepkens, Charng, Huang, Hunter, Jiang, Tideman, Melles, Klaver, Mackey, Williams, Choquet, Ohno-Matsui and Guggenheim2023), enabling direct comparison with previous work and providing an external benchmark for predictive performance.
Each PRS was subsequently adjusted for population structure using the first five ancestry principal components (PCs). PCs were derived from the 1000 Genomes Project Phase 3, which includes approximately 2500 individuals spanning AFR, Admixed, EAS, EUR, and SAS ancestries. Individuals requiring ancestry-adjusted PRS values were projected into this genetic ancestry space. The PRS values were then normalized for both mean and variance, producing standardized scores with a mean of zero and a variance of 1 within each genetic ancestry group.
Evaluation of PRS Performance in Predicting SER
PRS performance for predicting SER was evaluated within each ancestry group. First, meta‑PRS were validated in a 50% hold‑out subset of the data to ensure independent assessment and to quantify the benefit of incorporating multi‑ancestry information. The EUR PRS was then tested in the full dataset to assess the generalizability of a European‑trained PRS across both European and non‑European populations. SER was modeled as the dependent variable, and the standardized PRS as the independent variable, adjusting for age, sex, and the first 10 PCs to account for population stratification. The proportion of variance explained by the PRS was calculated as the incremental R 2 between the full model (with covariates and PRS) and the covariates-only model. The PRS was defined so that lower scores indicate more negative refractive error (greater myopia susceptibility); therefore, individuals in the bottom PRS distribution represent those at the highest genetic risk, and estimated effect sizes (β) and odds ratios (OR) reflect increased myopia risk with decreasing PRS values.
PRS Performance for Predicting Myopia
To assess PRS performance in predicting moderate and high myopia, SER was categorized according to clinical thresholds of −3.00 D and −6.00 D. For moderate myopia analyses, cases were defined as SER ≤ −3.00 D and controls as SER > −3.00 D; for high myopia, cases were defined as SER ≤ −6.00 D, with SER > −3.00 D as controls. Predictive performance was quantified as the area under the receiver operating characteristic curve (AUC), with 95% confidence intervals, calculated using the pROC R package (Robin et al., Reference Robin, Turck, Hainard, Tiberti, Lisacek, Sanchez and Müller2011). The full model was compared to the covariates-only model. The increase in AUC from the reduced to the full model indicates the added predictive value of the PRS.
For the absolute risk analysis, observed risk was estimated across PRS deciles using empirical outcome frequencies within each ancestry group, enabling evaluation of PRS performance in non-European populations. In the European validation cohort, where sample size was limited, absolute risk was instead derived from predicted probabilities obtained from a logistic regression model including PRS as a predictor. To maximize sample size, related individuals from the Australian Twins cohort were retained. Additionally, participants aged 23–24 years were selected to approximate stabilized SER. The final analytical sample comprised 203 individuals.
Validation of PRS for Predicting Axial Length
PRS performance for axial length prediction was evaluated in the Australian Twins Eye Study as an independent test set. To assess performance in younger individuals, we restricted the analysis to unrelated participants aged 5–24 years (n = 657). Axial length data were not available for non-European cohorts, and therefore, validation in these populations was not possible.
Within each PRS group, we fitted a linear regression model of axial length on age and extracted the estimated slopes. These slopes were used to plot age‑related axial‑length trajectories across genetic‑risk strata. Because axial elongation underlies myopia development, a lower myopia PRS is associated with longer axial length and more negative refractive error.
Results
Multitrait Analysis of GWAS Results
Using MTAG to combine genetically correlated traits, we identified 709 independent genomewide significant (p < 5 × 10⁻⁸) loci in the European analysis, representing a substantial increase compared with the 449 loci reported in the largest previously published European meta‑analysis (Hysi et al., Reference Hysi, Choquet, Khawaja, Wojciechowski, Tedja, Yin, Simcoe, Patasova, Mahroo, Thai, Cumberland, Melles, Verhoeven, Vitart, Segre, Stone, Wareham, Hewitt, Mackey and Hammond2020). In the non-European analyses, MTAG identified 20 loci in African ancestry, 3 loci in Admixed European ancestry, and none in East Asian ancestry.
PRS Predictive Power for SER
First, we assessed the meta‑PRS using a 50% independent test set to ensure a fair comparison with the EUR PRS and previously published scores (Supplementary Table 1). In non‑European validation using UK Biobank participants, our PRS outperformed previously published models (Clark et al., Reference Clark, Lee, Du, Wang, Kneepkens, Charng, Huang, Hunter, Jiang, Tideman, Melles, Klaver, Mackey, Williams, Choquet, Ohno-Matsui and Guggenheim2023; Hysi et al., Reference Hysi, Choquet, Khawaja, Wojciechowski, Tedja, Yin, Simcoe, Patasova, Mahroo, Thai, Cumberland, Melles, Verhoeven, Vitart, Segre, Stone, Wareham, Hewitt, Mackey and Hammond2020) in most ancestry groups, except for the Admixed group, where the Clark et al. (Reference Clark, Lee, Du, Wang, Kneepkens, Charng, Huang, Hunter, Jiang, Tideman, Melles, Klaver, Mackey, Williams, Choquet, Ohno-Matsui and Guggenheim2023) PRS achieved slightly higher accuracy (R 2 = .23 vs. .20). Applying the meta‑PRS, which integrates ancestry‑specific weights, improved prediction in individuals of African ancestry relative to the EUR PRS alone. In the African test set, the meta-PRS performed best, integrating contributions from both the EUR PRS (β = 1.07, SE = 0.13, p = 9.93 × 10⁻¹⁶) and the AFR PRS (β = 0.41, SE = 0.19, p = 3.26 × 10⁻²), explaining 8.6% of trait variance. In contrast, applying the same ancestry-optimized approach in EAS and SAS did not improve prediction. In these groups, the EUR PRS performed better, explaining 10.1% and 12.6% of the variance respectively.
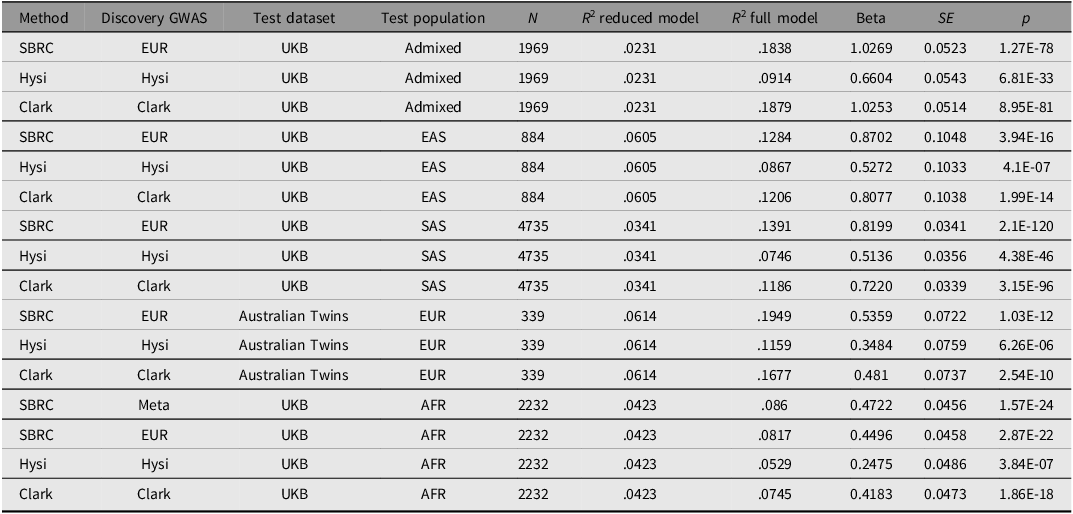
To assess the performance of the EUR PRS independently of the meta-PRS, we re-evaluated it on the full non-European samples without the 50% hold-out split. Our EUR PRS explained 19.5% of the variance in SER in the Australian Twins data (Table 1). By comparison, the PRS from Hysi et al. (Reference Hysi, Choquet, Khawaja, Wojciechowski, Tedja, Yin, Simcoe, Patasova, Mahroo, Thai, Cumberland, Melles, Verhoeven, Vitart, Segre, Stone, Wareham, Hewitt, Mackey and Hammond2020) and the PRS from Clark et al. (Reference Clark, Lee, Du, Wang, Kneepkens, Charng, Huang, Hunter, Jiang, Tideman, Melles, Klaver, Mackey, Williams, Choquet, Ohno-Matsui and Guggenheim2023) explained 11.6% and 16.8% of the variance respectively, indicating improved predictive performance of our model. The variance explained remained comparable across populations (Admixed = 18.4%, SAS = 13.9%, EAS = 12.8%, AFR = 8%), supporting the robustness of the EUR-derived PRS across ancestries.
Performance of the polygenic risk score (PRS) in predicting spherical equivalent refractive error (SER) in an independent European Australian twins cohort and non‑European UK biobank participants

Note: SBRC, Our PRS built using the SBayesRC framework; Hysi, PRS based on the 449 single nucleotide polymorphisms (SNPs) from Hysi et al. (Reference Hysi, Choquet, Khawaja, Wojciechowski, Tedja, Yin, Simcoe, Patasova, Mahroo, Thai, Cumberland, Melles, Verhoeven, Vitart, Segre, Stone, Wareham, Hewitt, Mackey and Hammond2020); Clark, PRS derived from Clark et al. (Reference Clark, Lee, Du, Wang, Kneepkens, Charng, Huang, Hunter, Jiang, Tideman, Melles, Klaver, Mackey, Williams, Choquet, Ohno-Matsui and Guggenheim2023). R 2 (reduced) includes age, sex, and 10 PCs; R 2 (full) additionally includes the standardized PC-adjusted PRS. Beta, SE, and p correspond to the PRS coefficient in the full model. Full dataset evaluation was applied to all ancestries except AFR, for which only the 50% test‑set results are reported because AFR samples were included in meta‑PRS training.
Evaluating Myopia Risk by PRS
We evaluated the performance of the PRS for detecting myopia at clinically relevant thresholds of −3.00 D (moderate myopia) and −6.00 D (high myopia). Using the same 50% test samples as in the SER prediction, we observed a similar pattern when comparing the meta-PRS and the EUR PRS in non-European participants. The meta-PRS outperformed the EUR PRS only in individuals of African ancestry, for both moderate myopia (AUC = 0.67, 95% CI [0.63, 0.71]) and high myopia (AUC = 0.72, 95% CI [0.65, 0.78]). In the other ancestry groups, the EUR PRS showed better predictive performance than the meta-PRS. Notably, the meta-PRS in the African cohort also outperformed both published scores (Clark et al., Reference Clark, Lee, Du, Wang, Kneepkens, Charng, Huang, Hunter, Jiang, Tideman, Melles, Klaver, Mackey, Williams, Choquet, Ohno-Matsui and Guggenheim2023; Hysi et al., Reference Hysi, Choquet, Khawaja, Wojciechowski, Tedja, Yin, Simcoe, Patasova, Mahroo, Thai, Cumberland, Melles, Verhoeven, Vitart, Segre, Stone, Wareham, Hewitt, Mackey and Hammond2020; Supplementary Table 2).
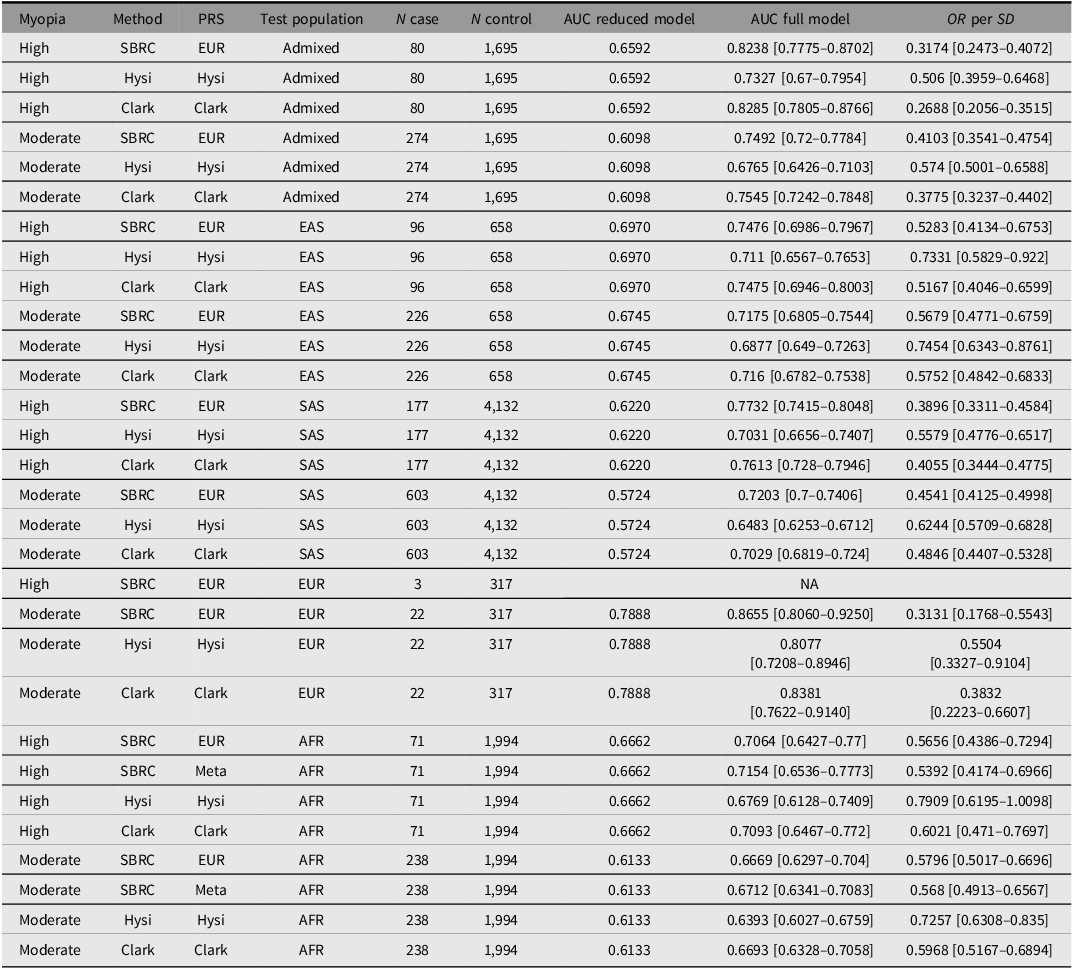
We next evaluated high-myopia prediction using the full validation dataset (Table 2). For high myopia, prediction accuracy exceeded that of the previously published PRS (Clark et al., Reference Clark, Lee, Du, Wang, Kneepkens, Charng, Huang, Hunter, Jiang, Tideman, Melles, Klaver, Mackey, Williams, Choquet, Ohno-Matsui and Guggenheim2023; Hysi et al., Reference Hysi, Choquet, Khawaja, Wojciechowski, Tedja, Yin, Simcoe, Patasova, Mahroo, Thai, Cumberland, Melles, Verhoeven, Vitart, Segre, Stone, Wareham, Hewitt, Mackey and Hammond2020) except in the Admixed group again. The PRS achieved an AUC of 0.82 (95% CI [0.78, 0.87]) in Admixed Europeans, only marginally lower than the value reported by Clark et al. (Reference Clark, Lee, Du, Wang, Kneepkens, Charng, Huang, Hunter, Jiang, Tideman, Melles, Klaver, Mackey, Williams, Choquet, Ohno-Matsui and Guggenheim2023) (AUC = 0.83, 95% CI [0.78, 0.88]). Other ancestry groups also demonstrated good predictive performance, with AUC values above 0.70. We could not reliably assess predictive performance in the EUR test set due to the very small number of high‑myopia cases (n = 3).
Performance of polygenic risk score (PRS) in independent test populations for high and moderate myopia

Note: Beta represents the regression coefficient from the logistic model predicting case–control myopia using the scaled PRS; SE and p correspond to its standard error and p value. AUC (reduced model) denotes the area under the receiver operating characteristic curve for a model that includes only traditional risk factors, while AUC (full model) denotes the AUC after adding the PRS.
Moderate myopia generally showed lower predictive performance than high myopia across ancestry groups, with AUCs of 0.72 (95% CI [0.68, 0.75]) in EAS, 0.72 (95% CI [0.70, 0.74]) in SAS, and 0.75 (95% CI [0.72, 0.78]) in Admixed. Predictive accuracy for moderate myopia in EUR remained strong, with an AUC of 0.87 (95% CI [0.81, 0.93]).
We also observed consistent generalizability across non‑European populations: individuals in the lowest 10% of the PRS distribution had substantially higher risk of both moderate and high myopia, corresponding to more negative refractive error and greater myopia susceptibility (Figure 2). The strongest effects were seen in the Admixed group, where those in the bottom PRS decile had an eight‑fold increased risk of high myopia and a four‑fold increased risk of moderate myopia, the largest observed across ancestries. Overall, the PRS demonstrated strong risk stratification: individuals in lower PRS deciles showed markedly higher absolute risk of myopia, whereas those in higher deciles had substantially reduced risk (Figure 3). Figure 4 further illustrates this relationship using predicted probabilities, showing increasing myopia risk with decreasing PRS on a continuous scale, which may be more practical for clinical risk assessment than decile‑based categorization.
Discriminatory performance of polygenic risk scores (PRSs) across non‑European ancestry participants from the UK Biobank. The area under the curve (AUC) values are reported for high myopia (≤ −6.00 D, orange) and moderate myopia (≤ −3.00 D, blue). Corresponding odds ratios (ORs) comparing individuals in the bottom 10% of the PRS distribution with the remainder of the population are shown with 95% confidence interval.

Absolute risk of myopia across polygenic risk score (PRS) deciles. Absolute risk of moderate and high myopia across PRS deciles in non‑European ancestry groups, estimated using empirical outcome frequencies. Dashed lines indicate the overall population risk.

Predicted probability of myopia across polygenic risk score (PRS) percentiles. Predicted probabilities for moderate and high myopia were estimated using logistic regression models PRS as the predictor. For this analysis only, cases were defined as SER ≤ −3.00 D (moderate myopia) or ≤ −6.00 D (high myopia), with controls defined as SER > −3.00 D or > −6.00 D respectively.

PRS Prediction of Axial Length in a Young Cohort
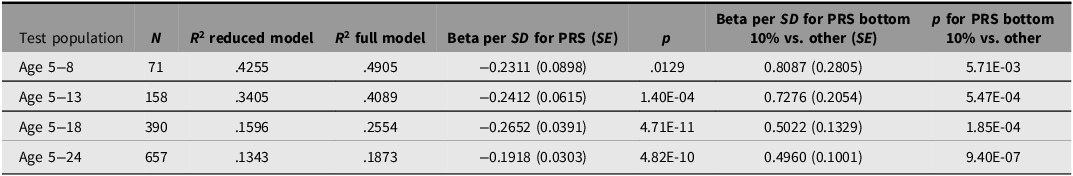
The myopia PRS demonstrated robust cross‑trait predictive power for axial length across ages 5 to 24 years in the Australian Twins cohort (Table 3). In children aged 5–8 years, adding the PRS to the baseline model increased the explained variance from R 2 = .43 to .49, indicating clear improvement beyond traditional risk factors. The association strengthened with broader age inclusion and reached its maximum predictive contribution in the 5- to 18‑year-age group, where the PRS accounted for the largest increase in variance explained (ΔR 2 = .1) and showed the strongest effect on axial length (β = −0.27 mm, p = 4.71 × 10⁻¹¹).
Stratification by PRS quantiles revealed clear and persistent divergence of axial‑length trajectories (Figure 5). Children in the lowest PRS quartile consistently exhibited longer axial lengths compared with their peers across childhood and adolescence. This pattern was especially pronounced at younger ages: among participants aged 5–8 years, individuals in the bottom 10% of the PRS distribution had substantially longer axial lengths than the remaining 90% (β = 0.81 mm, 95% CI [0.25, 1.37]; p = 5.71 × 10⁻³).
Predictive performance of the polygenic risk score (PRS) for axial length in children from the Australian Twins Eyes Study

Note: PRS performance for predicting axial length was evaluated, including ages 5–8, 5–13, 5–18, and 5–24 years. To assess risk stratification, the table also reports the effect estimate comparing individuals in the bottom 10% of the PRS distribution with all other participants in the same age group.
Association between polygenic risk score (PRS) and axial length across childhood. Scatter plots show the relationship between age (years) and mean axial length (mm), stratified by PRS. Participants were grouped into low (bottom 25%), intermediate (middle 50%), and high (top 25%) PRS categories based on the PRS distribution. Solid lines represent the fitted regression slopes for each PRS group.

Discussion
This study advances the genetic prediction of SER as a quantitative trait and of myopia as a clinical outcome, demonstrating strong performance and transferability across diverse ancestries. By applying MTAG to jointly analyze genetically correlated traits, we substantially increased the number of genomewide significant loci available for PRS construction. The resulting European-trained PRS explained approximately 20% of the variance in Europeans, 18% in Admixed Europeans, 14% in South Asians, and 13% in East Asians. In Africans, the multi‑ancestry PRS explained 9% of the variance. For high myopia, the model achieved an AUC of 0.82 in the Admixed group, demonstrating strong discriminatory ability. For European ancestry, we were unable to evaluate high‑myopia prediction due to insufficient case numbers. However, in moderate myopia, where an adequate European sample size was available, the model reached an AUC of 0.87, indicating strong predictive performance for this phenotype. Importantly, the PRS also predicted axial length in younger cohorts, highlighting its utility for early risk stratification in children before the onset of clinically detectable myopia.
We present PRS performance from multiple complementary perspectives. We first evaluated the fully European‑derived PRS, reflecting the largest and most statistically powerful discovery dataset available. We also incorporated available non‑European GWAS data to construct multi‑ancestry models. This strategy demonstrates the value of evaluating PRS to identify the most appropriate approach for each population. Overall, the EUR PRS remained the strongest performer across most ancestries. However, we observed the greatest improvement in the African dataset when applying the meta-PRS. In this population, the incremental R 2 increased from 8.17% with the EUR PRS to 8.60% with the meta-PRS. Although the EUR PRS is trained on the largest overall sample size, the additional gain from reweighting shows that ancestry-informed effect-size adjustments can outperform single-ancestry models, particularly when ancestry-matched data (as available for the African cohort here) are used to refine effect estimates. This result underscores the limitations of cross‑ancestry PRS transferability and highlights the value of ancestry‑appropriate weighting approaches for improving prediction in populations that have historically been underrepresented in genomic research. As ancestry-specific sample sizes grow, multi-ancestry PRS approaches are expected to surpass reliance on European-only models and enable more balanced prediction across global populations.
Refractive error is inherently a quantitative trait, yet dichotomous definitions of myopia remain widely used in clinical practice. For the European cohort, because UK Biobank participants were included in the discovery GWAS, an independent sample was required; thus, we used the Australian Twins study. However, due to its limited number of high‑myopia cases, we were unable to reliably validate high‑myopia outcomes in this cohort. To approximate the expected performance in an independent European high‑myopia cohort, we instead evaluated patterns observed for moderate myopia, for which independent European validation data were available. In this context, the PRS performed best in Europeans (AUC = 0.87), followed by Admixed Europeans (AUC = 0.75), with performance declining in populations with increasing genetic distance from Europeans. This ancestry-related gradient aligns with extensive literature showing reduced PRS portability across populations, largely attributable to differences in linkage disequilibrium structure and allele frequency distributions (Privé et al., Reference Privé, Aschard, Carmi, Folkersen, Hoggart, O’Reilly and Vilhjálmsson2022). The performance observed in the Admixed cohort fits this pattern, as their substantial European genetic ancestry typically yields predictive accuracy between that of Europeans and more genetically distant populations. Notably, the PRS achieved strong discrimination for high myopia in the Admixed (AUC = 0.82). Given this consistent gradient in performance across ancestries, it is reasonable to expect that an independent European high-myopia cohort would demonstrate discrimination at least comparable to that observed in Admixed Europeans.
Across ancestries, we observed consistent improvements in our PRS relative to previously published scores for quantitative refractive error traits. In contrast, these gains were smaller or undetectable in some myopia case-control predictions. This pattern reflects fundamental statistical differences between quantitative and binary outcomes. Quantitative traits preserve the full distribution of phenotypic variability, enabling more precise estimation of genetic effects and therefore greater predictive accuracy. By comparison, dichotomizing a continuous liability into case and control categories discards information and reduces statistical power, thereby attenuating the apparent improvement of enhanced PRS models (Dudbridge, Reference Dudbridge2013; Wray et al., Reference Wray, Yang, Goddard and Visscher2010). Therefore, the quantitative results provide a more stable and interpretable benchmark of PRS performance across populations, and the consistent gains observed for refractive error offer strong evidence that our method delivers genuine predictive improvements.
The utility of our PRS as a predictive tool for axial length is demonstrated in the young cohort. By capturing genetic influences on baseline ocular growth patterns, the PRS strengthens risk stratification during the developmental period when preventive interventions are most effective. The consistent separation of axial length across PRS groups further indicates potential clinical value for early surveillance and for informing the timing of behavioral or optical interventions. A key limitation is that the evaluation dataset is cross-sectional rather than longitudinal. Although axial length differed consistently across PRS groups at each age, the design does not allow estimation of within‑individual growth rates or true developmental trajectories. As a result, the observed age‑related differences reflect population‑level patterns rather than direct measures of axial elongation over time. Nonetheless, the early and sustained separation by PRS strongly supports a role for genetic liability in influencing axial growth from early life.
In conclusion, this study advances the genetic prediction of SER and myopia by developing polygenic risk models that achieve high accuracy and improved transferability across global populations. It highlights the promise of multitrait and multi-ancestry approaches to improve genetic prediction of myopia and to support earlier identification of individuals at elevated risk of future vision impairment, while reinforcing the need for larger and more diverse GWAS resources to ensure equitable clinical utility across all populations.
Supplementary material
To view supplementary material for this article, please visit https://doi.org/10.1017/thg.2026.10067.
Data availability
The UK Biobank data are available to qualified investigators upon request (https://www.ukbiobank.ac.uk/). The Australian twin data are accessible via collaboration with the study investigators.
Acknowledgments
This research has been conducted using data from the UK Biobank (application number 25331). We thank the participants and investigators of UK Biobank, Finngen, and the Million Veteran Program. We gratefully acknowledge All of Us participants for their contributions, without whom this research would not have been possible. We also thank the National Institutes of Health’s All of Us Research Program for making available the participant data examined in this study. Genotyping for part of the Australian twin sample was funded by an NHMRC Medical Genomics Grant. Genotyping for the remainder of twins was performed by the National Institutes of Health (NIH) Center for Inherited Research (CIDR) as part of an NIH/National Eye Institute (NEI) grant 1RO1EY018246, and we are grateful to Dr Camilla Day and staff. We thank Sullivan Nicolaides and Queensland Medical Laboratory for pro bono collection and delivery of blood samples and other pathology services for assistance with blood collection. The QIMR twin studies were supported by grants from the National Health and Medical Research Council (NHMRC) of Australia (241944, 339462, 389927,389875, 389891, 389892, 389938, 443036, 442915, 442981, 496610, 496739, 552485, 552498), the Cooperative Research Centre for Discovery of Genes for Common Human Diseases (CRC), Cerylid Biosciences (Melbourne), and donations from Neville and Shirley Hawkins. We thank Grant Montgomery, Margaret J. Wright, Megan J. Campbell, Anthony Caracella, Scott Gordon, Dale R Nyholt, Anjali K Henders, B. Haddon, D. Smyth, H. Beeby, O. Zheng, B. Chapman for their input into project management, databases, sample processing, and genotyping. We are grateful to the many research assistants and interviewers for assistance with the studies contributing to the QIMR twin collection.
Financial support
SM, AWH and PG acknowledge Investigator grant funding from the Australian National Health and Medical Research Council (NHMRC).
Competing interests
SM and AWH are co-founders of and hold stock in Seonix Pty Ltd. DAM consults for Editas, Norvatis, Ionis.


 Open access