


1. Introduction
Product variety has become a central challenge for companies seeking to satisfy diverse customer needs and maintain competitive positions in global markets. The variety inherently generates complexity that manifests across multiple domains of the system architecture (Reference Mertens, Rennpferdt, Greve, Krause and MeyerMertens et al., 2023): in the product architecture itself, where abstract functions are mapped to the physical components that realise them (Reference UlrichUlrich, 1995), in the processes required to manufacture the product variants, and in the organization, which must coordinate the necessary resources. When unmanaged, this complexity typically leads to inefficiencies and increased costs, whereas excessive reduction may cause firms to miss market opportunities - making the management a widely recognized and crucial challenge in engineering and operations management (e.g., Reference Hackl, Krause, Otto, Windheim, Moon, Bursac and LachmayerHackl et al., 2020; Reference LabroLabro, 2004; Reference Trattner, Hvam, Forza and Herbert-HansenTrattner et al., 2019). The principle of ‘measure it to manage it’ applies directly: valid and reliable measures are essential to assess the impact of design decisions on operational performance. Prior research has therefore proposed a wide range of metrics to quantify complexity. However, despite this richness, the multitude of available measures complicates the situation, as their individual merits are unclear and generalization is often limited to case studies (Reference Blecker and AbdelkafiBlecker & Abdelkafi, 2006; Reference Hennig, Topcu and SzajnfarberHennig et al., 2022; Reference Sinha and SuhSinha & Suh, 2018). In addition, engineering literature focuses on capturing complexity in the physical domain, which may neglect the system-wide perspective (Reference Mertens, Rennpferdt, Greve, Krause and MeyerMertens et al., 2023). To address these limitations, Reference Hennig, Topcu and SzajnfarberHennig et al. (2022) proposed a framework to systematically validate proposed measures. While this marks progress toward establishing valid and reliable measures, the field remains fragmented across the distinct aspects of complexity within the system architecture.
This study addresses the fragmentation by seeking to consolidate the multitude of metrics across the system architecture, extending the work of Reference Hennig, Topcu and SzajnfarberHennig et al. (2022). Specifically, we identify and categorize measures from the literature, and implement these measures within a computational framework that generates varying system architectures, enabling a neutral evaluation (Reference Hennig, Topcu and SzajnfarberHennig et al., 2022).
To this end, we build on the Extended Axiomatic Design (EAD) framework (Reference MertensMertens, 2020; Reference MeßerschmidtMeßerschmidt, 2025; Reference SuhSuh, 1998), which allows for representing system architectures of product families across four domains - functional, physical, process, and resource - along with their intra- and inter-connections (i.e., within and in between domains). This framework enables the generation of synthetic product family designs with diverse properties reflecting different design strategies, such as emphasizing commonality, modular kits, or platform-based approaches (Reference Krause and GebhardtKrause & Gebhardt, 2023). In doing so, it overcomes the limitations of studies restricted to one or a few case studies, thereby enabling more generalizable conclusions. Within this framework, we operationalize 15 widely cited complexity measures and evaluate them through a large-scale numerical experiment, followed by a correlation analysis to examine relationships among the metrics.
We contribute with three main results. (1) By reviewing and categorizing complexity measures proposed in the literature, this study sheds light on the large variety of existing approaches and provides an overview for future research. We find that most existing work focuses narrowly on product architecture, which motivates an examination of whether these metrics capture distinct aspects of complexity. (2) We reveal redundancies among existing measures within the EAD framework and advocate for a consolidated set of metrics (Reference Hennig, Topcu and SzajnfarberHennig et al., 2022). Rather than a shortage of measures, the challenge lies in embedding this aggregated knowledge into strategies for system architecture design. We find significant correlations, especially for intra-domain measures, indicating that most of them act as proxies for each other; except for the modularity metric, which captures a distinct aspect of complexity by reflecting specific coupling patterns within the physical domain. Additionally, it shows negative correlations with most structural and count-based measures, consistent with modular product architectures being associated with lower complexity (e.g., Reference Hackl, Krause, Otto, Windheim, Moon, Bursac and LachmayerHackl et al., 2020). (3) Physical design is often used as a proxy for complexity in engineering studies (e.g., Reference Hennig, Topcu and SzajnfarberHennig et al., 2022; Reference Sinha and SuhSinha & Suh, 2018); however, multiple domains contribute to the conceptual layer of complexity. Building on EAD, we operationalize complexity measurement in a standardized and replicable way across the system architecture (Reference Mertens, Rennpferdt, Greve, Krause and MeyerMertens et al., 2023). In doing so, we contribute to the development of a framework for evaluating complexity measures and pave the way to assess their impact on operational performance (Reference Hackl, Krause, Otto, Windheim, Moon, Bursac and LachmayerHackl et al., 2020; Reference Hennig, Topcu and SzajnfarberHennig et al., 2022). In turn, the framework enables the generalization of previous findings on complexity effects on operational performance, while its application and the resulting comprehensive view can directly support practitioners in design decision-making.
2. Related work
Complexity, arising from internal and external sources, requires effective complexity management for staying competitive and for improving operational performance (Reference Trattner, Hvam, Forza and Herbert-HansenTrattner et al., 2019; Reference Vogel and LaschVogel & Lasch, 2016). While external sources include market variety or technological change, product family complexity is an internal source driven by the system architecture (Reference Mertens, Rennpferdt, Greve, Krause and MeyerMertens et al., 2023). Complexity has many definitions (see Reference Jacobs and SwinkJacobs & Swink (2011)), often tailored to the specific research discipline in which complexity is of relevance. One of the earliest definitions originates from complex systems research, where Reference SimonSimon (1962) characterizes complexity as a property of systems composed of a large number of parts that interact in a non-simple manner. In general, the literature agrees that complexity is driven by two fundamental dimensions (e.g., Reference Summers and ShahSummers & Shah, 2010): element variety (or system size) and relational variety (coupling), reflecting interdependencies and change propagation within the system.
Modularity, by contrast, represents the structural system characteristic that counteracts complexity by reducing element variety and confining coupling to modules while minimizing inter-module coupling (Reference UlrichUlrich, 1995). Similarly, Reference NewmanNewman (2006) conceptualizes modularity as the extent to which connections within a subgroup exceed those expected across the overall network, representing the system as a matrix of intra-network connections. In product family design, modular architectures enable external variety with limited internal variety (Reference SalvadorSalvador, 2007) by decomposing systems into relatively independent, combinable modules with standardized interfaces and clearly defined functional assignments. The degree of modularity is determined by the characteristics of function binding, interface standardization, decoupling, and overdesign, which jointly promote the properties of commonality and combinability (Reference Hackl, Krause, Otto, Windheim, Moon, Bursac and LachmayerHackl et al., 2020). Commonality facilitates reuse and economies of scale through standardized modules, while combinability enables the efficient generation of product variants, thereby allowing complexity to be managed without sacrificing product variety. The literature discusses numerous effects on firms’ economic objectives across the product lifecycle (e.g., Reference Hackl, Krause, Otto, Windheim, Moon, Bursac and LachmayerHackl et al., 2020; Reference Mertens, Rennpferdt, Greve, Krause and MeyerMertens et al., 2023), highlighting a central trade-off between higher direct costs, for example due to overdesign, and lower indirect costs, for example resulting from reduced process variety and other complexity-related effects.
In sum, product family complexity is fundamentally well understood, prompting recent calls for integrated frameworks that enable the evaluation of its impact under varying design scenarios (Reference Hackl, Krause, Otto, Windheim, Moon, Bursac and LachmayerHackl et al., 2020; Reference Nørgaard, Grønvald, Christensen and MortensenNørgaard et al., 2025). For the purpose of modelling, numerous metrics have been proposed to capture multiple aspects of complexity and modularity, as summarized in major surveys (Reference Hennig, Topcu and SzajnfarberHennig et al., 2022; Reference Sinha and SuhSinha & Suh, 2018; Reference Summers and ShahSummers & Shah, 2010; Reference Trattner, Hvam, Forza and Herbert-HansenTrattner et al., 2019); however, little consensus exists on what constitutes an appropriate metric. Reference Hennig, Topcu and SzajnfarberHennig et al. (2022) review part of the literature and conclude that measures are sensitive only to specific aspects and do not capture complexity across all domains of the system. Reference Mertens, Rennpferdt, Greve, Krause and MeyerMertens et al. (2023), in a systematic review of engineering design literature, also note fragmentation, alongside growing interest from operations and management perspectives. They call for stronger integration across disciplines to establish a more unified research agenda. Furthermore, several studies report that the operationalization of economic consequences of product family complexity remains underdeveloped (Reference Hackl, Krause, Otto, Windheim, Moon, Bursac and LachmayerHackl et al., 2020; Reference Hennig, Topcu and SzajnfarberHennig et al., 2022). With this work, we make a step towards the development of such an integrated model by operationalizing complexity metrics from various studies within the EAD framework and by providing a consolidated set of metrics to account for variety and coupling across the system architecture.
3. Method
3.1. Extended axiomatic design
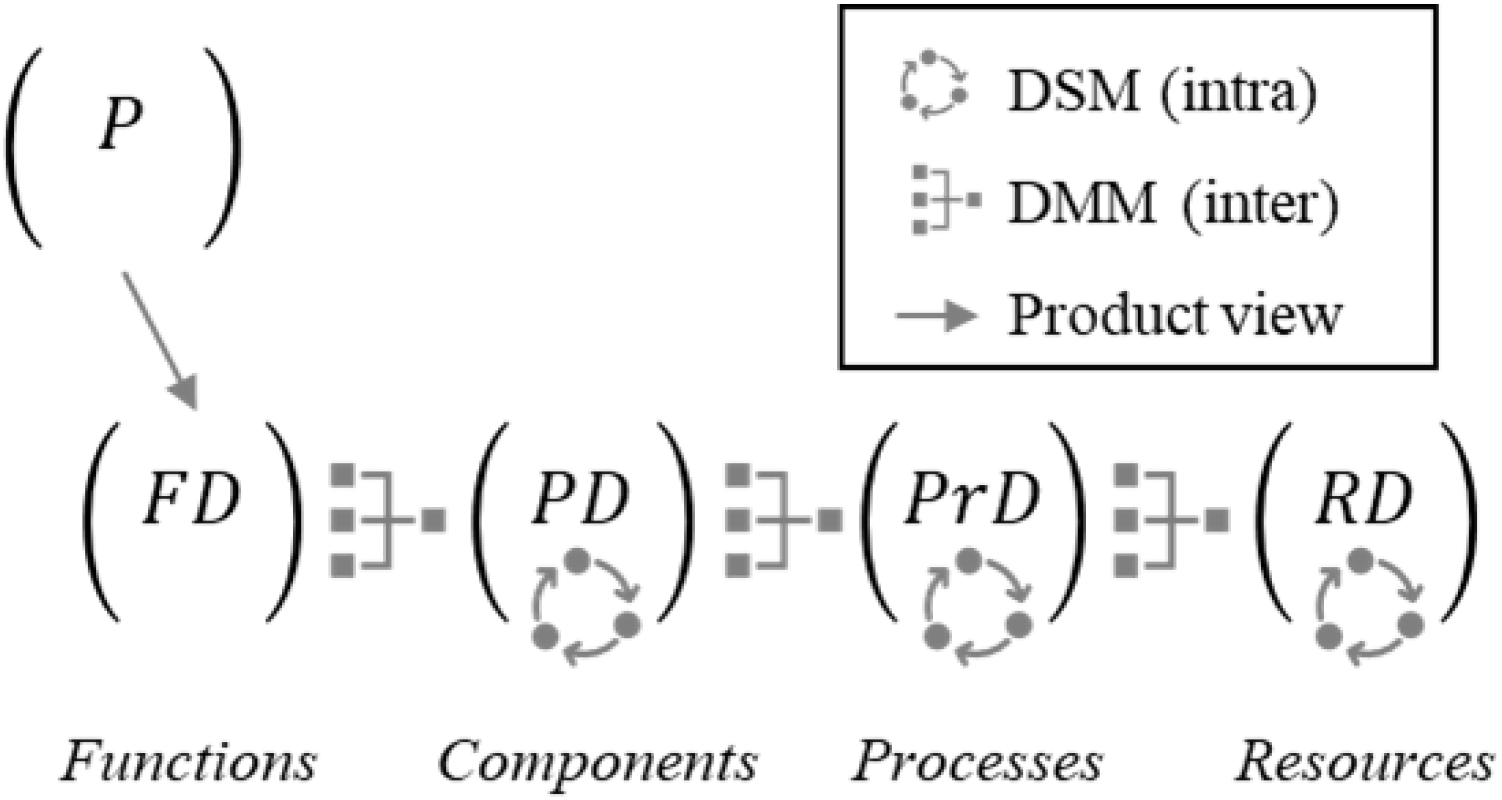
To operationalize product family complexity in a structured and reproducible way, this study builds on the EAD framework (Reference MertensMertens, 2020; Reference Meßerschmidt, Gumpinger, Meyer and MertensMeßerschmidt et al., 2020; Reference MeßerschmidtMeßerschmidt, 2025; Reference Meyer, Meßerschmidt and MertensMeyer et al., 2019). EAD extends the well-established Axiomatic Design theory (Reference SuhSuh, 1998), originally focused on complexity within product architecture (Reference UlrichUlrich, 1995), by adding the resource domain to include an organizational perspective (Reference Mertens, Rennpferdt, Greve, Krause and MeyerMertens et al., 2023). Dependencies within and across these domains are modelled using Design Structure Matrices (DSMs) and Domain Mapping Matrices (DMMs). DSMs capture intra-domain relationships, such as component interdependencies, while DMMs represent inter-domain relationships, for example linking components to manufacturing processes and required resources. As illustrated in Figure 1, the EAD framework models product families by representing product variants as unique combinations of domain elements within the underlying system architecture, spanning four interconnected domains.
This structure enables the generation of diverse product family designs and supports the consistent application of complexity measures across the functional domain (FD), physical domain (PD), process domain (PrD), and resource domain (RD) (Reference Mertens, Rennpferdt, Greve, Krause and MeyerMertens et al., 2023). The functional product view P
FD
- which itself is not considered a DMM - builds on the idea that products can be mapped as unique combinations of functional requirements. The product views of the subsequent domains are then derived by successive multiplication with the preceding DMMs, for example
 $${P_{PD}} = \;{P_{FD}} \cdot DM{M_{FDPD}}$$
.
$${P_{PD}} = \;{P_{FD}} \cdot DM{M_{FDPD}}$$
.
Schematic representation of the EAD framework

3.2. Product family complexity measures
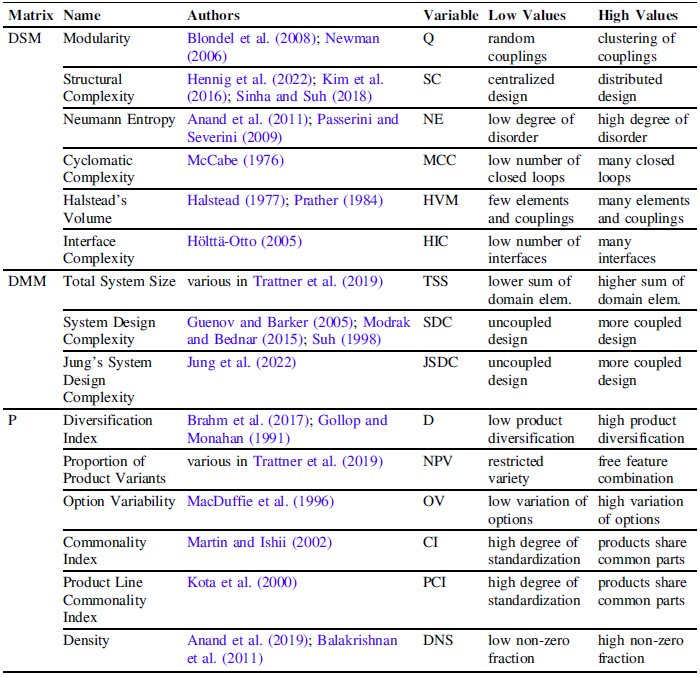
A large number of complexity measures have been proposed in the literature. We reviewed existing work, including major surveys (Reference Hennig, Topcu and SzajnfarberHennig et al., 2022; Reference Sinha and SuhSinha & Suh, 2018; Reference Summers and ShahSummers & Shah, 2010; Reference Trattner, Hvam, Forza and Herbert-HansenTrattner et al., 2019), and identified a pool of candidate measures. After screening for applicability, the metrics reported in Table 1 were selected for implementation, covering a representative spectrum of complexity aspects.
Not all measures identified in the literature are listed, as we excluded those that were not suitable for operationalisation within the EAD framework - either because they require additional information such as expert judgment, are limited to squared matrices, or could not be reproduced. This restriction limits direct validation against certain practice-oriented metrics; however, it enables a transparent and internally consistent comparison of complexity measures within the modelling framework. As such, the results provide a structured basis for future extensions of EAD-based models and support the development of integrated approaches to assess the cost implications of design decisions.
Complexity measures from the literature

Table 1 Long description
A table comparing various complexity measures and their authors, variables, low values, and high values. The table has 15 rows and 5 columns. The columns are labeled Matrix, Name, Authors, Variable, Low Values, and High Values. Row 1: Matrix, DSM; Name, Modularity; Authors, Blondel et al. (2008); Newman (2006); Variable, Q; Low Values, random couplings; High Values, clustering of couplings. Row 2: Matrix, DSM; Name, Structural Complexity; Authors, Hennig et al. (2022); Kim et al. (2016); Sinha and Suh (2018); Variable, SC; Low Values, centralized design; High Values, distributed design. Row 3: Matrix, DSM; Name, Neumann Entropy; Authors, Anand et al. (2011); Passerini and Severini (2009); Variable, NE; Low Values, low degree of disorder; High Values, high degree of disorder. Row 4: Matrix, DSM; Name, Cyclomatic Complexity; Authors, McCabe (1976); Variable, MCC; Low Values, low number of closed loops; High Values, many closed loops. Row 5: Matrix, DSM; Name, Halstead's Volume; Authors, Halstead (1977); Prather (1984); Variable, HVM; Low Values, few elements and couplings; High Values, many elements and couplings. Row 6: Matrix, DSM; Name, Interface Complexity; Authors, Hoeltta-Otto (2005); Variable, HIC; Low Values, low number of interfaces; High Values, many interfaces. Row 7: Matrix, DMM; Name, Total System Size; Authors, various in Trattner et al. (2019); Variable, TSS; Low Values, lower sum of domain elements; High Values, higher sum of domain elements. Row 8: Matrix, DMM; Name, System Design Complexity; Authors, Guenov and Barker (2005); Modrak and Bednar (2015); Suh (1998); Variable, SDC; Low Values, uncoupled design; High Values, more coupled design. Row 9: Matrix, DMM; Name, Jung's System Design Complexity; Authors, Jung et al. (2022); Variable, JSDC; Low Values, uncoupled design; High Values, more coupled design. Row 10: Matrix, P; Name, Diversification Index; Authors, Brahm et al. (2017); Gollop and Monahan (1991); Variable, D; Low Values, low product diversification; High Values, high product diversification. Row 11: Matrix, P; Name, Proportion of Product Variants; Authors, various in Trattner et al. (2019); Variable, NPV; Low Values, restricted variety; High Values, free feature combination. Row 12: Matrix, P; Name, Option Variability; Authors, MacDuffie et al. (1996); Variable, OV; Low Values, low variation of options; High Values, high variation of options. Row 13: Matrix, P; Name, Commonality Index; Authors, Martin and Ishii (2002); Variable, CI; Low Values, high degree of standardization; High Values, products share common parts. Row 14: Matrix, P; Name, Product Line Commonality Index; Authors, Kota et al. (2000); Variable, PCI; Low Values, high degree of standardization; High Values, products share common parts. Row 15: Matrix, P; Name, Density; Authors, Anand et al. (2019); Balakrishnan et al. (2011); Variable, DNS; Low Values, low non-zero fraction; High Values, high non-zero fraction.
3.3. Design of experiments
We adopt a Design of Experiments (DOE) approach (Reference Lorscheid, Heine and MeyerLorscheid et al., 2012) to generate synthetic product family designs within the EAD framework. The objective is to evaluate the metrics listed in Table 1 across a range of design alternatives. Linear (Pearson) and non-linear (Spearman) correlation analyses are then conducted to identify redundant metrics and select suitable proxy measures, thereby simplifying the model (Reference RobinsonRobinson, 2008). The resulting consolidated set of measures provides a foundation for future assessments of product family complexity, particularly in EAD-based studies.
We define independent parameters to control element variety, represented by the number of domain elements, and coupling characteristics in DSMs and DMMs, allowing systematic variation of complexity across designs. Density (DNS) is defined as the ratio of non-zero entries to the total number of entries and provides a normalized and easily comparable measure (e.g., Reference Anand, Balakrishnan and LabroAnand et al., 2019). Increasing values of DNS indicate stronger coupling, but provide no information on specific entry arrangement patterns, a limitation addressed by metrics such as System Design Complexity (SDC) metric (e.g., Reference Modrak and BednarModrak & Bednar, 2015). Based on Shannon entropy, SDC can be interpreted as an operationalisation of the Information Axiom (Reference SuhSuh, 1998) and has been applied across a range of research contexts. Generally, modular designs are expected to exhibit reduced density in the physical DSM, as they form clusters of strongly coupled components with minimal inter-cluster coupling. To explicitly generate modular structures within DSMs, an a priori specification of the desired pattern is required. The model enforces this using a greedy optimization algorithm that arranges matrix entries into the targeted structure while maintaining a given density (Reference Clauset, Newman and MooreClauset et al., 2004). The parameter Q controls how strictly this structure must be achieved. Values near zero indicate no clear patterns; with high values near one the pattern becomes more pronounced. The model generates distinct patterns, corresponding to modular strategies, with high-density clusters along the diagonal with weak couplings between clusters (e.g., Reference NewmanNewman, 2006). Arguably, an a priori definition is not well suited for practical application to an existing product family. Reference Hölttä-Otto and de WeckHölttä-Otto and de Weck (2007) propose a metric based on the decay of singular values, which could, for instance, be applied in this context but is not included in the present study. Modular architectures distribute information more broadly across the system and a larger number of eigenvectors is required for complete representation, resulting in a slower decay of singular values.
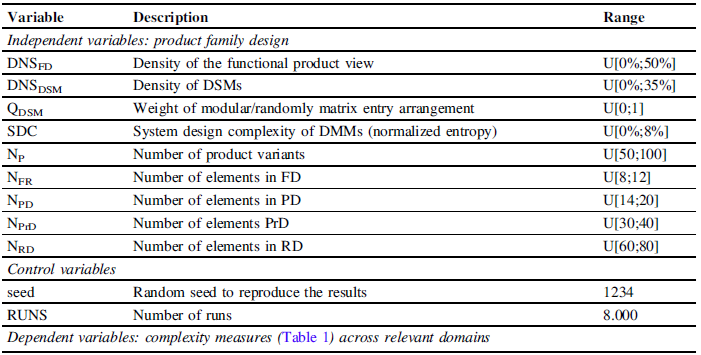
To ensure structural realism and diversity, parameter ranges are bounded by empirical limits reported in published DMM and DSM studies (Reference MeßerschmidtMeßerschmidt, 2025). Within these bounds, random designs are generated to match predefined target values for the independent parameters, using uniform sampling. All designs are represented as binary matrices. The main parameter settings are presented in Table 2.
Simulation protocol

Note. U[X;Y] uniform distribution between X and Y.
Using the DOE, approximately 8,000 synthetic product family designs were generated. For each instance, all 15 complexity measures were calculated across relevant domains. DSM and DMM metrics are applied to each domain as illustrated in Figure 1. While Option Variability (OV) and the Proportion of Product Variants on total possible Variants (NPV) are defined only for the functional product view, DNS and the commonality and variety indices (PCI, CI,D) are applied to product views of each domain (Reference Jacobs and SwinkJacobs & Swink, 2011). This results in 43 observations per generated product family.
4. Simulation results
4.1. Correlation analysis
The correlation analysis shows that several metrics are highly interrelated within their respective domains, broadly confirming concerns in the literature (e.g., Reference Trattner, Hvam, Forza and Herbert-HansenTrattner et al., 2019) that many metrics proposed in isolation are not independent constructs but alternative representations of the same underlying complexity aspects. Notably, the observed independence across domains reflects the DOE, which defines independent parameters for PFD, DSMs, and DMMs to account for the fact that complexity emerges system-wide from multiple, distinct sources (Reference Hennig, Topcu and SzajnfarberHennig et al., 2022; Reference Mertens, Rennpferdt, Greve, Krause and MeyerMertens et al., 2023).
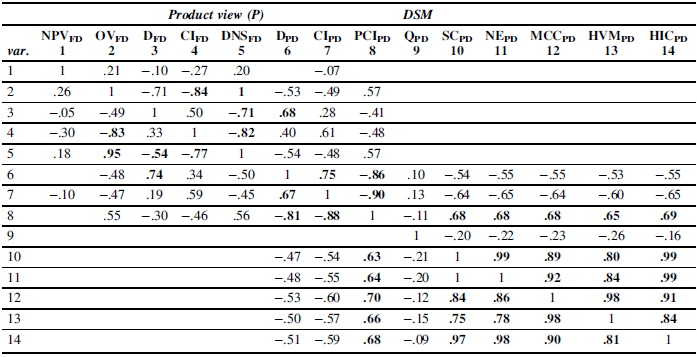
Table 3 reports the results for the functional (FD) and physical (PD) domains. For clarity, DMM metrics were excluded, and the analysis focused on product architecture, since similar correlation patterns were found in the other domains. Untabulated results indicate that the total system size TSS is largely uncorrelated (with the notable exception of .31 with PCIPD), whereas System Design Complexity SDCFDPD and the version of Reference Jung, Sinha and SuhJung et al. (2022) JSDCFDPD show a strong correlation (.82). All three metrics remain uncorrelated across domains. Similarly, most DSM metrics show near-identical behaviour within their respective domains. Another reason for the focus on product architecture is the impact of modularity, captured by the QPD metric in the physical domain. Its correlation values remain insignificant, indicating independence from other DSMPD metrics. The latter are primarily structural and count-based, yet their small negative correlations with QPD reflect that modular product architectures can mitigate complexity by decoupling elements within the physical domain (e.g., Reference Hackl, Krause, Otto, Windheim, Moon, Bursac and LachmayerHackl et al., 2020), that is, by combining components into modules.
Correlation table with focus on product architecture

Note. All coefficients shown are significant at p < 0.01. The lower triangle matrix shows Pearson coefficients while the upper triangle matrix shows Spearman coefficients. Coefficients considered eminent and discussed below are shown in bold.
The product-view metric Product Line Commonality Index PCIPD, applied in the physical domain, shows significant correlations with all DSMPD measures except for modularity QPD - despite not being a DSM measure itself. On the one hand this again highlights component commonality as a central aspect to assess complexity (e.g., Reference LabroLabro, 2004). On the other hand, it emphasizes that modular architectures exhibit distinct coupling patterns in DSMPD whose structural characteristics go beyond what measures for commonality can capture. The ability of EAD to explicitly represent modular structures is essential for distinguishing between different modular design strategies based on their coupling patterns. In future studies, this can support the assessment of their economic impact within an integrated framework (Reference Hackl, Krause, Otto, Windheim, Moon, Bursac and LachmayerHackl et al., 2020; Reference Hennig, Topcu and SzajnfarberHennig et al., 2022; Reference Nørgaard, Grønvald, Christensen and MortensenNørgaard et al., 2025).
Moreover, prior literature has particularly proposed a wide range of product-view metrics for the functional domain (see Table 1), most of which exhibit high correlations. Specifically, the density DNSFD shows strong correlations with Option Variability OVFD and the commonality index CIFD, while its relationship with the Diversification Index D is somewhat weaker. In our DOE, we used DNSFD as an independent parameter to generate different functional product views, whereas values for subsequent product views depend on the respective DMMs. Consequently, the correlations with DNS decrease along the domains (.56, .27, .06), while, interestingly, D corrects for this trend (.74, .61, .65). This suggests overlapping product family complexity aspects across domains, which, arguably, implies practical flexibility, as the measure can be consistently applied in whichever domain offers reliable data.
4.2. Reduction of variables
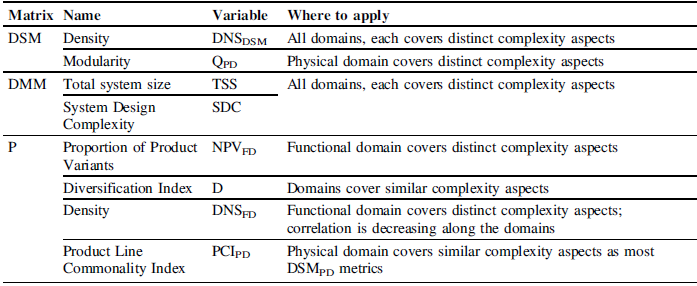
We aim to consolidate the multitude of complexity measures to generate collective knowledge on how to address the multiple aspects of complexity across the system architecture, covering the functional, physical, process, and resource domains. By identifying highly correlated variables and selecting suitable proxies, we provide a comprehensive yet manageable set of metrics to support the evaluation of product family design strategies. Table 4 presents this consolidated measure set. The set includes (1) count-based indicators for system size (TSS), product variants (NPV), and density (DNS); (2) topological metrics based on specific coupling patterns in DSMs (Q) and DMMs (SDC); and (3) indices to measure commonality (PCI) and variety (D) across product variants. The PCI was chosen as a proxy for DSMPD measures (except QPD) due to its wide acceptance in the literature and its robust Pearson and Spearman correlation results.
It is important to note that the identified redundancies are specific to the EAD framework and do not imply that the excluded measures lack value outside its scope. On the contrary, these measures may be well suited to other applications where contextual knowledge, simplicity, or data availability play a greater role.
Consolidated measure set

5. Conclusion
This study set out to develop a joint understanding on how to address product family complexity by reviewing, operationalizing, and analysing a broad set of established metrics. Building on the EAD framework, we implemented 15 measures and applied them across a range of synthetic product family designs, thereby enabling a neutral and reproducible comparison beyond single case studies (Reference Hennig, Topcu and SzajnfarberHennig et al., 2022). The results reveal substantial correlations among many of the proposed metrics, supporting earlier concerns that the field’s diversity of metrics often reflects overlapping constructs rather than distinct complexity aspects (Reference Hennig, Topcu and SzajnfarberHennig et al., 2022; Reference Trattner, Hvam, Forza and Herbert-HansenTrattner et al., 2019). In response, we propose a consolidated and parsimonious set of metrics that captures multiple aspects across the system architecture. The degree of modularity within the physical domain emerges as an independent aspect, underscoring its unique role in decoupling system elements and mitigating complexity. Moreover, we emphasize the integration of modular structure modelling into frameworks to assess the cost implications of distinct design strategies (Reference Hackl, Krause, Otto, Windheim, Moon, Bursac and LachmayerHackl et al., 2020; Reference Nørgaard, Grønvald, Christensen and MortensenNørgaard et al., 2025) - such as modular kits or platform-based approaches (Reference Krause and GebhardtKrause & Gebhardt, 2023).
First, we provide a structured overview of the fragmented literature by reviewing and categorizing existing complexity measures. We extend the work of Reference Hennig, Topcu and SzajnfarberHennig et al. (2022) by incorporating additional metrics that go beyond the physical domain, enabling a more system-wide perspective (Reference Mertens, Rennpferdt, Greve, Krause and MeyerMertens et al., 2023). Second, by implementing the measures within the EAD framework, we operationalize complexity measurement in a standardized and replicable manner across the functional, physical, process, and resource domains. In doing so, we directly respond to recent calls for integrated frameworks capable of evaluating product family design strategies in terms of cost effects and operational performance (Reference Hackl, Krause, Otto, Windheim, Moon, Bursac and LachmayerHackl et al., 2020; Reference Nørgaard, Grønvald, Christensen and MortensenNørgaard et al., 2025). Third, we provide a comprehensive measure set to capture product family complexity, offering researchers and practitioners a consistent foundation for systematically deriving implications for product family design and complexity management (Reference Hennig, Topcu and SzajnfarberHennig et al., 2022; Reference Sinha and SuhSinha & Suh, 2018; Reference Summers and ShahSummers & Shah, 2010; Reference Trattner, Hvam, Forza and Herbert-HansenTrattner et al., 2019).
Like other studies, this work has limitations. The evaluation was conducted on synthetic product family designs rather than empirical data, which may limit direct applicability. However, the large number of published case studies reporting DMMs and DSMs provides additional empirical data that could be systematically processed to extend model calibration and validation. Moreover, while the selection of measures was broad, it was limited to those applicable within the EAD framework, potentially excluding relevant aspects of product family complexity. Additional statistical analyses could be conducted to evaluate how much variance the consolidated set of measures explains, thereby strengthening their validity. Future work should build on this consolidated measure set to establish links between complexity and operational performance metrics, paving the way toward a more integrated framework for assessing cost effects of product family design strategies (Reference Hackl, Krause, Otto, Windheim, Moon, Bursac and LachmayerHackl et al., 2020; Reference Hennig, Topcu and SzajnfarberHennig et al., 2022; Reference Nørgaard, Grønvald, Christensen and MortensenNørgaard et al., 2025). In practice, this would enable decision-makers to directly evaluate the impact of design strategies and derive common guidelines for concrete use cases.

 Open access

