


Introduction
At essence, architectural design is a creative activity. It is creative in the sense that design is a search for satisficing solutions that minimize conflicts between different design requirements (Simon, Reference Simon1957). In defining creativity, Boden (Reference Boden1990) differentiates between psychological creativity (P-creativity) and historical creativity (H-creativity). P-creativity is related to the designer's frame of reference during the process of design. Yet, what is new to a designer might not be necessarily genuinely new to the design community. From that perspective, H-creativity depends on the frame of reference of a professional community through evaluating the historical discourse in the design's domain of knowledge. The definition of H-creativity could be quantitatively defined through comparing generated spatial layouts to a large set of architectural styles (Hanna, Reference Hanna2007), although such definition remains to be reductionist, as it does not attend to other qualities such as building material, the vertical dimension, the style of construction, and the finer grained description of designed layouts. It can also be argued that architects would have accumulated knowledge of architectural styles throughout their education and architectural practice, hence they possess tacit knowledge of the history of design progress. Designers’ expert knowledge can be used to assess how creative designs are compared to past designs. In linking a designer's frame of reference with the community's frame of reference, creativity attains social value. So there is a margin of subjectivity in designers’ expert judgment that can be reduced through attainting a level of agreement.
When evaluating creativity, there are nontrivial challenges in defining the frame of reference, particularly in what concerns the quality or value that is being assessed; is it purely aesthetical or does it have to do with function? In architecture, the manner in which building functions are programmed could be considered as a metric of creativity. Yet, efficiency in the spatial distribution of functions is not necessarily correspondent to higher levels of creativity. It is probably difficult to define a set of benchmarks to evaluate creativity and efficiency in design solutions, considering that there is a large universe of design solutions for every architectural design problem. Creative designs could belong to the larger universe of probable designs, but efficient designs would belong to a smaller cluster of possible designs where the performance of building function is highly optimized. A design solution can be considered as an emergent product of a set of local actions that respond to problems both locally and globally. P-creativity (Boden, Reference Boden1990) is defined as the number of original ideas in the design process. H-creativity could be evaluated by an external committee of expert designers and is dependent on their expertise, idiosyncrasies, and design education.
The main research question to be examined in this paper will be, is architectural design essentially meta-problem solving of ill-structured problems by the processes of finding succession of well-structured problems to solve?
The overall question can be unpacked into various subquestions from cognitive and architectural design perspectives:
How is information processed from the environment (the design problem and design solution), through to perception, cognition, and metacognition, in order to make judgments about drawing actions? Is there a pattern that regulates this process? Does this pattern differ for designs that are scored as highly creative compared to designs that are scored as least creative?
Metacognition involves knowledge about cognition or the cognition of cognition (Flavell, Reference Flavell and Resnick1976). More specifically, metacognition refers to a “higher-order executive capacity to monitor lower-order representations and to assess the fidelity and strength of these signals, in order to update a model of the probability that one is making correct judgments” (Yeung and Summerfield, Reference Yeung and Summerfield2012; Legrand et al., Reference Legrand, Engen, Correa, Mathiasen, Nikolova, Fardo and Allen2021). According to Shea and Frith (Reference Shea and Frith2019), metacognition is “a representation or evaluation of another cognitive state or process”. Metacognitive parameters include “confidence (certainty/uncertainty), fluency, familiarity, and precision”. Metacognition enables the monitoring of our thoughts, memories and perceptual information in order to inform learning, development, and communication (Fleming et al., Reference Fleming, Dolan and Frith2012; Shea et al., Reference Shea, Boldt, Bang, Yeung, Heyes and Frith2014; Heyes et al., Reference Heyes, Bang, Shea, Frith and Fleming2020). Meta-problem solving may involve finding successive well-structured problems in order to solve an overall ill-structured problem. In architectural design, metacognition is presumably the higher order regulation of relevant knowledge/memories that are recalled and instrumentalized where needed to support decision-making.
Metacognition is thought to involve (Jacobs and Paris, Reference Jacobs and Paris1987):
• Declarative knowledge, that is the ability to evaluate knowledge.
• Procedural knowledge, which involves both heuristics and strategies. The more certain one is about representations and goals the more easy it is to construct strategies.
• Conditional knowledge, that is the ability to determine why and when to use declarative and procedural knowledge.
The nature of the problem in architectural design is thought to be more of a graph of interlinked subproblems than it is of a succession of well-defined subproblems that branch into hierarchies. The role of a designer is to assign preferences for solving subproblems and this process defines the solution space. Variations on the solution space are minimized by how designers apply constraints over the course of the design process.
In general terms, metacognition involves planning, monitoring, and evaluation of tasks. This research attempts a description of metacognitive processes in architectural design and its role in creativity. It is thought that metacognition in architectural design involves monitoring the constraints’ criteria by which architects reason about. We attempt to model this process through the coding and mapping of knowledge-based constraints over the course of design activity.
Furthermore, we investigate the nature of design in architecture and how architects structure and prioritize information about constraints, actions, and strategies. Building on Simon's description of problem spaces (Reference Simon and Reidel1977), we attempt to define the problem space that characterizes architectural design as a dual search in the domain of the design problem and the domain of design solutions. We start with the assumption that there is a discursive language that describes every knowledge domain relevant to architecture, and we question whether there is a syntax of design that is a theory of metacognition that brings together different domains of knowledge relevant to design decision-making. The assumption is that a constraint relaxation process is applied by designers to filter out designs from the universe of probable solutions, to the universe of possible solutions, to eventually define a universe of satisficing solutions. Of interest, is whether there is a pattern that characterizes how constraints are applied over the course of the design process, and what level of metacognitive activity is involved in regulating decision-making during this process.
In the following sections, a list of aims and assumptions shall be identified. The contribution of this research to cognitive science and design research shall be outlined. The methods used in analyzing the design solutions and design process shall be explained, including: creativity and efficiency scoring, spatial statistics, protocol analysis studies (linkography), and semantic coding of cognition, metacognition, design constraints, problem spaces, and knowledge graphs. These methods shall be applied to identify patterns in metacognition and knowledge-based design constraints. The discussion section will present correlations between creativity and efficiency, and experiment variables, cognition, metacognition, functional allocations in design solutions, and design constraints.
Aims
The main aim of the research is to investigate whether creativity and efficiency scores – as assessed by expert knowledge – would have an impact on (1) the spatial distribution of spaces in the proposed design solutions and (2) the cognitive and metacognitive activity in design and how it couples the structure of information and the structure of knowledge utilized in design reasoning. These aims can be further tested and verified through the following list of hypotheses:
• Spatial distribution of partitioned spaces in the design solutions: Creativity and efficiency have an impact on the spatial distribution of spaces in the design solutions and on the ratio of space allocated for circulation to layout area.
• Highly creative designs compared to least creative designs: A design process that leads to a creative design displays a structured pattern of coupling between cognition, metacognition, design knowledge applied in the form of constraints, and information flows.
• Experiment variable: Creativity positively correlates with the number of words in the verbalized transcript and task period. Efficiency negatively correlates with the number of words in the verbalized transcript and task period. Both creativity and efficiency positively correlate with experience.
• Cognitive coding of design: Creativity correlates with aesthetical and perceptual cognitive segments.Footnote 1 Efficiency correlates with the number of functional, goal driven, and knowledge retrieval cognitive segments.
• Metacognitive coding of design: Efficiency positively correlates with the number of metacognitive segments. Creativity is less influenced by metacognition.
• Spatial distribution of functions: It is likely that both creativity and efficiency positively correlate with the number of spaces per layout. Efficiency negatively correlates with the amount of space wasted on circulation.
• Design constraints: Efficiency correlates with the number of constraints applied to define the spatial features and configurations of the layout, the functional constraints that define functional relationships between different zones, and other well-defined constraints that further define the functional performance of the layout. Creativity is less influenced by these constraints, and more likely to be influenced by other ill-defined constraints such as aesthetics.
Significance
The paper contributes to knowledge in design methodology research by investigating the relationship between metacognition, and knowledge-based reasoning during architectural design. Knowledge-based design constraints are coded as knowledge graphs for each block of design activity that defines a coherent set of operations relating to one problem space. This research builds on previous experiments (Al-Sayed et al., Reference Al-Sayed, Dalton and Hölscher2008, Reference Al-Sayed, Dalton and Hölscher2010), by attempting to discern distinct spatial features that characterize creativity and efficiency in design solutions. Creativity and efficiency are evaluated by a committee of expert architects. The design solutions are evaluated spatially to look for any correspondences between the scores assigned and the distribution of room size in the designed layouts. The semantic data of the design process was coded and modeled into linkographs, distinguishing different types of cognitive (Goldschmidt, Reference Goldschmidt and Kalay1992; Suwa et al., Reference Suwa, Purcell and Gero1998) and metacognitive activity and knowledge-based reasoning stated within design moves. We compare cognitive and metacognitive activity and knowledge-based reasoning in the design processes that were assessed to be highly creative and least creative. The assumption is that the association between cognition, metacognition, and knowledge-based reasoning is distinct in these two design processes. The efficiency of design process could be inferred from task period, word count, number of design moves, and productivity in linkographs (Goldschmidt, Reference Goldschmidt and Kalay1992) – to be later defined in the method section.
The study introduces advanced metrics in order to further our understanding of the structure of cognition, metacognition, and on the structure of information processing and knowledge-based reasoning during the design process. Entropy modeling of design protocols has been previously used to measure linkographs (Kan et al., Reference Kan, Bilda and Gero2007; El-Khouly and Penn, Reference El-Khouly and Penn2012). The paper demonstrates how entropy modeling of linkographs could help understand how metacognition corresponds to changes on the structure of information during design. Knowledge graphs were introduced in order to understand the structure of design reasoning.
Method
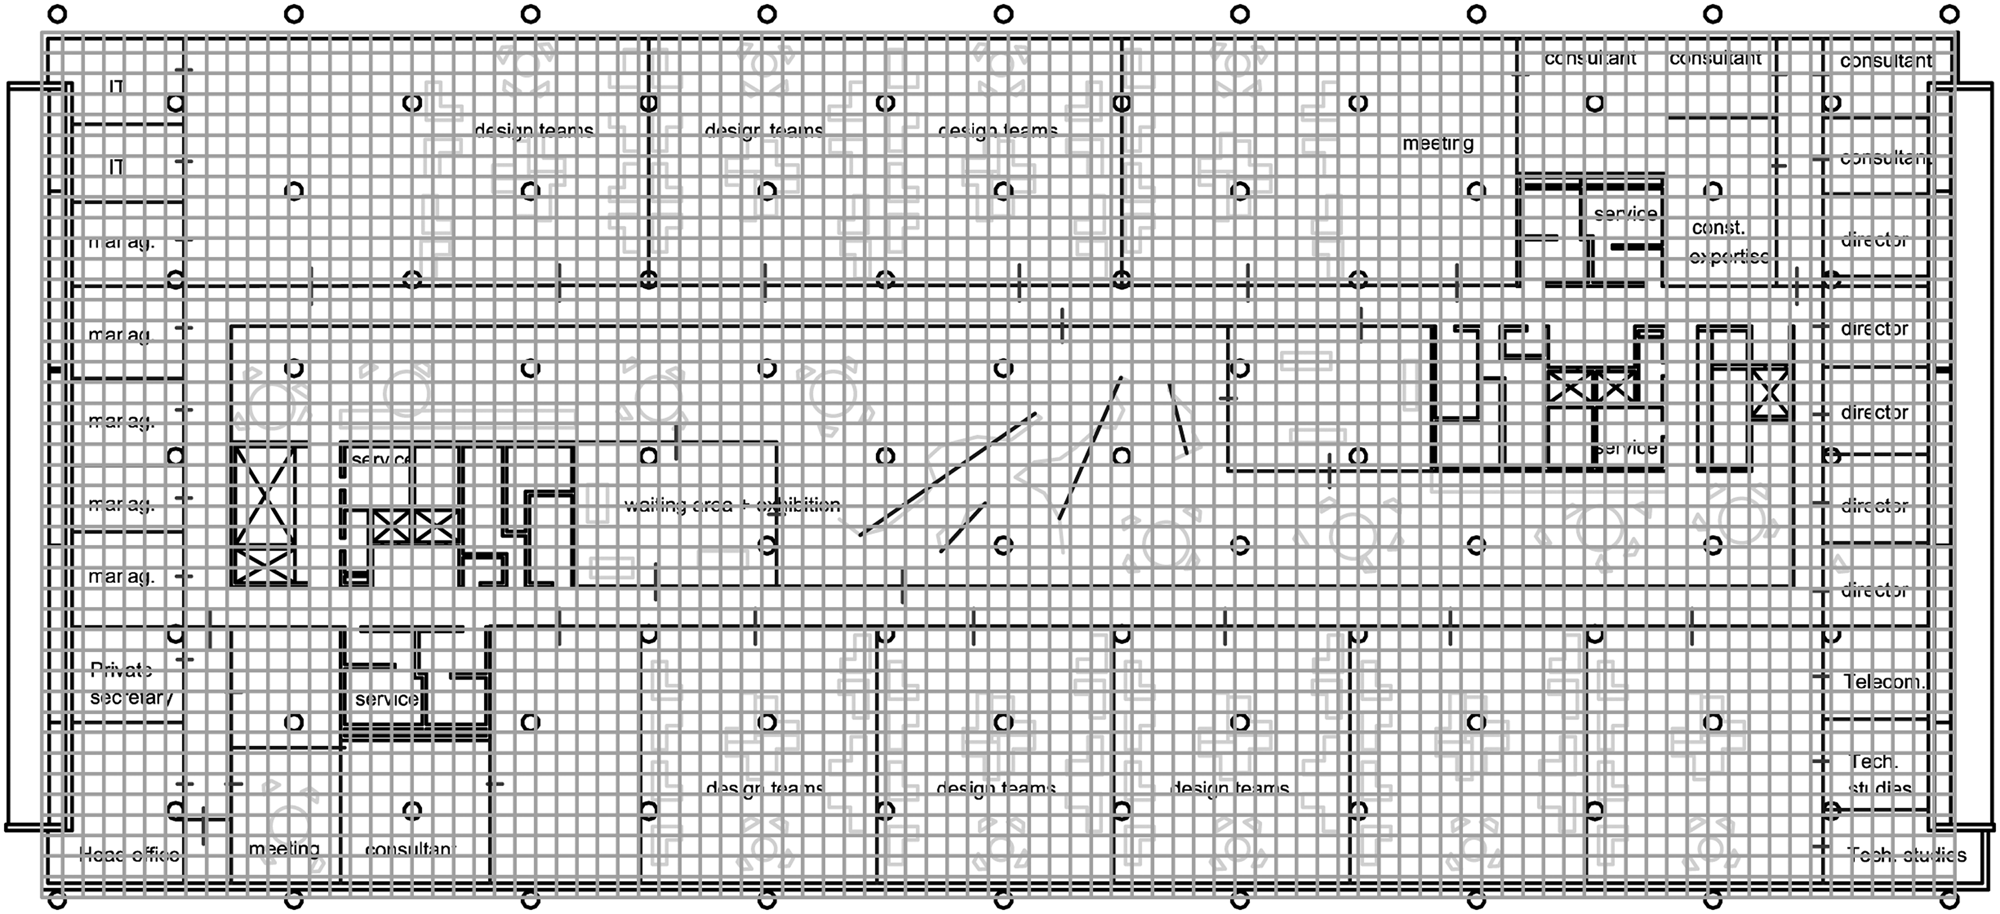
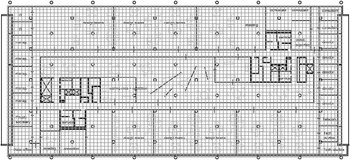
In order to investigate whether creativity can leave traceable patterns or markers on the design outcomes and on the process of design, this paper will use a range of methods to quantify and analyze design solutions, and represent and analyze cognitive activity during design processes (macroscopic analysis of verbal protocols and linkographs). A design task will be presented to a group of architects. The architects will be required to solve a well-defined design problem. A separate committee of expert designers will assess the creativity of design solutions. The tessellation in the spatial grid representing the design outcomes will be analyzed (Fig. 1). Cognitive analysis will be applied to the design processes to find distinct patterns in creative design.
Grid representation of layout 10. Grid unit equals 1.4375 m × 1.4375 m.
A description of the design experiment
Twelve design cases – previously studied by Al-Sayed et al. (Reference Al-Sayed, Dalton and Hölscher2008, Reference Al-Sayed, Dalton and Hölscher2010) – are reintroduced in this paper. Architects were asked to think aloud. The intuitive design task was limited to 15 min. A video camera recorded the drawing process and the architect's verbal expressions while describing his/her thoughts during the design process. The verbal comments were later transcribed in order to use them in protocol analysis. The protocol analysis considered semantic expressions without including physical acts. The design brief was limited to a set of functional spaces that form the basic requirements for an architect's office. Considering that architectural design problems are predominantly ill-defined, in that they are very likely to be a product of ill-defined and conflicting constraints, the scope was to limit the variation on how the brief might be interpreted. The program that sets the narratives for the relationships between the functions listed in the brief is likely to have impact on the spatial attributes of the design outcome. In order to simplify the design task, architects were required to allocate the functions listed in the brief into an empty 2D layout (see Table 1). The layout was a hypothetical rectangular floor plan in a skyscraper with two access points from two cores (Shpuza, Reference Shpuza2006). There are some challenging problems with regards to the layout settings and its massive size, the number and pattern of columns, and the two cores that link it with the external environment.
Design task include a brief for an architect's office and an existing layout, cited in Shpuza (Reference Shpuza2006)

We have attempted to control the experiment settings by using a 2D architectural layout rather than a 3D architectural layout, to limit the task to partitioning empty spaces and allocating functions to the spaces available. It is likely that a 3D task would have introduced more complexity to the solution space, making it difficult to compare design solutions spatially. Yet, a 3D design task would have led to creative variations on the solution space, making it easier to assign creativity scores to design solutions. This would be attempted in future research.
Modeling cognitive activity
The protocol analysis used to model design was constructed from macroscopic analysis and linkographs. The macroscopic analysis of verbal protocols is a content-based method that was proposed by Suwa et al. (Reference Suwa, Purcell and Gero1998) to analyze design activity. In Suwa et al., the design process is segmented using protocol analysis of physical actions and semantic expressions. Considering the scope of our research, physical actions (e.g., hand gestures) were ignored, but semantic expressions were recorded during the design process. In Suwa et al.'s model of categorizations (Supplementary Appendix 1), the semantic expressions were segmented into design actions. Their description separates physical, perceptual, functional, and conceptual cognitive actions, and they provide detailed subcategories. For the purpose of our study, Suwa et al.'s model of categorization was applied only partially. The only physical action that was taken into consideration was (L-action), which represents the state when designers look at previous depictions and refer to them semantically. Perceptual, functional, and conceptual actions will be fully considered as long as the subjects verbally express them. Perceptual actions (P-action) will be recorded whenever the architect refers to visual features or spatial relations. Functional actions (F-action) apply when an architect considers interactions between artifacts and people/nature, and account for the psychological reactions of people. Conceptual actions may occur during the process of knowledge retrieval (K-action), or whenever an architect makes preferential and aesthetical evaluations (E-action), or when an architect defines a goal (G-action). The segmentation model decodes every segment in relation to a corresponding reference. For instance, talking about cores defines one segment, while talking about design teams defines another segment. Further detailed segmentations refer to different cognitive actions as defined in Supplementary Appendix 1.
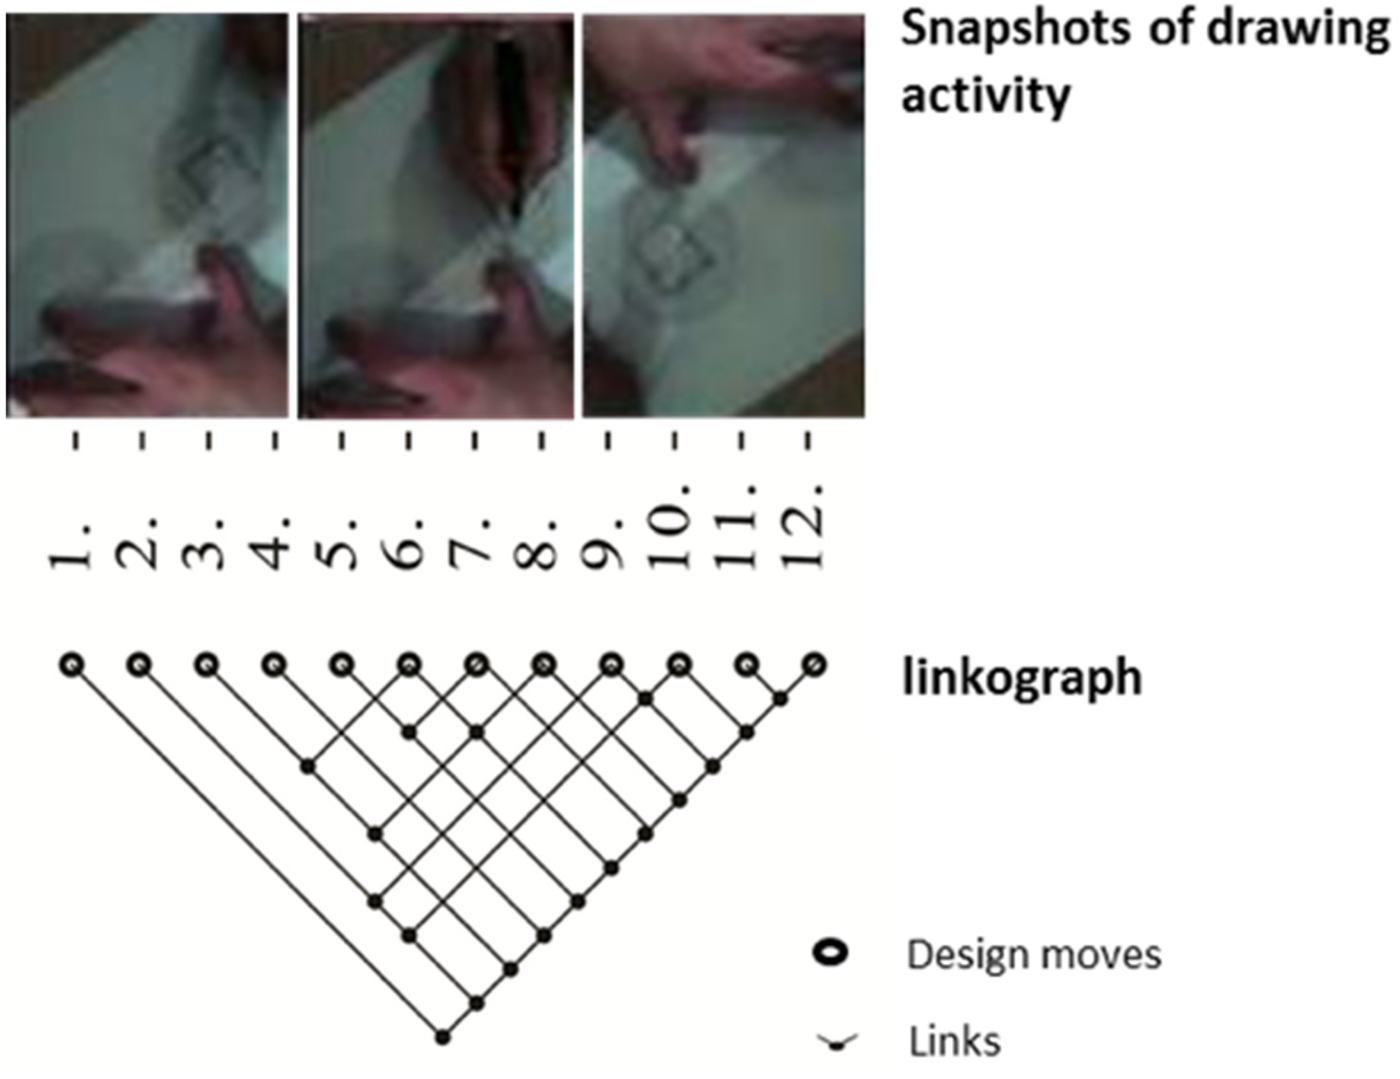
In a linkograph model (Goldschmidt, Reference Goldschmidt and Kalay1992), cognitive activity is recorded, segmented, and rebuilt into a relational structure that links design moves by matching their semantic meaning. The linkograph's protocol is segmented into a set of “design moves” with directed links. A “design move” is explained as “an act of reasoning that presents a coherent proposition pertaining to an entity that is being designed” (Reference Goldschmidt and Kalay1992). Links among moves are determined arbitrarily by the observer and are notated in a network. The design process is interpreted as a pattern of linked moves that comprise the graphic network of the linkograph. Goldschmidt identified two types of directed links: links connecting to preceding moves – “backlinks” and links connecting to subsequent moves – “forelinks”. Moves that have dense linkage connections, namely critical moves (CM) can be considered as indicators for design productivity. An example of a linkograph is represented in Figure 2, where the transcribed verbal comments are segmented into design moves (moves 1 to 12). Design moves were linked by nodes whenever they exhibited some association in terms of content.
A model of the linkograph's segmentation scheme.
In the original scheme of a linkograph, Goldschmidt referred to four main types. In Case 1, design moves are completely unrelated, indicating low potentials for idea development. In Case 2, design moves are completely interconnected, hinting to a fully integrated process in which successive ideas may suffer from fixation and lack of diversity; this leaves fewer chances for novel ideas. In Case 3, each design move is linked only to its subsequent move; this signifies a progression in the process with not much development in terms of ideas. In Case 4, design moves are partly interrelated, indicating a productive design process that provides plenty of opportunities for idea generation and development.
In order to highlight differences in nodes’ clustering, a Nonparametric Density Estimation (NDE) feature was used to distinguish patterns in the nodes’ point density (Kan and Gero, Reference Kan and Gero2008). The bivariate density estimation projects a smooth surface that describes the density of nodes in a linkograph at each point in that surface. The nodes are mapped in a two-dimensional space, and a set of contour lines are set at quantiles in 5% intervals. The contours are rendered to show the density of nodes in a linkograph. This means that 5% of the nodes are below the lowest contour, 10% are below the next contour, and so on. The highest contour has about 95% of the points representing the nodes below it indicating to clusters that contain the highest concentration of nodes within the contour boundary. These clusters may represent moments of “fixation” in the cognitive activity, where architects focus on solving certain problems. The nonparametric density method is computed by dividing each axis into a fixed number of binning intervals. The number of points is then counted in each bin. Following that, a smoothing kernel standard deviation is set. A bivariate normal kernel smoother is applied using a fast Fourier transform (FFT) algorithm and inverse FFT to do the convolution. Following this procedure, a contour map is created using a bilinear surface patch model. This method is explained in Rodriguez and Stokes (Reference Rodriguez and Stokes1998) and applied in SAS software. In this paper, the Kernel Standard Deviation was set to 6 to enable a comparison between all linkographs. A statistical representation of clustering in the node densities was favored over a structural description of the linkographs (Gong et al., Reference Gong, Xu and Zhang2009; El-Khouly and Penn, Reference El-Khouly and Penn2012). The latter was thought to present a wide range of variation in the structure subject to the representation of design moves.
Entropy measures the degree of order from a node in a topological graph using Shannon's formula of uncertainty (Reference Shannon1948):
 $${s}_i = \mathop \sum \limits_{d = 1}^{d_{{\max}}} -p_d\,{\log}\,p_d,$$
where d max is the maximum depth from vertex vi and pd is the frequency of point depth d from the vertex.
In the topological network of a linkograph, entropy is the distribution of design moves in terms of their depth from a specific design move. If the depth from a design move to other design moves is evenly distributed, the entropy is higher. If the depth from a design move to other design moves is unevenly distributed, the entropy is lower, and the depth from the design move is asymmetric. Entropy is thought to correspond to how easy it is to traverse to a certain depth within the linkograph network from a specific design move DM, that is how easy it is to link back and forth to design moves that precede or follow DM (low disorder is easy, high disorder is hard). Sudden changes between high and low disorder may have some associations with the type of cognitive activity and the diversity of constraints, and possibly with metacognition.
Coding design constraints
The linkograph's design moves were further coded in terms of the type of design constraints in design reasoning. The following categories of design constraints were coded (see Supplementary Appendix 2 for further description of each constraint):
1. Spatial constraints: Spatial constraints are described as any set of actions that are aimed to change the spatial configurations of design. We distinguish Partitioning, Orientation, Visibility, Accessibility, Adjacency, Circulation, Occupation, Integration, and Shape constraints.
2. Functional constraints: referring to design moves that verbally describe one function or more from the list of functions that are listed in the design brief.
3. Other well-defined constraints: We refer here to constraints that do not belong to the previously explained categories, but can be quantified – to a great extent – using numerical operators and mathematical functions. We list here: Lighting, Environmental, Structural, Dimensions, Material, Technical, and Furniture constraints.
4. Other ill-defined constraints, referring to constraints that are qualitative in nature. Some aspects of certain constraints, such as economical constraints, can be described quantitatively, although such descriptions are subject to the definition of value. The list of ill-defined constraints considered in this study are listed as follows: Aesthetical, Economical, Cultural, and Emotional constraints.
Modeling problem spaces and blocks of design operations
Problem space classifications can be traced back to Klahr and Dunbar's (Reference Klahr and Dunbar1988) categorization of dual space search into “hypothesis space” and “experimental space”. This could correspond to Alexander's “analysis” versus “synthesis” model of design (Reference Alexander1964), considering that “analysis” – as the decomposition of design problems into subproblems – is a search into the “hypothesis” space, while “synthesis” – as the set of operations and experiments conducted in search for a design solution – is correspondent to the “experiment” space. Klahr and Dunbar's model of “hypothesis” space versus “experimental” space (Reference Klahr and Dunbar1988), and Alexander's model of “analysis” versus “synthesis” (Reference Alexander1964), both correspond to Hillier and Leaman's model of “interpreted universe” versus “constructed universe”, linked by the “manipulable set” (Reference Hillier and Leaman1974). The molecule that defines the local dynamics of cognition in this model is defined in Hillier and Leaman's terms as the “conjecture-test” process, considered to be the basic unit of design by which designers test their assumptions against a set of constraints in order to further refine the solution space. Goel and Pirolli (Reference Goel and Pirolli1992) identified the hierarchy of design problem solving by making the distinction between modules, submodules, and statements. With all three levels, the control structure appears to be cyclical and repetitive throughout design. The structure of design problem spaces can be further classified into four problem spaces: representation space, hypothesis space, paradigm space, and experiment space (Schunn and Klahr, Reference Schunn and Klahr1995). A visual comparison of some of the models discussed here is presented in Table 2.
The definition of problem space in models of scientific discovery and models of design
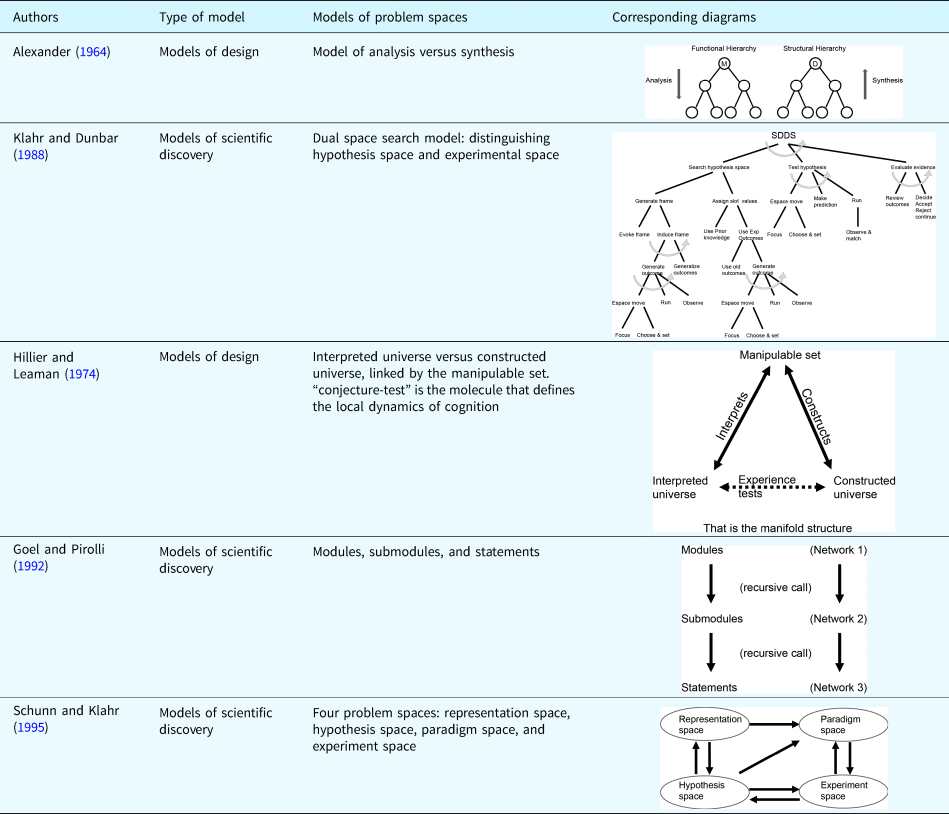
There are caveats that need to be taken into consideration when constructing analogies between models of design and models of scientific discovery, although key research in the field of design methodology bears association with other domains of knowledge [e.g., mathematics (Alexander, Reference Alexander1964) and linguistics (Hillier and Leaman, Reference Hillier and Leaman1974)]. The majority of the research reviewed above distinguished two types of problem spaces: one that is associated with problem definition, that is defined as the hypothesis space and constructed through analyzing and interpreting the design problem, and one that is associated with defining, synthesizing, constructing, and experimenting on the solution space. Hillier and Leaman defined a dynamic molecule that links the hypothesis space to the experiment space through the “conjecture-test” operation. Architects build conjectures of design solutions from information learnt from the design problem, and design experience, and test these conjectures through manipulating, testing, and changing the solution space. Schunn and Klahr (Reference Schunn and Klahr1995) add to the hypothesis space and experiment space, a representation space, and a paradigm space. If a paradigm space were to be interpreted in Kuhnian terms (Reference Kuhn1962), the notion of paradigm would be seen as the representative of an architectural theory. Architectural designers acquire a tacit knowledge of architectural theories, and history of design in their education. This knowledge informs and influences design practice and frames the idiosyncrasies of designers. Creating a paradigm space that is significantly different from documented paradigm spaces in architectural theory could be identified as historical creativity in Boden's terms (Reference Boden1990). Representation space is defined differently within the context of design compared to sciences. Suwa and Tversky (Reference Suwa and Tversky2003) argued that generating new representations is a function of perceptual ability to reorganize parts of drawings into the whole, together with conceptual abilities measured by fluency in generating new and related ideas. Fluency is a parameter of metacognition. Suwa and Tversky acknowledge that perception is a function of mental transformations, and conceptual abilities are a function of knowledge.
In the analysis presented in this paper, we distinguished two types of problem spaces: one that is related to the brief (problem space 2) and one that is related to defining the spatial features of the design solution (problem space 1). The design process is mainly a product of alternating problem space 1 (indicates actions related to the layout) and problem space 2 (indicates actions related to the brief) related actions. Within each problem space, there are blocks of coherent design operations. These are distinguished and modeled by translating the semantic transcripts into a pseudocode as illustrated in Supplementary Appendix 3.
Modeling design constraints sequencing into knowledge graphs
Knowledge graphs were constructed from semantic data by coding statements within design moves into design constraints. Each design constraint is a node in a network, the relationship between design constraints is represented as edges in the graph network. A knowledge graph of design constraints was mapped for each block of coherent operations in the design process. Knowledge graphs were visualized in Cytoscape software, using indices of Betweenness Centrality both for nodes and for edges. The color range of nodes represents a range of betweenness centrality values for each design constraint. The thickness of the edges represents values of betweenness centrality for edges (thick for higher values). It is theorized that an architect navigates a universe of knowledge-based constraints during design and utilizes each type of constraints in order to reason about design decisions. Higher betweenness centrality of nodes representing knowledge-based design constraints means that those constraints are visited more frequently as designers navigate their way from the problem-definition space to the solution-definition space. Higher betweenness centrality of edges indicates that the route between two types of design constraints is visited more often during the course of design. This modeling is used to illuminate the relationship between design constraints at different design phases, namely: what constraints are visited recursively? And how variations on the type of design constraints selected associate cognitive and metacognitive activity? These questions shall be further investigated in the results section.
Results
Assigning creativity and efficiency scores to design solutions
The main criterions used to evaluate design solutions are creativity and efficiency. Six MSc SDAC students (raters)Footnote 2 were to assess a set of design proposalsFootnote 3 for an architectural practice in terms of “creativity” and “efficiency”. The judgment is based on their “expert knowledge” as architects. The postgraduate students have acquired architectural knowledge during their undergraduate education and years of professional practice in architectural firms. During the first term of their postgraduate programme, the architects have also acquired an explicit analytical knowledge of architectural space using network science as a method for representing and analyzing architectural layouts enabling them to evaluate spatial accessibility and social behavior using scientific models. This level of knowledge qualified them to assess the efficiency and creativity of architectural layouts. The number of raters needs to be increased in the future to improve on the accuracy of ratings. Unfortunately, the ratings assigned to the layouts varied in their level of agreement. Based on measures associated with the Consensual Assessment Technique (CAT), a technique for measuring agreement between raters on assessing creative products (Lee et al., Reference Lee, Gu and Sherratt2011), the overall Kappa value (produced in JMP statistical software) was slightly higher than 0, indicating an agreement between raters for a given layout that is slightly higher than chance (0.07 for creativity and 0.04 for efficiency). The rater's agreement with him or herself and the other raters for a given layout varied between (11% and 20% in measuring creativity scores) and between (6% and 13% in measuring efficiency scores).
Pairwise correlation between each pair of raters across all the design solutions yield one high correlation (r = 0.348). This correlation is not statistically significant (p = 0.348, N = 12, and this is before doing Bonferroni correction for multiple tests. However, all but two of the correlations were positive, which by a binomial test is significant at p = 0.0067 (P = 0.5, N = 15, successes ≤ 13). This indicates that there is some level of agreement about the order of creativity scores.
When assessing the level of agreement on efficiency scoring, the greatest correlation found was (r = 0.64), the test was found statistically significant (p = 0.64, N = 12, after doing Bonferroni correction for multiple tests). However, only 7 out of 15 correlations were positive (N = 15, successes ≤ 7).
Following the calculation of mean and median scores across raters for each design solution, it was concluded that the medians act as the “ground truth” of the creativity and efficiency scores. The median can be thought as discounting outlying opinions. The mean/average creativity scores assigned to the layouts yielded proposal (layout 7) made by [AB] as the most creative design proposal, marking the highest average “creativity” score (C-score), while the design proposal (layout 2) made by [KS] was reported as the least creative. Average efficiency scores (E-score) yielded layout 3 as the most efficient design proposal, while layout 7 designed by [AB] was reported as the least efficient (Table 3). It is difficult to establish what makes efficiency in the designers’ judgment. One physical metric could be the ratio of circulation to layout area, an efficient layout minimizes circulation area while connecting all spaces. This does not count the inner circulation area within rooms. The definition of a circulation space is limited to those spaces that are defined as corridors or lobby areas. The ratio between circulation spaces to layout area corresponds to efficiency scores. Layout 3, marked with the highest efficiency score, has the least circulation area, and layout 7, marked with the lowest efficiency score, has one of the largest circulation areas. These distinctions do not apply to layouts 4, 6, 11, and 12, all appearing to have smaller circulation ratios, and are marked as average in terms of efficiency.
Average “creativity” scores (C-scores) and “efficiency” scores (E-scores) based on raters’ expert knowledge
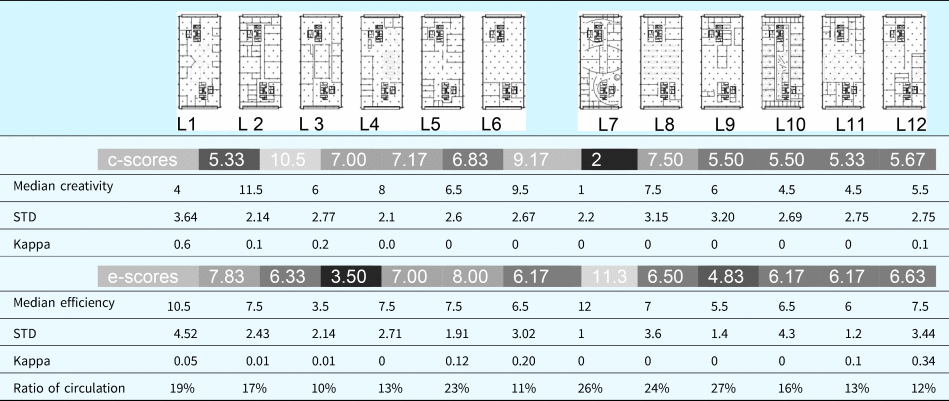
The scores (1–12) are averaged based on six observations, where higher scores indicated lower creativity or efficiency. STD and kappa values are included to show variability and agreement levels, respectively. The ratio of circulation to layout area is included to inspect its relation to efficiency.
There is a general agreement between raters about the designs that are scored as least and most creative, and the designs that are rated as least and most efficient. This is rendered out in low STD and Kappa values for these particular design solutions compared to other design solutions. The standard deviation for efficiency scoring correlations was higher (0.33) in all pairwise correlations compared to the standard deviation for creativity scoring correlations (0.13), therefore we proceed by examining the design processes that led to the design solutions rated with the highest and least creativity scores, and we exclude efficiency scores from this analysis. The mean values that were used for the creativity and efficiency scores were – in later sections – correlated to all other experiment variables and coded cognition, metacognition, design constraints, and functional distribution of designs. Correlations that were found significant were reported in the analysis/discussion section.
The distribution of room size in each design solution
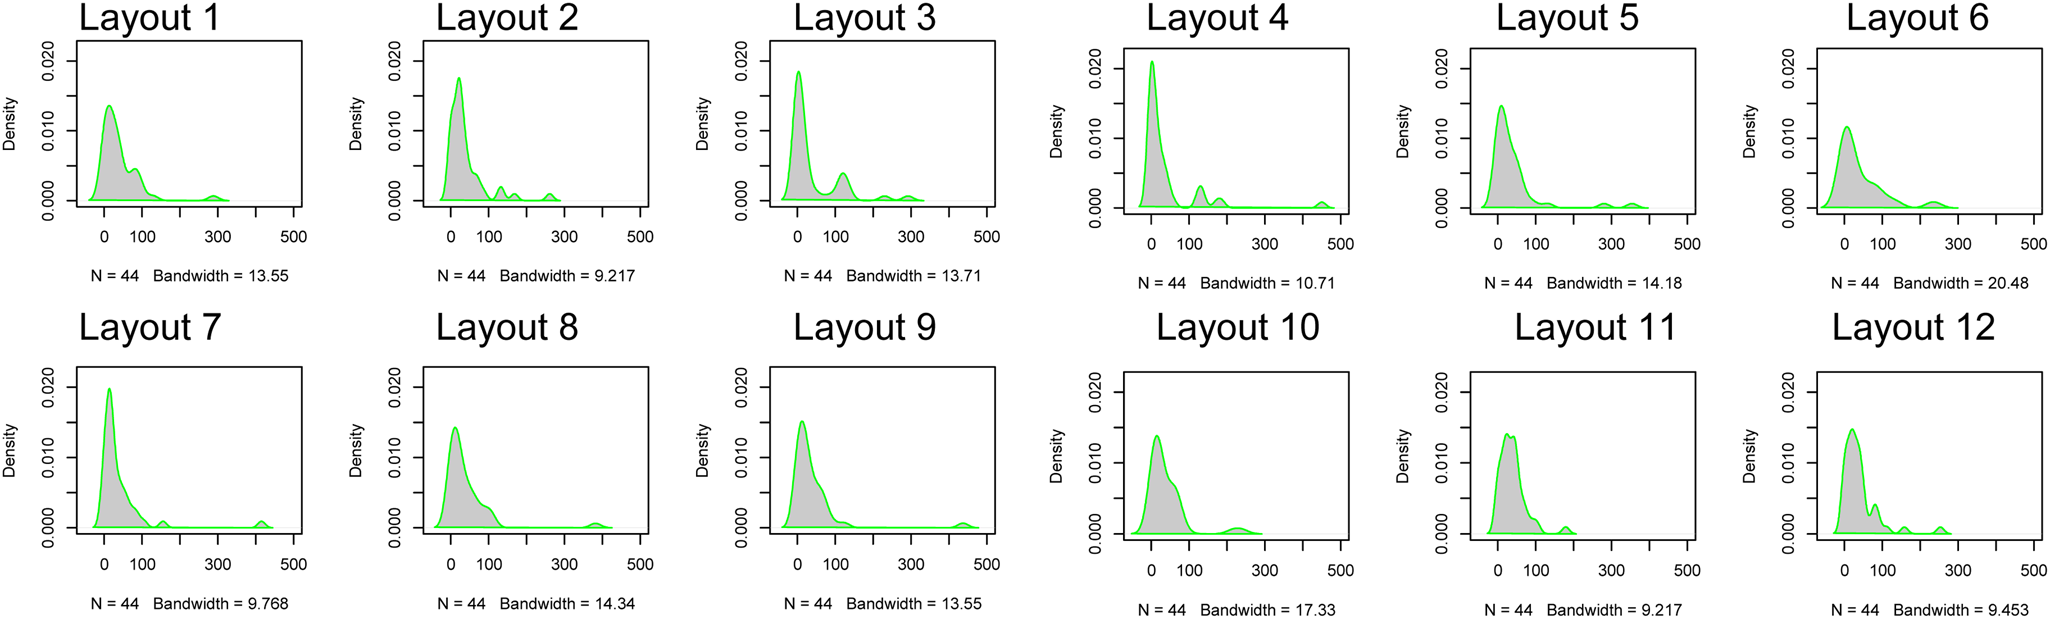
Measuring on the scores assigned and the distribution of space size in the designed layouts, it is difficult to establish whether higher creativity scores are related to the distribution of space size. Most layouts have a large number of small spaces (<100 grid points) and few large spaces (Fig. 3). Generally, there are no sharp distinctions in the density of smaller spaces up to 100 grid points and density of larger spaces above 100 grid points in relation to creativity and efficiency scores. Layout 3 scored as the most efficient appears to have a more regular pattern of change in the distribution of space size, with a large density of smaller spaces under 100 grid points, a smaller number of larger spaces between 100 and 150 grid points, and finally two clusters of larger spaces peaking at 230 and 290 grid points. It is not clear whether we can recognize creativity or efficiency from the distribution of room/space size in the designed layouts. Further analysis of the geometry is needed including shape proportions (Al Sayed, Reference Al Sayed2014), and other spatial metrics and features.
Distribution of areas defined by functions in the designed layouts. Areas measured by the number of grid units per layout. Grid unit equals 1.4375 m × 1.4375 m.
Modeling the protocols of the most and least creative designs
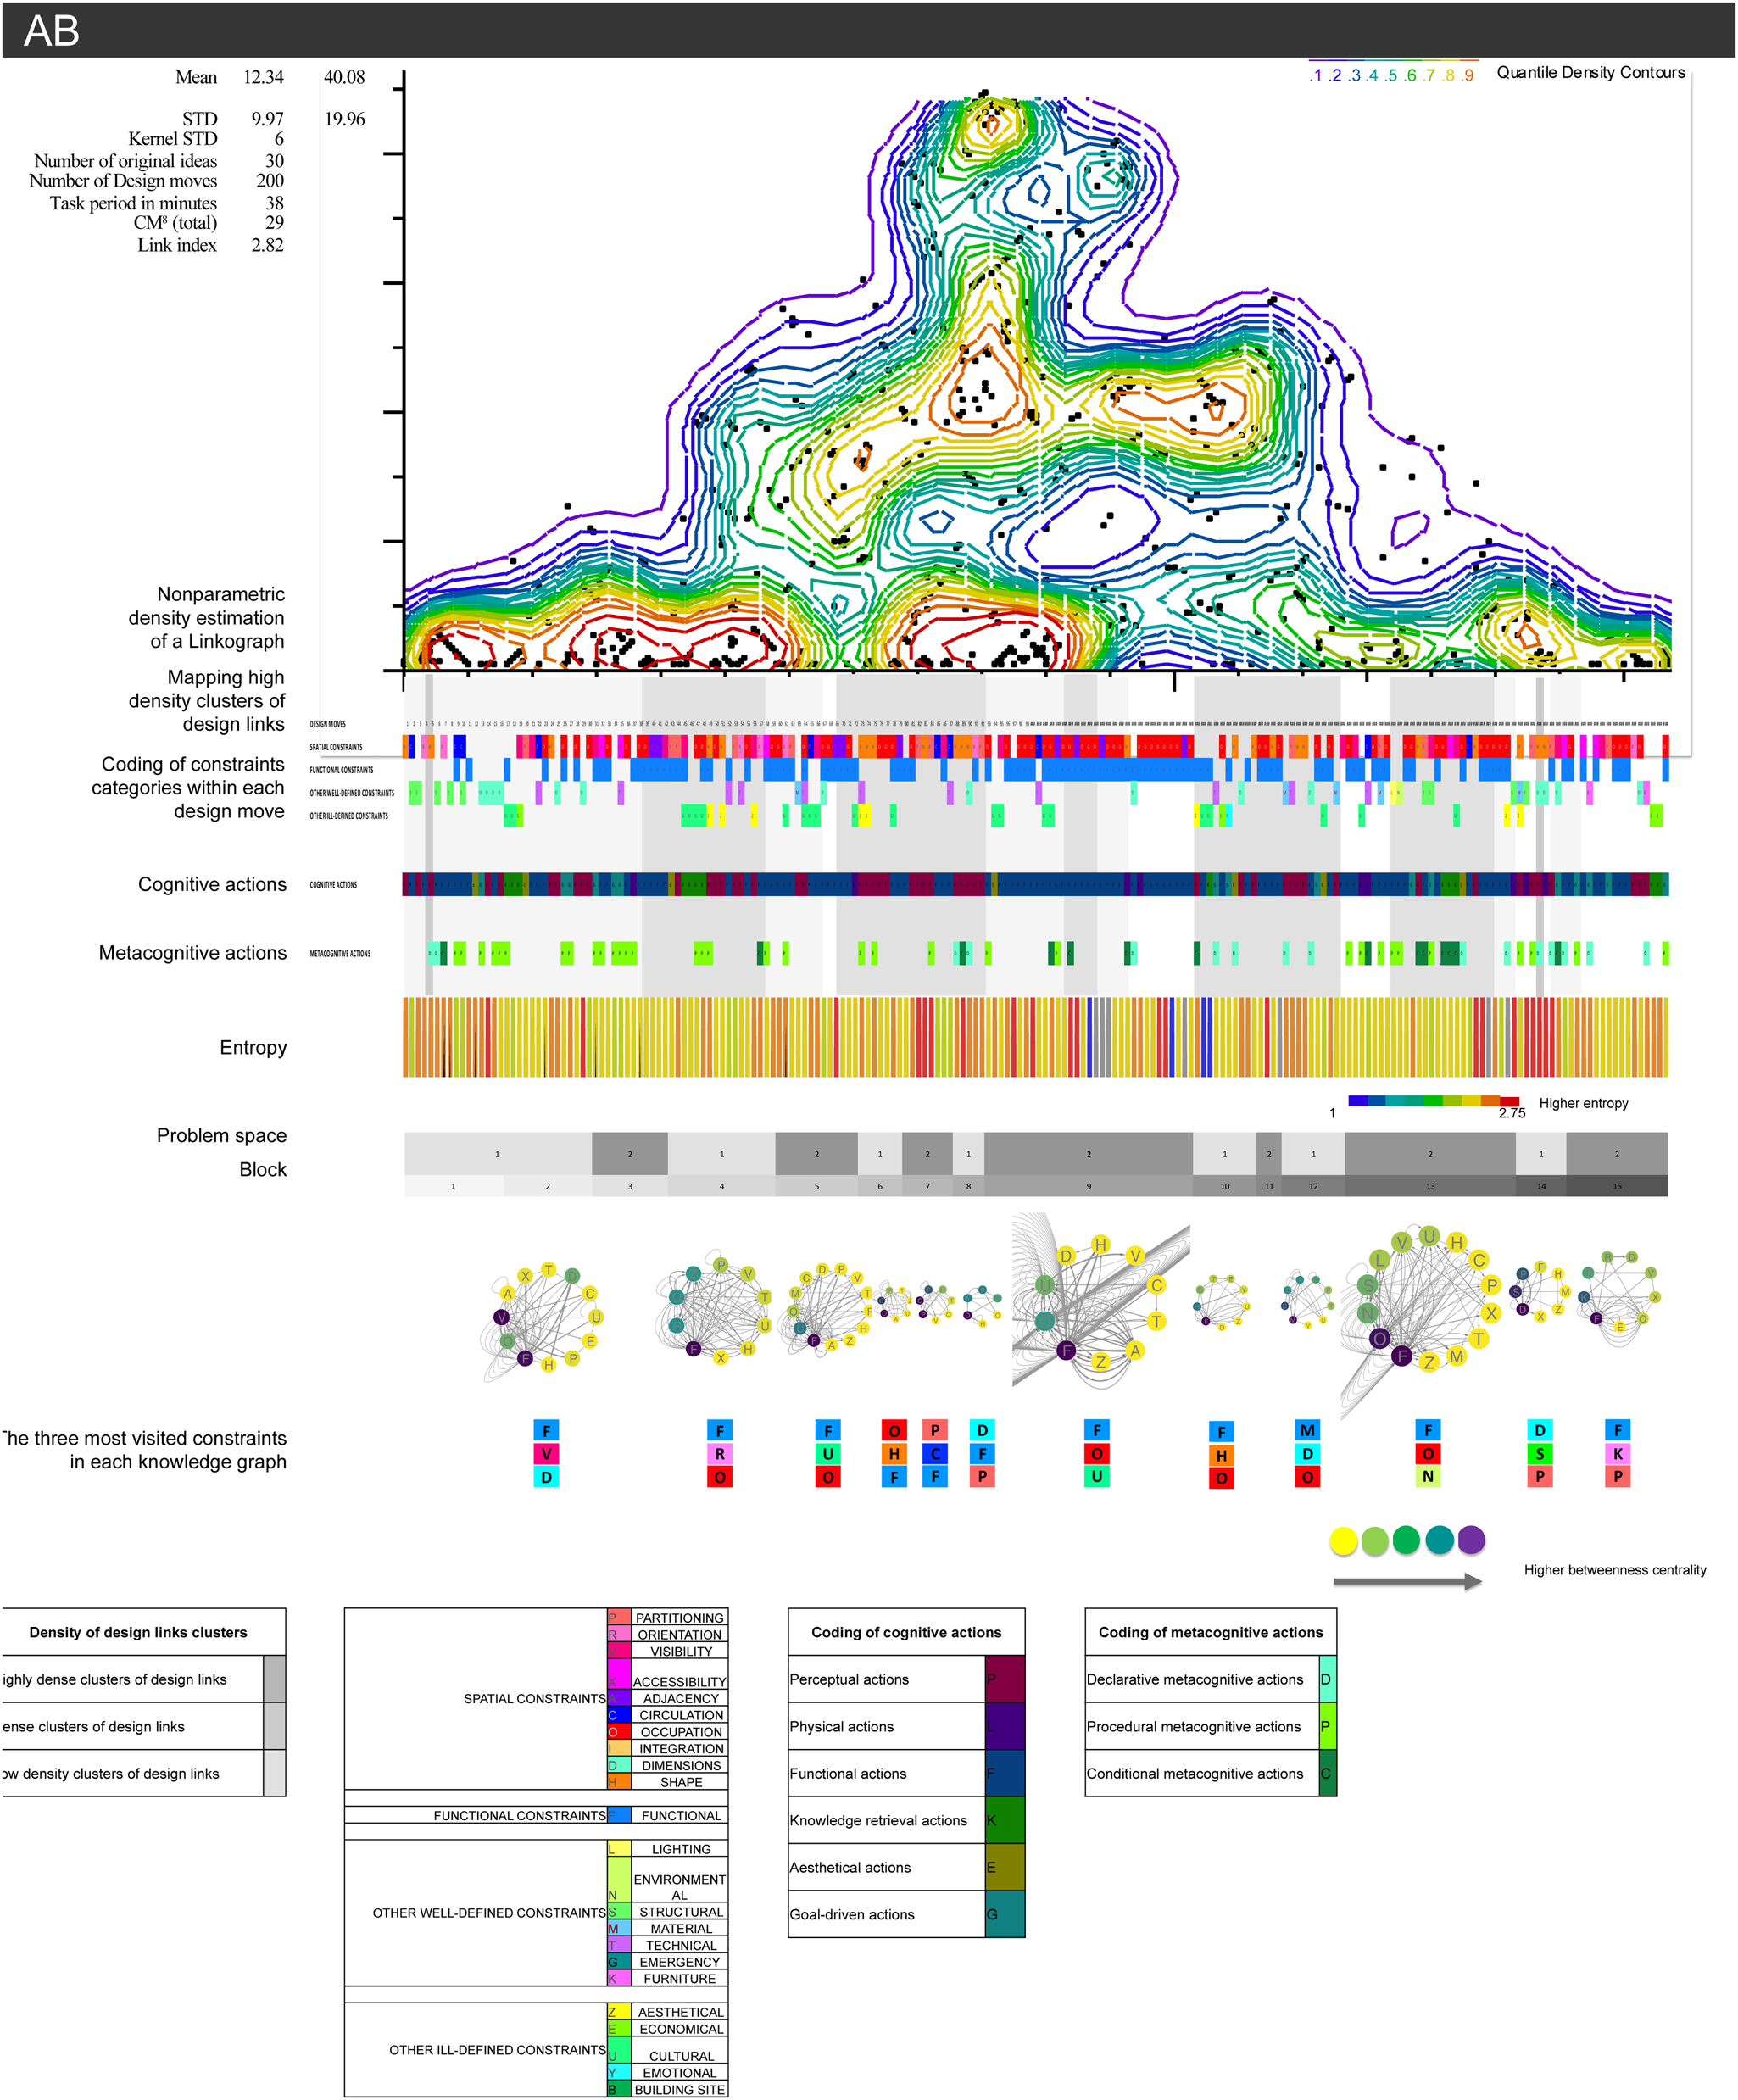
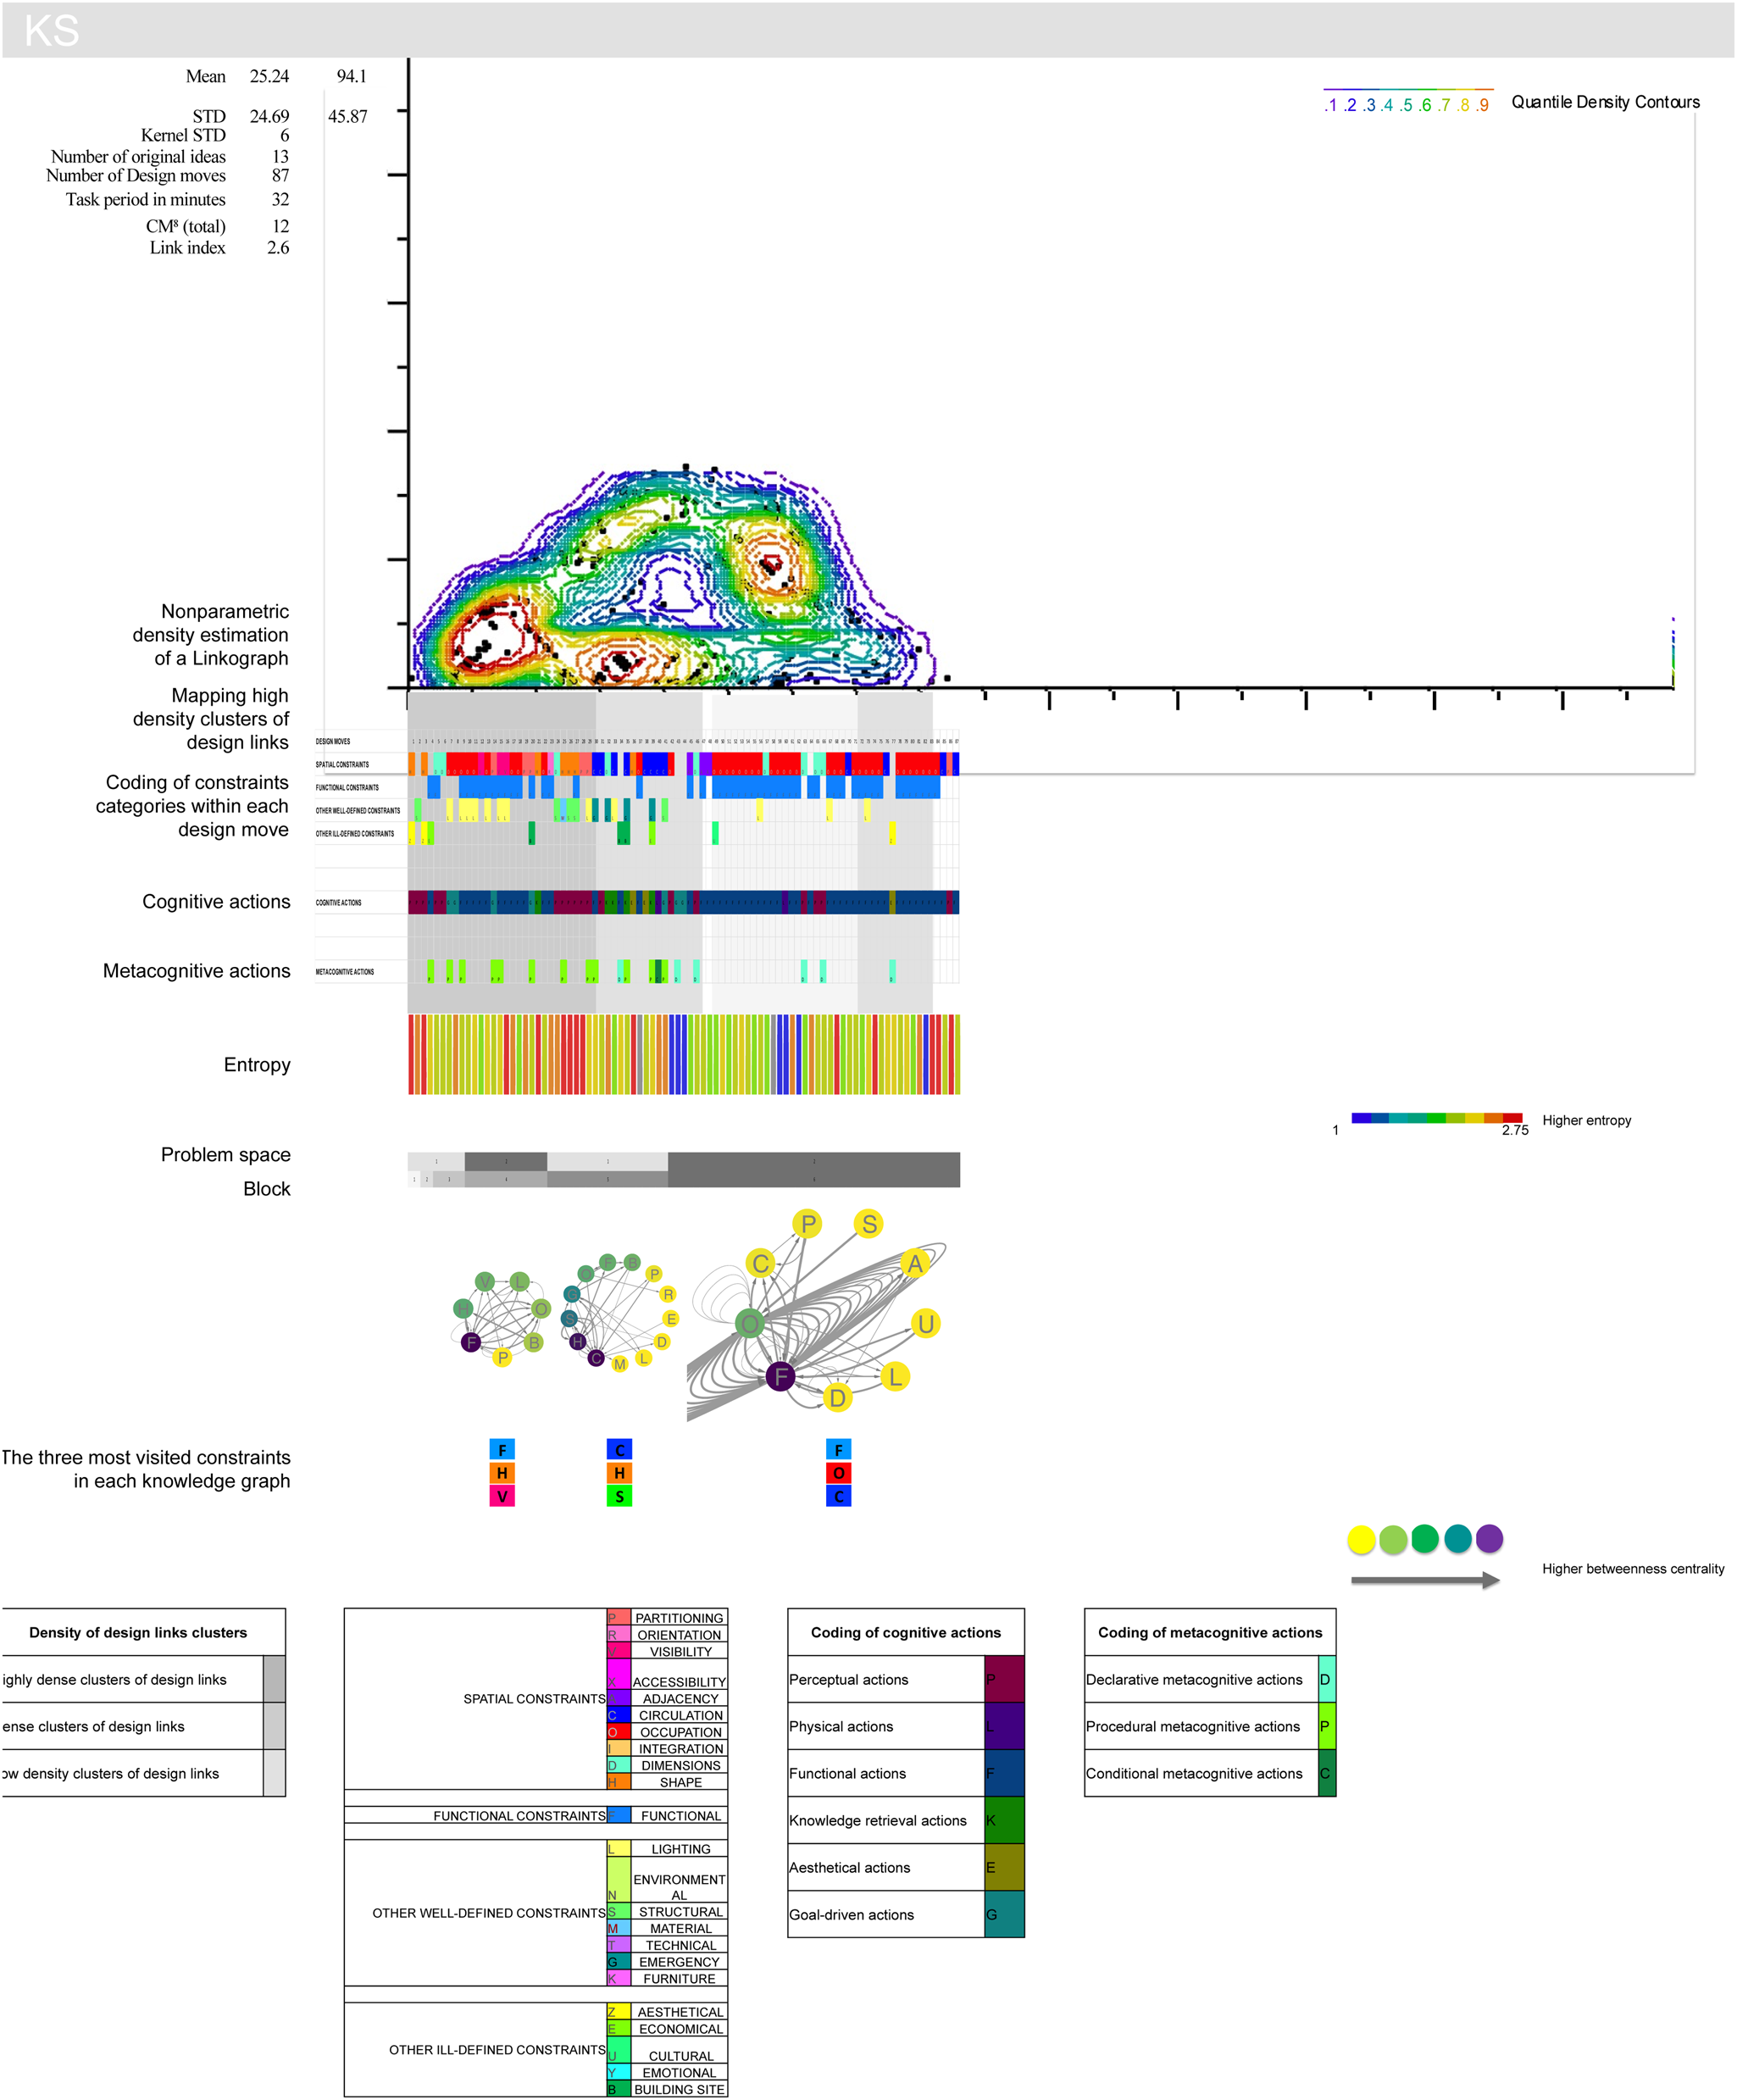
In this section, we analyzed the design processes that led to the most and least creative designs using macroscopic analysis and linkography. The macroscopic analysis showed higher frequencies of perceptual, functional, and aesthetically driven actions in AB's design process compared to KS (Fig. 4), despite the fact that the duration of both design processes was very close – AB consumed 38 min, whereas KS consumed 32 min. This suggests that a highly creative design is a product of a cognitive activity with higher frequencies of cognitive actions. The linkography analysis showed remarkable differences between AB and KS (Figs. 4 and 5, respectively). When setting the NDE models to similar kernel standard deviation levels, AB's linkograph showed a larger number of clusters than KS's linkograph. The clusters in AB's case are distributed at different levels: one aligning the horizontal axis linking sequential design moves, one in the middle connecting problem-definition, drawing activity and solution-definition stages, and a cluster at the top of the linkograph linking problem-definition and solution-definition stages. KS's linkograph showed a large cluster at the problem-definition stage, and a cluster connecting drawing actions and the solution-definition stage. The number of design moves, the number of critical design moves (> 8 links), and the number of original ideas pronounced verbally by AB are more than double the ones in KS's linkograph. The link index is relatively higher in AB's linkograph (2.82) compared to KS's linkograph (2.6). Goldschmidt (Reference Goldschmidt and Kalay1992) had previously found a correlation between design productivity and link index (ratio of links/moves). This indicates that higher productivity during design may yield higher creativity in design outcomes. This finding needs to be generalized on a larger population before confirming it true.
Mapping the density and entropy of a linkograph alongside design moves coded by cognitive actions, metacognitive actions, and design constraints. Nonparametric density estimation of linkographs representing the design process performed by AB. The X-axis represents the sequential progress of design moves over the period of the design session. Nonparametric density estimation produced using JMP. The statistical discovery software, version 5.1. Entropy's parameters are: range (0.5–2.751), average (2.211), and standard deviation (0.3). Knowledge graphs were mapped for each block in the design process. Knowledge graphs were visualized in cytoscape software, using indices of betweenness centrality.
Mapping the density and entropy of a linkograph alongside design moves coded by cognitive actions, metacognitive actions, and design constraints. Nonparametric density estimation of linkographs representing the design process performed by KS. The X-axis represents the sequential progress of design moves over the period of the design session. Nonparametric density estimation produced using JMP. The statistical discovery software, version 5.1. Entropy's parameters are: range (0.5–2.751), average (2.211), and standard deviation (0.3). Knowledge graphs were mapped for each block in the design process. Knowledge graphs were visualized in cytoscape software, using indices of betweenness centrality.
This section will describe and discuss the results concluded from mapping design constraints data table, design constraints in the knowledge graphs, cognitive actions (Suwa et al., Reference Suwa, Purcell and Gero1998), and metacognitive actions (declarative, procedural, and conditional) against the density of design moves and entropy of design links in the graph network of AB's linkograph. The design moves were coded from the verbal data in Al-Sayed et al. (Reference Al-Sayed, Dalton and Hölscher2008) and were built into a linkograph. The linkograph's density was computed and modeled as described in the method section. Additionally, entropy was measured in the topological network of the linkograph.
Design constraints (described in Supplementary Appendix 2) and cognitive actions (Suwa et al., Reference Suwa, Purcell and Gero1998) were mapped against the linkograph's model. The objective of this mapping was to further understand the relationship between the structure of the linkograph. We marked clusters that are highly dense and projected them against entropy and design constraints to distinguish any regularities that couple density of design moves, entropy in the linkograph, cognitive actions, metacognitive actions, and succession of design constraints (Figs. 4 and 5).
The mapping of a linkograph against coded content of design moves (cognitive actions, metacognitive, and design constraints coding) indicates a correspondence between clusters of dense design links (closer to the Y-axis) and entropy (Fig. 2). There is also an association between changes on entropy and metacognitive actions. In both design processes, knowledge graphs that represent the relationships between design constraints, were highly dense and structured during the phases (design blocks) that precede changes on entropy. There is some evidence on constraint relaxation coinciding with metacognition in AB's and KS's design processes. Metacognition is associated with phases that witness higher diversity on the types of cognitive activity, and higher diversity on the types of design constraints introduced. Phases that are characterized by an interplay between perceptual and functional cognitive actions, and a recursive application of function-occupation design constraints witnessed lower frequencies of metacognitive activity. In the first part of AB's design process, we found an association between low density knowledge graphs and higher density of metacognitive design moves. We also found a higher frequency of metacognitive design moves as designers shift from one design block to another design block, each defining a coherent task. There is no evidence on an association between metacognition and lower density of knowledge graphs, or phases that separate design blocks, in KS's design process. There are no notable patterns in the association between the three most visited design constraints in the knowledge graphs and metacognition, other than a higher frequency in conditional metacognition corresponding to the frequent use of environmental and cultural constraints in AB's design process.
Analysis/discussion
How creativity and efficiency correlate with different attributes of the design process and design solutions
Creativity and efficiency are not fully independent. There is a correlation of 0.51 between these two scores. We have listed in the introduction our assumptions on whether creativity and efficiency correlate to experiment variables, cognitive coding of design, metacognitive coding of design, the spatial distribution of functions in the layouts, and the number of design constraints applied during the course of design. Positive and negative correlations were considered if they were above 0.35 or below 0.35, respectively. We have listed our findings below:
• Experiment variable: Creativity correlates slightly with the number of words in the verbalized transcript and experience. Efficiency negatively correlates with the task period (Table 4a).
• Cognitive coding of design: Creativity positively correlates with the number of design moves, the number of design moves with original ideas, perceptual design moves, goal-driven design moves, and aesthetical critical design moves. Efficiency negatively correlates with the number of design moves with original ideas, looking at previous depictions design moves, perceptual design moves, and goal-driven design moves (Table 4b).
• Metacognitive coding of design: Creativity correlates positively with declarative and conditional metacognition. Efficiency negatively correlates with conditional and the total number of metacognitive design moves (Table 4c).
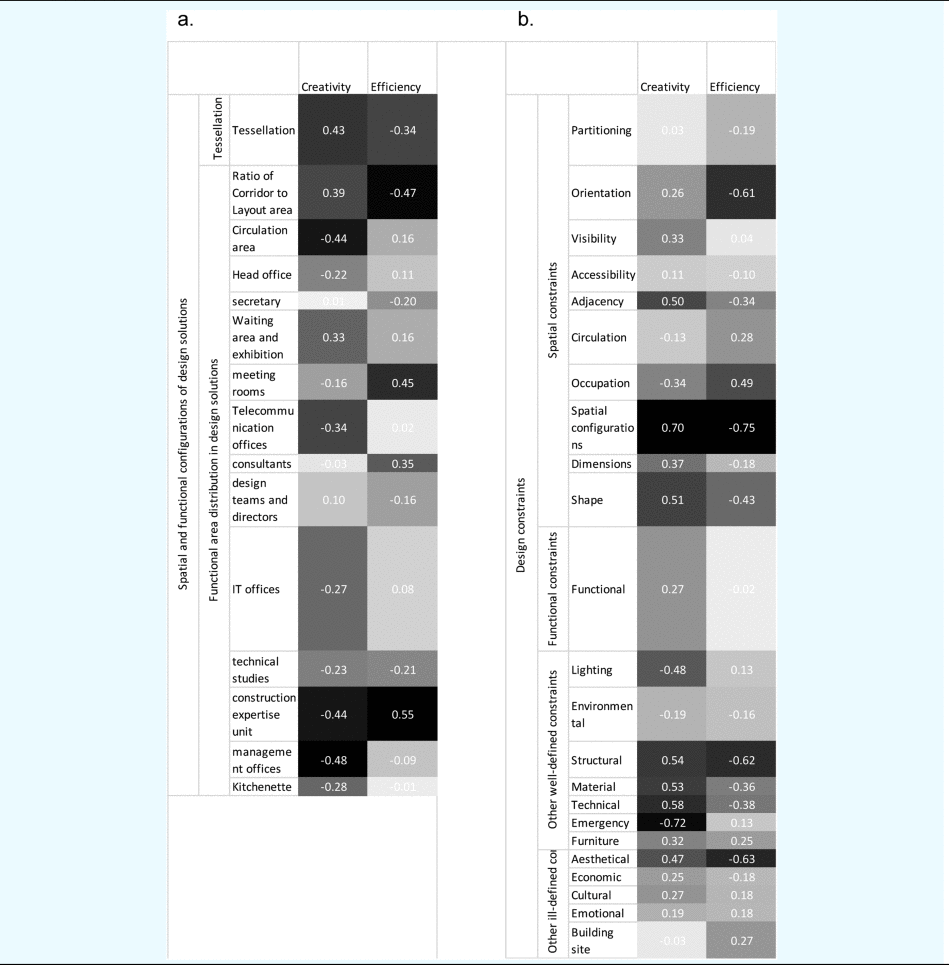
• Spatial distribution of functions: Creativity positively correlate with the number of spaces per layout and the ratio of corridor to layout area. Efficiency negatively correlates with the number of spaces per layout and the ratio of corridor to layout area (Table 5a).
• Design constraints: Efficiency negatively correlates with the number of constraints applied to define orientation of the layout, shapes, depth-related configurations, technical, structural, material, and aesthetical requirements of design. Efficiency positively correlates with constraints applied to define the functional occupation of spaces. Creativity positively correlates with the number of design moves that have addressed adjacency relationships, spatial configurations, dimensions, shape-relationships, structural, material, technical, and aesthetical requirements. Creativity negatively correlates with the number of design moves that have attended to lighting and emergency evacuation planning requirements (Table 5b).
Correlations identifying the relationship between (a) creativity and efficiency, and experiment variables, (b) creativity and efficiency, and cognitive attributes based on a linkograph representation, and (c) creativity and efficiency, and metacognitive design moves

Correlations identifying the relationship between (a) creativity and efficiency, and spatial and functional attributes of the proposed designs, (b) creativity and efficiency, and the types of constraints applied throughout the course of the design process
Correlations that are above chance for these observations (>0.53) or (<−0.53) are noted as follows (excluding datasets that contain a small count of observations):
– Creativity positively correlates with the number of original ideas, and perceptual cognitive design moves, and efficiency negatively correlates with design moves that entail looking at previous depictions (Table 4b).
– Creativity positively correlates with the number of structural, material, and technical design constraints. Efficiency negatively correlates with the number of orientation, structural, and aesthetical design constraints (Table 5b).
Conclusion
This paper reports an investigation into the markers that distinguish creativity in design protocols, and creativity and efficiency in design solutions. Creativity and efficiency in designs are assessed based on expert knowledge. The designed layouts are analyzed spatially to distinguish features that are associated with creative and efficient designs. A committee of experts was asked to assign creativity and efficiency scores to the designs. The verbal protocols of designers were modeled to check how cognitive activity, metacognitive activity, and knowledge-based reasoning differs in designs that lead to a creative solution compared to designs that are assigned low creativity scores. The spatial distribution of spaces in the designed layouts did not show considerable differences in size regardless of the scores assigned. It was possible to distinguish a relationship between efficiency and the ratio of circulation to layout area. Highly efficient designs had a smaller circulation area compared to least efficient designs. A creative design appears to be an outcome of a process that has higher ratio of linkages between design moves in linkographs. Moreover, a design process that yields creative outcome shows a systemic pattern of clustering that builds up hierarchically from the local scale of sequential design moves to the global scale, linking the problem-definition stage, the drawing activity stage, and the solution-definition stage in a linkograph.
The analysis of cognitive and metacognitive activity yields interesting associations with the sequence and graph structure of knowledge-based constraints. Metacognition is associated with changes on entropy in the graphical network of a linkograph and is preceded by highly structured and dense knowledge graphs representing relationships between design constraints. There is also an association between changes on entropy and metacognitive actions. Metacognitive actions seem to also coincide with frequent changes on the type of cognitive actions applied during the design process. The type of cognitive actions that are prevalent during high entropy phases are either functional or perceptual. There is an evidence on constraint relaxation coinciding with metacognition in the design processes examined. Metacognition is associated with phases that witness higher diversity on the types of design constraints introduced. Phases that are characterized by a recursive application of function-occupation design constraints witnessed lower frequencies of metacognitive activity. Higher frequency of metacognitive design moves were noted as designers shift from one design block to another design block, each block defines a coherent task. There are no notable patterns in the association between the three most visited design constraints in the knowledge graphs and metacognition, other than a higher frequency in conditional metacognition corresponding to the frequent use of environmental and cultural constraints in creative design. These findings are subject to how constraints are defined and coded from the content of the design moves, and how design moves and design links are coded and modeled in a linkograph.
In the analysis/discussion section, we examined correlations between creativity and efficiency, and experiment variables, cognitive activity, metacognitive activity, functional distribution of spaces in the layout, and design constraints. It was concluded that creativity positively correlates with the number of original ideas, perceptual cognitive design moves, and number of structural, material, and technical design constraints. Efficiency negatively correlates with design moves that entail looking at previous depictions, the number of orientation, structural, and aesthetical design constraints.
These findings remain to be experimental. They are subject to designers’ interpretation of what makes a creative and efficient design solution. The numbers of cases to compare are also very limited, and the circumstances underlying the original experiment – which was intended to compare two groups of architects with different types of expertise – may have influenced the dataset and the results of the analysis. Future studies will re-examine the methods of assessment by introducing more robust settings and metrics of evaluation to the case study including Creative Product Semantic Scale (CPSS) and Consensual Assessment Technique (CAT) (Lee et al., Reference Lee, Gu and Sherratt2011) methods to support the judgment criteria and measures set by the committee of experts.
Supplementary material
The supplementary material for this article can be found at https://doi.org/10.1017/S0890060421000251.
Acknowledgments
The authors of this paper would like to express their gratitude to Ruth Conroy Dalton and Professor Christoph Hölscher for their contributions to the initial part of the research conducted at UCL. The authors would also like to express their gratitude to all the participants in the research experiment and the panel of expert architects that have contributed to evaluating the creativity and efficiency of the design solutions. This research is partly funded by the University of Sussex.
Kinda Al Sayed is an associate tutor in cognitive science at the University of Sussex. She worked as a teaching fellow at the Bartlett school of Architecture, University College London (2010–2019). She served on several smart cities committees at the British Standards Institution since 2014. She also contributed to the Digital Built Britain construction strategy working for the UK Government Department of Business Innovations and Skills in 2014. Kinda worked as an active researcher on Screens in the Wild project. In addition, she worked as a research associate in a project funded by EPSRC Bridging the Gaps following the success of a Sandpit Big Data workshop at UCL. The project was focused on building statistical and computational models of the relationship between spatial accessibility and the London Riots. Before that she worked as a research assistant to produce animations for research on spatial cognition led by Prof. Ruth Conroy Dalton, UCL. She also worked as a research assistant at JSA Architecture & the Royal College of Arts to produce a design guide book for architects.
Peter CH. Cheng is a Professor of Cognitive Science, Department of Informatics, University of Sussex. He was the cognitive science Society Chair and Executive Committee Member (2009–11). He worked as a Senior Research Fellow/Reader (1999–2003), and a Research Fellow (1992–1999) at the School of Psychology, University of Nottingham. He collaborated with Prof. Herbert A. Simon on computational scientific discovery at the Department of Psychology, Carnegie Mellon University, Pittsburgh, PA, USA.
Alan Penn is Professor of Architectural and Urban Computing at the Bartlett School of Architecture, UCL, and Chief Scientific Adviser at the Department for Levelling Up, Housing and Communities. Alan is the former Dean of the Bartlett Faculty of the Built Environment at UCL, a founding director of Space Syntax Ltd, a UCL knowledge transfer spin out with a portfolio of projects including whole city masterplans, neighbourhood development plans and individual buildings. He is a Board Member of the Academy of Neuroscience for Architecture. He is a member of the Space Syntax Laboratory where his research includes the development of methods of representation of spatial configurations within and between buildings. This allows control of the design variable in studies of human behaviour and social and economic function.


 Open access