


Introduction
Depletion of gas fields, even in a tectonically inactive area, can induce earthquakes (e.g. Segall, Reference Segall1992; McGarr et al., Reference McGarr, Simpson, Seeber, Lee, Kanamori, Jennings and Kisslinger2002; Langenbruch & Zoback, Reference Langenbruch and Zoback2016). This is also the case for the largest European gas field, the Groningen field, which is located in the north of the Netherlands. The field was discovered in 1959, and production started in 1963. So far, more than 75% of the gas originally in place has been produced, and production is expected to continue at declining rates for the next 60 years (up to 2080). Production of the field during the first ~28 years went smoothly, without any seismic events being detected in the area (magnitude of completeness at that time was c.2.5). The first detected seismic event occurred in December 1991, with a magnitude M L = 2.4. Since then induced seismicity has occurred on a regular basis, at a more or less constant rate during the first decade after 1991, followed by a tendency of seismicity to increase, both in frequency and magnitude, since the beginning of this century. The seismic network for detecting induced seismicity in the region has been dramatically improved. The latest extension of the network was in 2014. The network can now detect events as small as M L = 0.5 everywhere within the contours of the Groningen field.
The negative publicity surrounding induced seismicity in the Groningen area increased after the, so far, largest event of M L = 3.6 which occurred in August 2012. To meet public concern, a number of studies have been initiated aiming to understand the cause of the induced events in Groningen (Muntendam & de Waal, Reference Muntendam and de Waal2013; NAM, Reference Muntendam and de Waal2013; TNO, 2013, 2014; van Wees et al. Reference van Wees, Buijze, van Thienen-Visser, Nepveu, Wassing and Orlic2014).
It is clear that the Groningen seismic events are caused by the changes induced in the subsurface by gas production. Due to gas depletion of the field, pressures have declined from c. 350 bar to c. 100 bar. It is natural, then, to search for a relationship between the amount of production and the number of seismic events (Bourne et al., Reference Bourne, Oates, van Elk and Doornhof2014). A key question is whether reduced production would lead to a reduction in the number of seismic events. This question can be addressed since the Minister of Economic Affairs decided, on the advice of the regulator, to reduce gas production in the central part of the Groningen field from 17 January 2014 onwards. Gas production was reduced at five clusters (PAU, POS, LRM, OVS and ZND) located in the centre of the field. The centre was chosen because this area has the largest event density and the largest compaction in the field. Furthermore the largest events have occurred there. This paper summarizes a variety of analyses, detailed in reports and an article (Nepveu et al., Reference Nepveu, van Thienen-Visser and Sijacic2016) on the seismic events in the Groningen field, using two statistical techniques: classical statistics and Bayesian statistics. We focus on the effect of the production reduction and the effect of production fluctuations on the observed seismicity of the field. The following sections each summarize the methods and results from a particular analysis, while the last section presents conclusions and opens the way to further discussion.
Effect of production reduction on induced seismicity
From a geophysical point of view it is to be expected that gas production influences the compaction and the stresses in the subsurface and around faults. Hence, one may expect that continuing production and changes in the production rate have a bearing on the rate of seismic events. The validity of this expectation can be studied by statistical means. One may use classical statistical methods like hypothesis testing (Pijpers Reference Pijpers2014, Reference Pijpers2015a,b,c, Reference Pijpers2016a,b,c) or perform investigations along Bayesian lines (Nepveu et al., Reference Nepveu, van Thienen-Visser and Sijacic2016; see Gregory, Reference Gregory2010, for a clear exposition of the differences). Although the methods use different interpretations of the concept of probability, the results agree. In this section we first describe the results obtained by using Bayesian methods and then move on to classical statistics. Both methods use the induced seismicity catalogue of the Groningen field which can be obtained from the KNMI (Royal Dutch Meteorological Institute) (www.knmi.nl).
Bayesian statistics on rates of seismic events
The dataset to be analysed consists of dates and locations of seismic events since December 1991, together with their magnitudes. Only events of magnitude larger than or equal to 1.0 are taken into account. This magnitude is chosen because it maximizes the number of events included, while also representing, within the uncertainty range, the magnitude of completeness (TNO, 2016). Furthermore, the catalogue of seismic data is declustered, meaning that all possible pre- and post-shocks are excluded. We used the method of Reasenberg (Reference Reasenberg1985) in our investigations. From the Groningen catalogue very few events are eliminated. For the limitations and caveats for declustering in general we refer to van Stiphout et al. (Reference van Stiphout, Zhuang and Marsan2012). In any case, declustering makes seismic events independent, allowing us to use the statistics of Poisson processes to describe their probability of occurrence.
The number of events occurring within the contour of the Groningen gas field per year since 1991 is shown in Figure 1.
Number of events occurring within the contour of the Groningen gas field as a function of time and magnitude (M L) up to 15 November 2016.
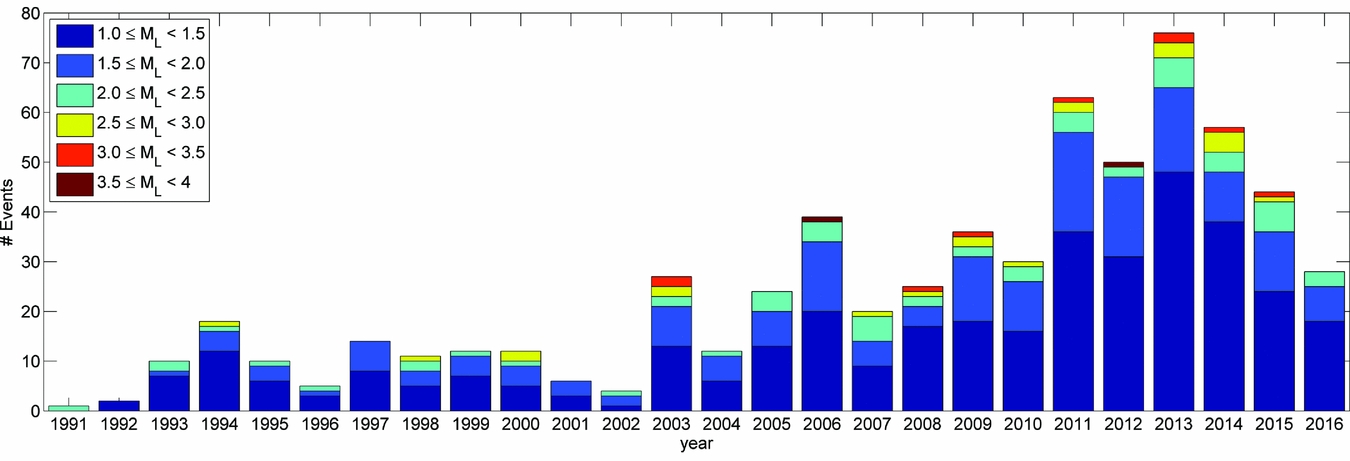
The question we want to address in this section is whether the rate of events changes with time. Furthermore, we want to investigate whether the reduction of the production since January 2014 diminished the seismic event rate. From Figure 1 we observe an increase in the number of events as time progresses, from a more or less constant level of 9 events with a magnitude larger than 1.0 per year up to 2003 to an increasing level of 20–70 events per year after 2003.
A full discussion of the Bayesian methods used is beyond the scope of this contribution. We have used two Bayesian methods: the Bayesian change-point model and the Bayesian model comparison. The Bayesian change-point method (Raftery & Akman Reference Raftery and Akman1986; Gupta & Baker Reference Gupta and Baker2015) assumes that there is one change point in the total interval between two different constant rates. The seismicity in the Groningen field may not be characterized by two different but constant event rates (Fig. 1). Therefore, to check the hypothesis of an increasing event rate, we perform the Bayesian change-point analysis for different time intervals. We expect to find multiple change points, indicating an overall increasing event rate.
Additionally we use another Bayesian model comparison method. This method compares constant-rate Poisson models and exponential-rate Poisson models after 1 January 2003. These models are characterized by a Poisson rate that is itself exponential, r(t) = a exp(±t/τ). The change-point method and the model comparison method are complementary. The change-point method derives a probability density for the change-point location and calculates the most probable event rates in the periods before and after the change point, while the model comparison uses a more realistic (non-stationary) rate change model (the so-called intensity which changes exponentially) after a chosen date.
A key concept within the Bayesian methodology is the so-called Bayes factor. This is the quotient of the likelihoods of the data given the two models, given the data, and the background knowledge and assumptions used in each hypothesis. For the posterior odds of model 1 over model 2 the following formula holds:
 $$\begin{equation*}
\frac{{P\left( {H1{\rm{|}}D,I} \right)}}{{P\left( {H2{\rm{|}}D,I} \right)}} {=} \frac{{L\left( {D{\rm{|}}H1,I} \right)}}{{L\left( {D{\rm{|}}H2,I} \right)}}\frac{{p\left( {H1|I} \right)}}{{p\left( {H2|I} \right)}} {=} {\rm{\ Bayes\ factor\ }} {\times} {\rm{\ prior\ odds}}
\end{equation*}$$
$$\begin{equation*}
\frac{{P\left( {H1{\rm{|}}D,I} \right)}}{{P\left( {H2{\rm{|}}D,I} \right)}} {=} \frac{{L\left( {D{\rm{|}}H1,I} \right)}}{{L\left( {D{\rm{|}}H2,I} \right)}}\frac{{p\left( {H1|I} \right)}}{{p\left( {H2|I} \right)}} {=} {\rm{\ Bayes\ factor\ }} {\times} {\rm{\ prior\ odds}}
\end{equation*}$$
The L’s represent the likelihoods, the p’s the a priori plausibilities for the hypotheses. All quantities to the right of the vertical bars depict the information used to compute the P’s resp. L’s and p’s. Unless prior information indicates otherwise – perhaps the outcome of investigations with other data – it is sensible to choose the quotient of the priors equal. That was assumed in the work described here. The posterior odds of the models then equal the Bayes factor. A complication is the presence of unknown/vaguely known variables within the hypotheses. When computing the likelihoods, these quantities must be integrated out of the problem by a process known as marginalization. This process depends on prior knowledge of these variables. In the constant rate models we have one such a parameter, namely the rate itself; in the exponential-rate models we have two, a and τ introduced above. For details on the priors used and the mathematical working we refer to Nepveu et al. (Reference Nepveu, van Thienen-Visser and Sijacic2016). It is customary to consider Bayes factors of order 100 (or 0.01) as decisive evidence for one or the other model.
Results of Bayesian analyses
Due to the probably increasing event rate, the Bayesian change-point analysis is performed for different time intervals (T 0–T 12). Since this change-point analysis comprises comparison between a model with two different constant rates versus a constant-rate model, if we suspect that the rate changes with the time, it is necessary to perform analysis for different time intervals. The identified change point for each time interval is presented in Table 1, as well as the pre- and post-change-point event rate and the Bayes factor of the change point. The Bayes factor determines the odds of the change-point model above a constant rate model. The time intervals (T 9–T 12) represent one time interval which is evolving with time: starting at 15 November 2012 and ending at the current time of the analysis. We started this work in September 2015, and the last update was done on 15 November 2016.
Overview of investigated time intervals and resulting change points in event rate occurrences (for all magnitudes M ≥ 1). The Bayes factor determines the odds of change point model above constant rate model. The time intervals in red (T9–T12) represent one time interval which is evolving with time: starting at 15 November 2012 and ending at the current time of the analysis. We started this work in September 2015, and the last update was done on 15 November 2016.

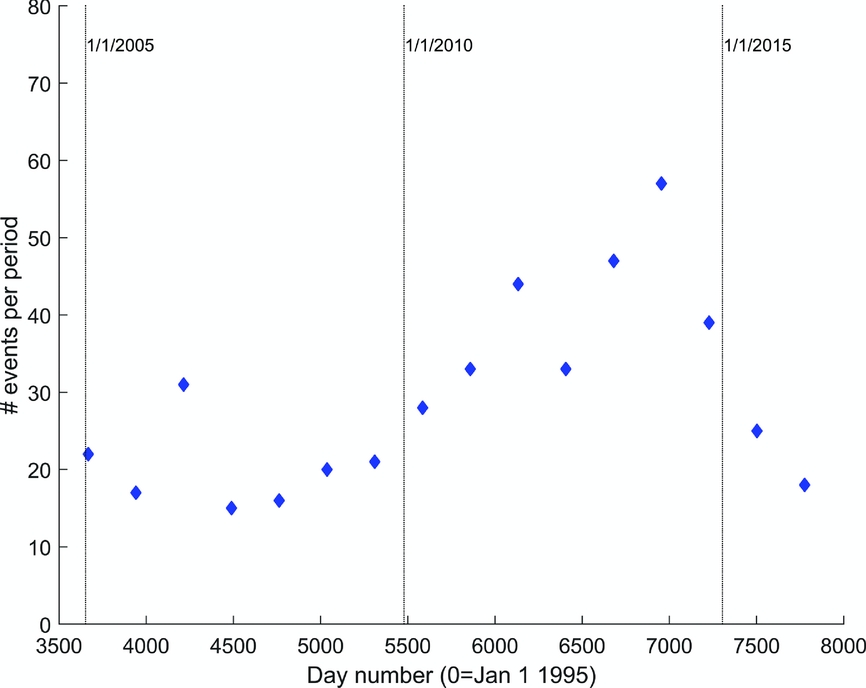
In Figure 2, the results of this Bayesian change-point analysis for all time intervals from Table 1 are summarized. As an example, two points (event rates) in Figure 2 coming from the first time interval T 0 are explained in more detail. Thus, Bayesian change-point analysis is first performed for time interval T 0. As a result, a point in time when the event rate changes is found, as well as the most probable event rate before and after that time. The time interval [0,T 0] consists then from two sub-intervals [0,T CP] and [T CP,T 0], where T CP is the time of change point. At the centre of each time (sub-)interval the most likely (in Bayesian terms) event rate is indicated. In this way 20 event rates are obtained (since there are, out of 26 sub-intervals in Table 1, 20 different intervals). The exponential fits through these 20 event rates in Figure 2 are meant as an illustration to indicate a clearly increasing event rate at the beginning of the investigated time leading up to a maximum in 2013. After 2013 the event rate rapidly decreases. The change point identified in May 2014 for the time intervals T 5, T 10, T 11 and T 12 (Table 1) represents the first time in the dataset that the event rate after the change point is lower than the event rate before the change point. The significance of this change point increases if the analysed time interval is longer. For the time interval up to September 2015 (T 5) the Bayes factor was just 15; for the time intervals up to March 2016, September 2016 and November 2016 it increased to 200, 1600 and 1700 respectively. The identified change point and pre- and post-event rates thus become more scientifically meaningful as time progresses. The event rate before the change point in May 2014 is around 73 events per year, and after the change point it is about 44 events per year, dropping to 39 as the time interval lengthens (T 5, T 10, T 11 and T 12). As production has been diminished significantly since January 2014 this may indicate that the number of seismic events diminishes accordingly. We will come back to the issue of causality later.
Event (M L ≥ 1.0) rate change with time for the entire Groningen field. The solid lines are the exponential fits through the data before and after 2013.

As discussed, the change-point model might not be the most logical choice due to the increasing event rate after 2003. Therefore we also perform a model comparison which compares a stationary rate model to an exponentially increasing or decreasing event rate model. Large Bayes factors indicate that a non-stationary event rate is preferred; small Bayes factors indicate stationary event rates are preferred. We apply the model comparison to three different areas in the Groningen gas field starting from the data since the beginning of an upward trend in the seismic event rates: the central area, comprising the area affected by the production reduction of January 2014, the southwest area, an area with large production in 2014, and the rest of the field (called ‘other’). The central area is represented by the blue ellipse in Figure 3, and the southwest area by the black ellipse.
Groningen field contours are given by the red line. The blue ellipse gives the contours of the central area, and in black the contours of the southwest area are presented. The black lines are the faults present in the geological Petrel model (NAM, 2013 ) while dots show the seismicity in the field. The size of the dots indicates the magnitude of the events. The background colour is the cumulative compaction (m), obtained through inversion of subsidence measurements as described in TNO ( 2013 , 2014 b, Reference Pijpers2015a). The orange and blue triangles represent producing well clusters. The orange triangles, specifically, are five clusters in the central area where production has been cut off since January 2014.

Applying the model comparison (increase-rate models vs stationary-rate models) to the period after 2003 we obtain strongly corroborated upward trends as expressed by (very) large Bayes factors. This is shown in Table 2, where we show Bayes factors and number of events with M ≥ 1 between 1 January 2003 and 17 January 2014 in the three areas. Additionally, the model comparison yields information on the time constants of the exponential rates after 2003 for the three areas of the Groningen field. We find a time constant of 7–10 years. The change-point analysis had already prepared us for such a result.
Number of events with M ≥ 1 between 1 January 2003 and 17 January 2014 in the three areas of the Groningen field and Bayes factors for exponential increase-rate models vs stationary-rate models.

The date of 17 January 2014 is of special interest as at this specific date gas production was reduced at five clusters (PAU, POS, LRM, OVS and ZND) located in the centre of the Groningen gas field. If the occurrence of seismicity is linked to production in the reservoir (NAM, 2013; TNO, 2013), reduced production might lead to a reduction in the observed seismicity over the field as has already been statistically observed.
At the very least, one should expect that the exponential trend in event rates diminishes after 2014 in the centre. In order to observe an effect of the production reduction on the number of seismic events in the field, one must take into account that the pressure waves in the gas phase associated with the abrupt production cutback should have reached the places where seismic events are occurring (at the fault systems). Thus, at any given time one should only take into account those parts of the area that were actually reached by the pressure waves from the locations where production was diminished.
Now we are interested in the Bayes factors of exponential rate decrease models versus constant rate models in the adapted central area, the original southwest area and the remaining part of the Groningen field (‘other’). The Bayes factors of exponential decrease Poisson models vs stationary-rate Poisson models, regarding the situation of 16 November 2016, are shown in Table 3.
Number of events with M L ≥ 1.0 between 17 January 2014 and 15 November 2016 in the three areas of the Groningen field, and Bayes factors for exponential decline models vs stationary-rate models.

The results indicate that the exponential increase that was prominent in the period 2003–14 has apparently stopped in all areas of the gas field as the decrease model is favoured over the constant rate model in all three areas. However, that a declining rate model is better than a stationary-rate model is compelling only for the southwest area, but for the other areas one should await more data before decisive judgment can be passed. It is difficult to provide decisive judgment (requiring Bayes factors larger than 100) with only a limited number of events since 2014 (see Table 3). The relatively large Bayes factor for the region relates to the fact that almost 80% of events with M ≥ 1 took place in the first half of the interval under scrutiny. Overall production was further reduced in December 2014, and more specifically the southwest, which may have affected the number of events in the southwest area as well.
Hypothesis testing
A classical statistics approach to assess the influence of changes in gas production on earthquakes is to test a range of hypotheses for validity. The issue is that the process generating earthquakes exceeding a certain magnitude, while being a Poissonian process, is not likely to be stationary. The process can be modelled as inhomogeneous and Poissonian if the possibility of the generation of aftershocks is ignored, and if the change in the time parameter of the process is very slow. A separation of timescales might then allow modelling as a combination of Poisson processes with different time parameters.
If the quakes were due to a stationary stochastic process this would imply that if the dataset were to be divided into subsets that are of equal length in time, the number of quakes in each subset should not show any significant difference. To test the assumption, the dataset is divided into 16 sections of equal length in time, and the number of quakes with magnitudes greater than 1.0 is counted (Fig. 4; Pijpers, Reference Pijpers2016b).
Number of events with magnitude larger than or equal to 1.0 per time period.
It is clear from this analysis that the number of events increases with time, except in the most recent time periods (from January 2014), so the underlying process cannot be a stationary Poisson process.
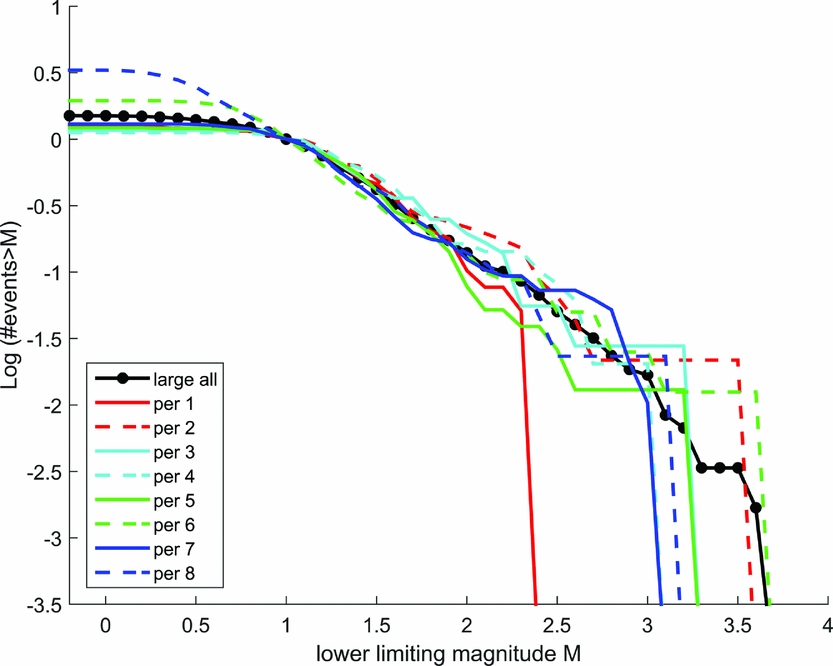
For a more detailed analysis of the behaviour with time, the dataset is divided into eight equal-length sections, and the logarithmic cumulative distribution function (cdf, i.e., the Gutenberg–Richter distribution) is determined separately for each subset. After normalization, the influence of the improved sensitivity of the seismometer network which came on stream at the end of 2014 can be seen in the shape of the Gutenberg–Richter distribution function at magnitudes around and below 1.0 (Pijpers, Reference Pijpers2016b).
Subdividing the dataset into a larger or smaller number of time subsets has also been tested, which confirms that this behaviour does not depend on the precise boundaries between the time divisions or the number of time divisions used (Pijpers Reference Pijpers2014, Reference Pijpers2015a,b, Reference Pijpers2016a,b).
In the absence of using a known statistical distribution function to derive confidence margins, it is possible to use the dataset itself to test various hypotheses. This is done using a technique referred to in the literature as bootstrapping or Monte Carlo simulation. Extensive descriptions and applications of this technique can be found in textbooks, e.g. Numerical Recipes (Press et al., Reference Press, Teukolsky, Vetterling and Flannery1997).
In essence the earthquake catalogue itself is used to draw synthetic events from. Each synthetic event is assigned to an epoch either before or after a cut-off date, and to one of four distinct spatial regions according to a probability distribution which belongs to a given hypothesis. In this aspect the procedure is a Monte Carlo simulation. The magnitudes of the events are kept as they are reported in the catalogue. This creates a synthetic dataset with the same number of events as the true data and the same overall Gutenberg–Richter distribution. In this respect the procedure is more like a bootstrapping procedure because no model is used to provide relative likelihoods of earthquakes of different magnitudes. By repeating this process many times it is possible to obtain statistical measures for the variation between these synthetic datasets, which is then used to establish confidence limits. Any given hypothesis has consequently given likelihoods for events to occur which, together with the obtained confidence limits, can then be rejected (or not) when compared with the real data.
In the reports of Pijpers (Reference Pijpers2014, Reference Pijpers2015a,b, Reference Pijpers2016a,b) this technique is applied to test a number of separate hypotheses, with increasing levels of variation of event probability:
-
I. The events are distributed homogeneously in space and are stationary in time.
-
II. The events are not distributed homogeneously in space, but they are stationary in time.
-
III. The events are not distributed homogeneously in space, and the rate increases exponentially in time, with a doubling time of 5.5 years.
-
IV. The events are not distributed homogeneously in space, and the rate increases in time with a varying time dependence.
-
V. The events are not distributed homogeneously in space, and the rate increases exponentially in time except that, for one or more areas of interest, this increase ceases at a certain date, after which the rate remains constant or drops.
In all five hypotheses the same spatial and temporal divisions, or ‘areas of interest’, are used, which are preselected. It can be argued that such preselection reduces the uncertainty margins compared to a procedure where such selection is not pre-decided but incorporated in the simulation in some form. However, in this case the decision on the choice of spatial boundaries was primarily based on having easily parameterisable contours (hence ellipses), the largest of which is chosen to roughly cover the area of the reservoir map outlined by the red contour in Figure 5. The smaller regions within that are intended to cover distinct fault structures and are parts of the reservoir drained primarily by different sets of gas production clusters. The cut-off date was also chosen on the basis of when a significant production reduction was applied. Knowledge of the spatial distribution of the earthquake data was at most a weak influence in the decision on where to put the boundaries, so it is unlikely that this substantially affects the results.
Gutenberg–Richter distribution function for eight subsequent time intervals of equal-duration catalogue data subsets.
In each of the reports of Pijpers (Reference Pijpers2014, Reference Pijpers2015a,b, Reference Pijpers2016a,b) these hypotheses, with minor variations, are tested using the updated earthquake catalogue where each subsequent report uses an additional half-year of data collected by KNMI. The influence of the potential presence of aftershocks and of the lower cut-off in earthquake magnitude applied are also explored. In all cases, hypotheses I–IV are robustly rejected. Even as early as late 2014, there is evidence that the reduction in gas production in part of the Groningen field appears to have affected the local event rate (decreasing or constant rates instead of increasing rates), and the later analyses with more data available confirm this.
Effect of production fluctuations on induced seismicity
Generally speaking, one expects a delay between production changes and seismicity. Production changes could occur anywhere in the field, but seismicity will be initiated by existing faults. Hence it will take some time before the pressure waves associated with the production changes cause stress changes on the faults that (may) induce seismic events.
In Figure 6 we plot yearly production and total number of events per year, both using a moving average of 1 year shifted monthly. Three different values are tested for the delay between production and number of events: 4, 8 and 6 months for the period 1997–2016. Seismicity is included from ML ≥ 1.0 and shown in a stacked histogram where the colours indicate magnitudes. It is clear from the figure that from about 2002/03 production changes are followed by changes in seismicity with a delay of about 6 months; before that time such a relationship is not as clear. The precise delay between production changes and seismicity changes depends on the wells which experienced the production change and the distance to the faults responsible for the events. Therefore, throughout the years, depending on production scenarios of various clusters and their distance to critical faults, the precise time delay differs (on average it is somewhere between 4 and 8 months). Note that Figure 6 does not account for spatial distribution of the number of events nor of the production fluctuations.
Relationship between production (dashed line) and seismicity using a delay time of (A) 4, (B) 6 and (C) 8 months for the seismicity.

From 17 January 2014, production was reduced in the centre of the field. This area is close to the main active fault system in the field. Figure 6A shows, not surprisingly then, that a reduction in seismicity follows the reduction of production with a smaller delay of about 4 months.
The reader should notice that in the period before 2000 the production and the number of events do not ‘follow’ each other as in the period since 2002/2003. This might be a qualitative indication that the field has changed its overall characteristics somewhere in that period. It may indicate that the faults in the Groningen field have become more active since 2002/2003. In the Self Organized Criticality (SOC) theory (Bak & Tang, Reference Bak and Tang1989; Main et al., Reference Main, O'Brien and Henderson2000) this may indicate a higher ‘temperature’ of the system indicating a state of criticality in most of the field since 2002/2003.
Correlation study: seasonal relationship between production and seismicity
If seismicity and production are related, such a relation can be fruitfully investigated by constructing the relevant autocorrelation and cross-correlation functions. We analyse the years after 2002/2003 when the Groningen field showed a marked increase in seismicity.
The autocorrelation function of the production changes on a monthly basis shows the seasonal trend convincingly (Fig. 7). This trend is obviously related to the different demands for gas over the summer and winter seasons.
Autocorrelation of the production on a monthly basis.

The cross-correlation functions for the production changes and seismic events, both on a monthly basis, were constructed for each of the years 2003–2012 and then stacked. This was done for different ranges of magnitude. The results are shown in Figure 8A and B. The same approach was applied in full between the full seismic catalogue (source: KNMI) and a declustered version of the seismic catalogue. In both cases we see a typical delay of 5–7 months. We also note that these findings hold if we make a distinction in cross-correlations limited to magnitudes ≥1 and limited to ≥1.5. This result is not surprising if we assume Poisson statistics, because the Poisson intensities for events above different threshold magnitudes are proportional to one another (Nepveu et al., Reference Nepveu, van Thienen-Visser and Sijacic2016).
The stacked correlation in 2012 (from 2003 to 2012) between production on a monthly basis and the number of seismic events for all magnitudes, for magnitudes larger than M L ≥ 1.0 and for M L > 1.5, (A) for the full seismic catalogue (source: KNMI) and (B) for the declustered seismic catalogue.

Precursor pressure in the Fourier domain
The production rate varies throughout the year, as well as incidentally for operational reasons. It thus becomes possible to pursue a correlation analysis between variations in event incidence and production variations, which also takes into account that there will be a delay time for the signal of a production variation to propagate through the area.
If such a correlation exists, it should be seen most clearly by investigating the reservoir gas pressure at the location of events, in the months and weeks prior to each event. One way to pursue this is by using the gas production data as a function of time for each production cluster, which are at various locations spread out over the field, and propagate the ‘signal’ of production variations through the reservoir. To do this, a simplified diffusive model is applied which, in essence, is one-dimensional (Pijpers, Reference Pijpers2015c). Another way is to use a 3D model of the reservoir gas pressure, which takes more detailed account of its geological structure (i.e. local diffusivities). Such a model exists which is calibrated and validated by regular measurements of the pressure at a number of reservoir locations. This dynamic model was obtained from the operator (NAM) and used as an input for the analysis of Pijpers (Reference Pijpers2016c).
In both reports (Pijpers Reference Pijpers2015c, Reference Pijpers2016c) the gas pressure as a function of time prior to the events is determined. These are ‘co-added’ for all events, which means that a time offset/shift is applied such that the moment of each event occurring is set to t = 0. After this shifting in time the precursor pressures, i.e. the time series leading up to the time of event, are averaged for all events. In order to determine whether or not event times and locations are special, the same process is repeated for a set of synthetic reference ‘events’. The reference events are times and locations not associated with any real event. This set of synthetic times and locations do share some of the statistical properties of the times and locations of the real events. The timing is generated at random using a uniform distribution within 18-month windows. The number of events in each of these windows is constrained to match the measured number of events in that window. Similarly the location is chosen at random with a uniform distribution within 2.5 × 2.5 km grid squares, but the total number in each of these squares is constrained to be equal to the measured number in that grid square. The typical positioning uncertainty of earthquakes is reported to be around 500 m, so the spatial randomization should be sufficient for the purpose of creating the synthetic dataset. Comparison of these histories, for instance by taking the ratio of the two time series, determines whether and how the pressure before a real event (time, location) differs statistically from that before a ‘synthetic reference event’ (time, location) used as a baseline. Figure 9a show the time series of this ratio, i.e. P real/P baseline, sampled weekly. From the individual time series (not shown here) the pressure average series for the real events show more variation than that of the synthetic events: the oscillating behaviour in the ratio series of Figure 9A originates from the real data, not the baseline.
The ratio of the averaged pressure in the time leading up to earthquakes and the averaged pressure in the time leading up to synthetic events is weakly sampled (A) and is Fourier-transformed (B). The amplitude of the complex-valued Fourier transform is shown as a function of the period of variation. A strong peak at a period of 52 weeks is clearly identified.
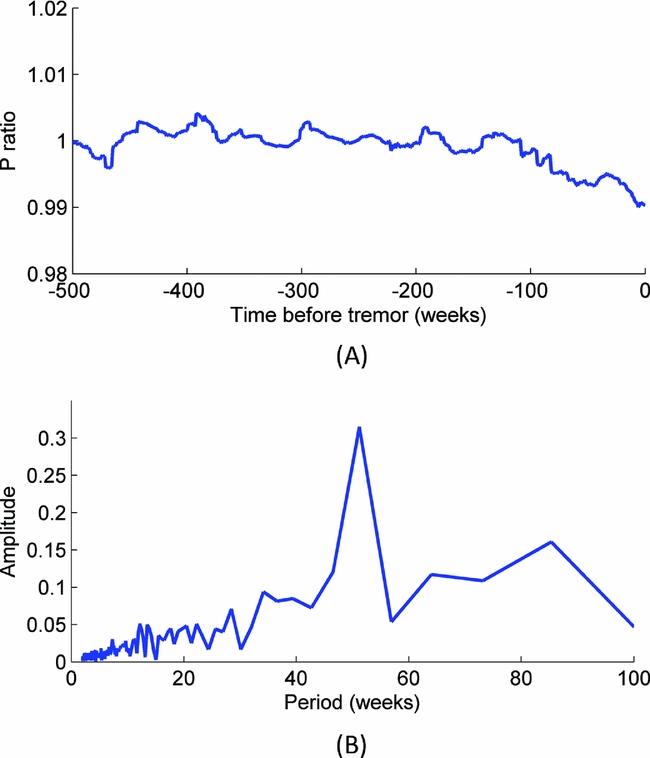
A Fourier transform of this pressure ratio of Figure 9A is shown in Figure 9B, which clearly shows that there is a modulation with a period of precisely 1 year.
Given the annual variation of gas production due to the difference in demand between summer and winter, gas pressure anywhere inside the reservoir also has this 1-year modulation. However, for a given set of time shifts and locations, one would expect an average of pressure with time to show little modulation, as is indeed the case for the synthetic dataset of ‘reference events’. For the real event times and locations, the gas pressure variations clearly line up so that the annual modulation is not averaged away. The implication is that while pressure variations occur everywhere in the reservoir, there are particular locations within it that have a higher likelihood of being triggered to generate an event and appear to have a further increased likelihood of doing so at a particular phase of the pressure variations when these variations occur, i.e. an increase in production rate/increase in pressure reduction rate.
Discussion and conclusion
We have investigated the seismic events of the Groningen field using two techniques: classical statistics and Bayesian statistics. We focus on the effect of the production reduction and the effect of production fluctuations on the induced seismicity of the field.
In both methodologies we obtain a clear relationship between production and seismicity. After a phase in which seismic event rates could be considered more or less constant, around 2000/2003 an exponential increase in event rates ensued. Well after 17 January 2014, when gas production was cut back at five production clusters, we find a situation in which the event rates either decline or remain constant. Both classical hypothesis testing and Bayesian methods agree that the upward exponential trend visible before 2013 is not continued.
Gas production in Groningen experiences a yearly swing reflecting a change in gas demand between the summer and winter months. In the stacked yearly correlations from 2003 to 2012 the yearly swing in gas production is found back in the outburst of events some 4–8 months later. In the Fourier domain it was shown that local increases/decreases of pressure rates may lead to more seismic events. Both analyses indicate a direct relationship between production and seismicity.
The question is, does the relationship between production and seismicity prove causality between gas production and the occurrence of seismic events? As a matter of philosophical strictness causality can never be proved, but it can certainly be made plausible in some cases. That generally depends on two matters. First one should be able to come up with a physical mechanism linking the presumed cause and effect, preferably allowing ‘hard’ predictions; secondly, one should observe such predictions within a certain bandwidth of uncertainty. In the present case, the induced stresses at the faults by the subsidence of geological layers due to fluid extraction are a convincing driving force, even though really predicting seismic events is beyond our reach. Nevertheless, we have a significant correlation between gas production and the seismic events. Without any connection between the two phenomena this would be an utterly baffling phenomenon. (See also, for comparable cases, McClure et al. (Reference McClure, Gibson, Chiu and Ranganath2017).)
This was not always the case in the Groningen field. Before 2003 the field seems to have reacted differently to production changes. A possible reason for this is that faults in the Groningen field were likely not critically stressed (van Wees et al., Reference van Wees, Buijze, van Thienen-Visser, Nepveu, Wassing and Orlic2014) at the start of production. After significant production had taken place the first events occurred. The state of stress on the faults was, in this first period, likely not critical for large sections of the faults. From 2003 the number of events increased rapidly, indicating that critical patches of faults were overall more present and able to generate larger events due to the line-up of critical patches (van Wees et al., Reference van Wees, Buijze, van Thienen-Visser, Nepveu, Wassing and Orlic2014). We might argue that a certain stress build-up on the faults was necessary to obtain a direct relationship between production and seismicity. This threshold is seen in SOC, as proposed in a more general setting by Bak & Tang (Reference Bak and Tang1989). Understanding the particular mechanism is important, in order to engineer changes to the production of the field so as to minimize the expected seismicity. Unfortunately, a general theoretical approach for studying SOC, like the canonical ensemble approaches in statistical physics, is not available at present for the situation in Groningen.
Acknowledgements
The authors wish to thank Annemarie Muntendam-Bos, Hans de Waal and Hans Roest from SodM, and Jaap Breunese from TNO for stimulating discussions. We are also grateful to Prof. J.W. Baker from Stanford University for the use of Bayesian change-point analysis. We also thank Mark McClure and an anonymous reviewer for their perceptive comments.


 Open access