

Introduction
Ferguson et al. define skin scars as a ‘macroscopic disturbance of the normal structure and function of the skin architecture, resulting from the end product of a healed wound’.Reference Ferguson, Whitby, Shah, Armstrong, Siebert and Michael 1 A dermal injury secondary to trauma or surgery results in a phase of wound healing, involving an inflammatory response, resolution and repair, leading to asymptomatic scars or problematic scarring. The type of scarring in adults is therefore variable. Brown et al. have proposed genetic susceptibility and a strong immunogenic component to dermal fibrosis.Reference Brown, McKenna, Siddhi, McGrouther and Bayat 2 They suggest that specific major histocompatibility complex alleles are implicated in a genetic susceptibility to raised dermal scarring, together with involvement of environmental factors.Reference Brown, McKenna, Siddhi, McGrouther and Bayat 2
Research on thyroidectomy scar assessment is underway.Reference O'Connell, Diamond, Seikaly and Harris 3 – Reference Böhm, Minner, Engelhardt and Rödiger 5 However, despite the visible nature of these scars and their impact on patients, there remains a paucity of studies in this area. Patient satisfaction, furthermore, is an under-investigated component of scar assessment. There is a clinical equipoise to be met between patient satisfaction and expectation, as well as between patient and surgeon expectations. Clearly, the notion of satisfaction is complex, subjective and influenced by many factors.
One such factor that has not yet been investigated in thyroidectomy is body image. Slade defined body image as ‘the picture we have in our minds of the size, shape and form of our bodies, and to our feeling concerning these characteristics and our constituent body parts’.Reference Slade 6 The notion of dysmorphic concern (an over-concern with an imagined or slight defect in physical appearance)Reference Oosthuizen, Lambert and Castle 7 was first described as ‘dysmorphophobia’ in the psychiatric literature by Morselli in 1886.Reference Morselli 8 It was subsequently termed body dysmorphic disorder and retained as such in the Diagnostic and Statistical Manual of Mental Disorders, fourth edition, and is a distinct entity amidst body image disorders.
In contrast to patients undergoing cosmetic surgery, body image and body dysmorphic disorder have not yet been assessed in thyroidectomy patients. This study aimed to determine the impact of body image, life quality, scar age, patient age and scar length on scar perception utilising validated assessment tools in thyroidectomy patients attending a tertiary referral centre.
Materials and methods
A total of 123 patients were recruited in this cross-sectional prospective study. They were identified upon attending a post-operative thyroid clinic over a period of eight months. Only patients with conventional cervicotomy incisions were included in this analysis.
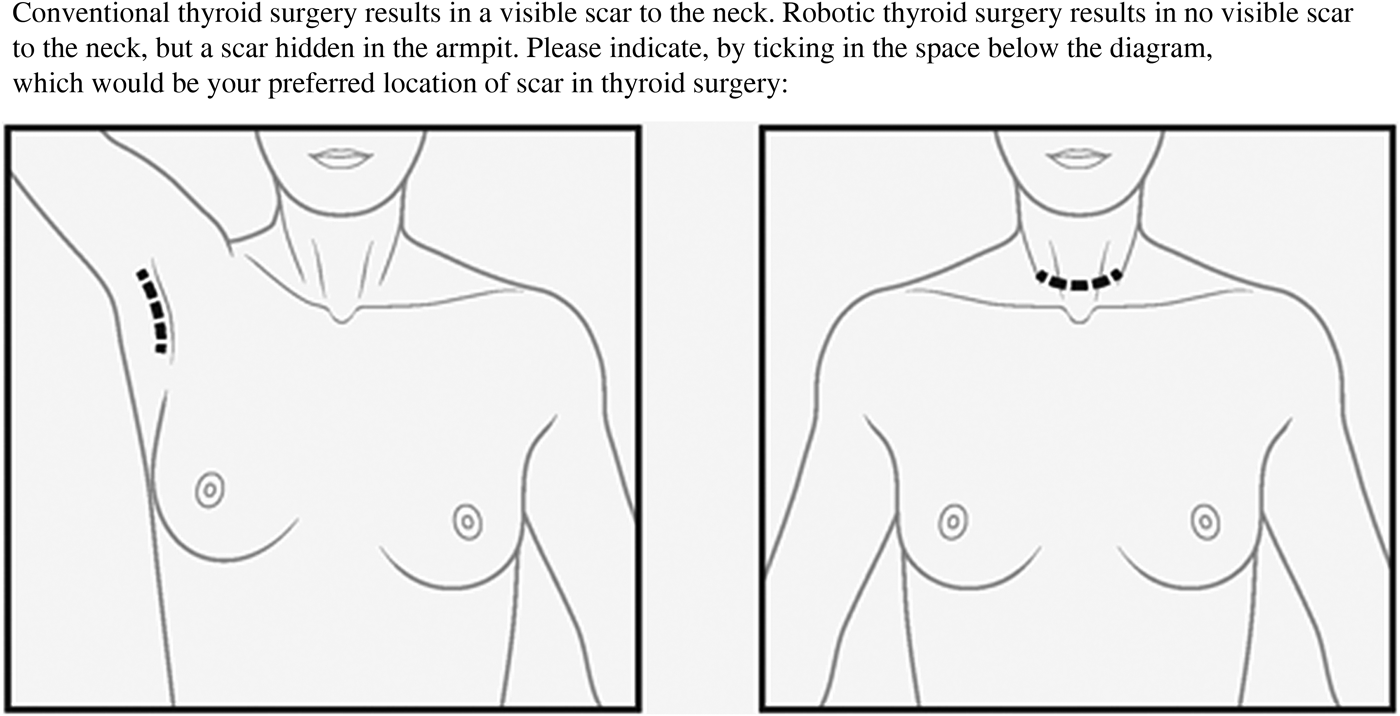
Patients were asked to complete a clinical questionnaire pack. This comprised assessments of: scarring, using patients’ self-scored Manchester Scar Scale; body image, using the Dysmorphic Concern Questionnaire and the Body Dysmorphic Concern Questionnaire; and life quality, using the EQ-5D. Further questions concerned: the size of the scar, general demographics and preference of scar location (Figure 1).
Diagrammatic representation of scar location (patients were asked to select scar site preference).
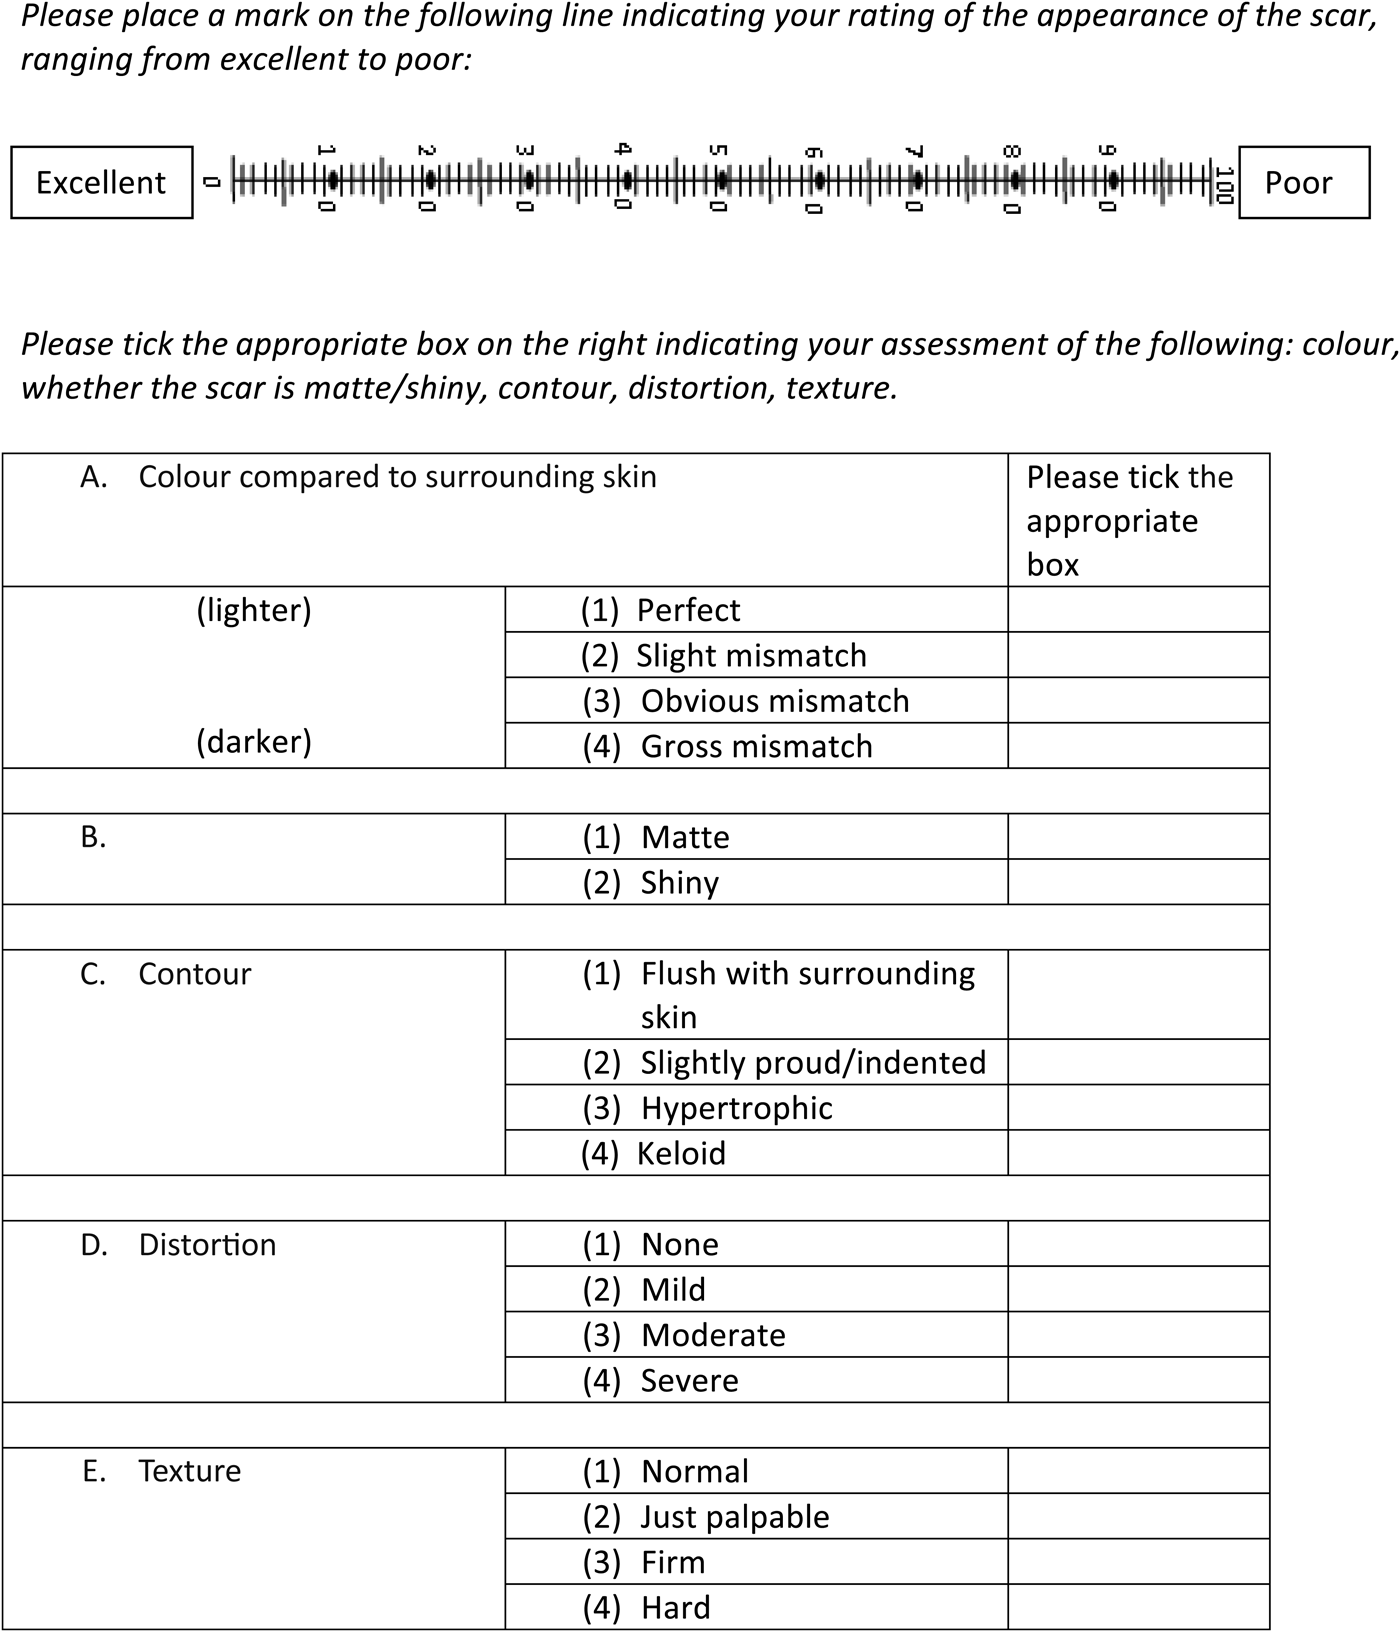
At the same clinic encounter, an observer (first author) rated the scar using the Manchester Scar Scale (Figure 2), and completed self-assessments of the same domains as patients, including life quality and body image.
Manchester Scar Scale Clinical Questionnaire.
Conventionally, use of the Manchester Scar Scale involves an observer rating a patient's scar. This study is the first of its kind to also ask the patient to self-report their scar perception using the Manchester Scar Scale. In order to facilitate patients in distinguishing between the terms ‘hypertrophic’ and ‘keloid’, standardised images of these types of scar were shown to patients when presented with the questionnaire. Patients were also allowed to ask questions if unclear on any aspects of nomenclature in the Manchester Scar Scale.
The Manchester Scar Scale itself consists of a visual analogue scale, and four additional domains assessing texture, whether the scar is matte or shiny, contour, and distortion, resulting in a total score of 28, with a higher number denoting a worse score.
The Dysmorphic Concern Questionnaire is a self-report instrument comprising seven body image questions, each with four possible responses to each question: ‘not at all’, ‘same as most people’, ‘more than most people’ and ‘much more than most people’. The final option has the highest score.Reference O'Connell, Diamond, Seikaly and Harris 3 The maximum total score is 21, with higher scores denoting greater dysmorphic concern (i.e. negative body image).
The Body Dysmorphic Concern Questionnaire is a screening tool designed specifically to determine whether patients have body dysmorphic disorder. It consists of two main ‘yes’ or ‘no’ questions: ‘Are you very concerned about the appearance of some parts of your body that you consider especially unattractive?’; and ‘Do these concerns preoccupy you? That is do you wish you could think about them less?’. If respondents answer ‘yes’ to either question, a series of further questions follow. A score of 4 is deemed positive for body dysmorphic disorder. The tool also includes a specific question that can identify patients as being negative for body dysmorphic disorder.
Patients also underwent standardised medical photography of their scars. A protocol was created with the Medical Illustrations Department at the Imperial College Healthcare NHS Trust, resulting in a series of standardised scar images: two lateral views and one anterior view displayed on a grid to enable comparison. This protocol was strictly adhered to for every scar photographed.
In addition to this, an ‘image panel assessment’ was conducted, similar to that used by Beausang et al. in their seminal study describing and validating the Manchester Scar Scale.Reference Beausang, Floyd, Dunn, Orton and Ferguson 9 For this, 15 patient scar photographs of differing severity were selected following modified Delphi consensus between authors. A panel comprising two groups assessed this selection of scars: senior otolaryngologists (expert group) and medical students (non-expert group), via the same viewing platform (a timed Microsoft PowerPoint® presentation viewed on a desktop computer). Scar perception was assessed using the Image Assessment Scale of the Manchester Scar Scale. This scale was created and validated during development of the final Manchester Scar Scale, and is specifically designed to assess scar photographs. In this version of the Manchester Scar Scale, the ‘texture’ component is omitted in light of it being a photographic assessment tool. Thus, the highest score attainable is 24 as opposed to 28. This image panel assessment was repeated one month later, to assess inter- and intra-rater reliability.
This study was approved by the National Health Service Health Research Authority National Research Ethics Service Committee of London – Camden and Islington. It also received local approval from the Imperial College Healthcare NHS Trust.
Statistical analysis
Data were analysed by a statistician using R® software, version 3.1.2. The data were non-parametric; hence, Spearman's rank was used to compare mean scar perception scores (Manchester Scar Scale score), with various parameters including scar age, scar length, life quality score and body image score. The Wilcoxon signed-rank test was used to compare clinician and patient scar perception scores.
Reliability within the image panel assessment was assessed using kappa co-efficient as our data were categorical, as suggested by Durani et al.Reference Durani, McGrouther and Ferguson 10 The Spearman rank correlation co-efficient was used to specifically assess inter-rater reliability.
Results
Owing to the cross-sectional nature of this study, a wide range of scar ages were obtained, ranging from 2 weeks to 333 months post-operation (mean, 33 months). When stratified into groups of early (less than one month post-operation), intermediate (two to nine months post-operation) and late (more than nine months post-operation), 36 per cent of scars were classified as early, 20 per cent as intermediate and 44 per cent as late.
Mean scar length was 59.7 mm, ranging between 34 mm and 110 mm. Sixteen participants were male and 107 were female. Patient age ranged between 27 and 69 years, with a mean age of 64 years. In terms of scar location, 68 patients chose an axillary incision and 55 opted for standard cervicotomy.
Scar age and scar perception
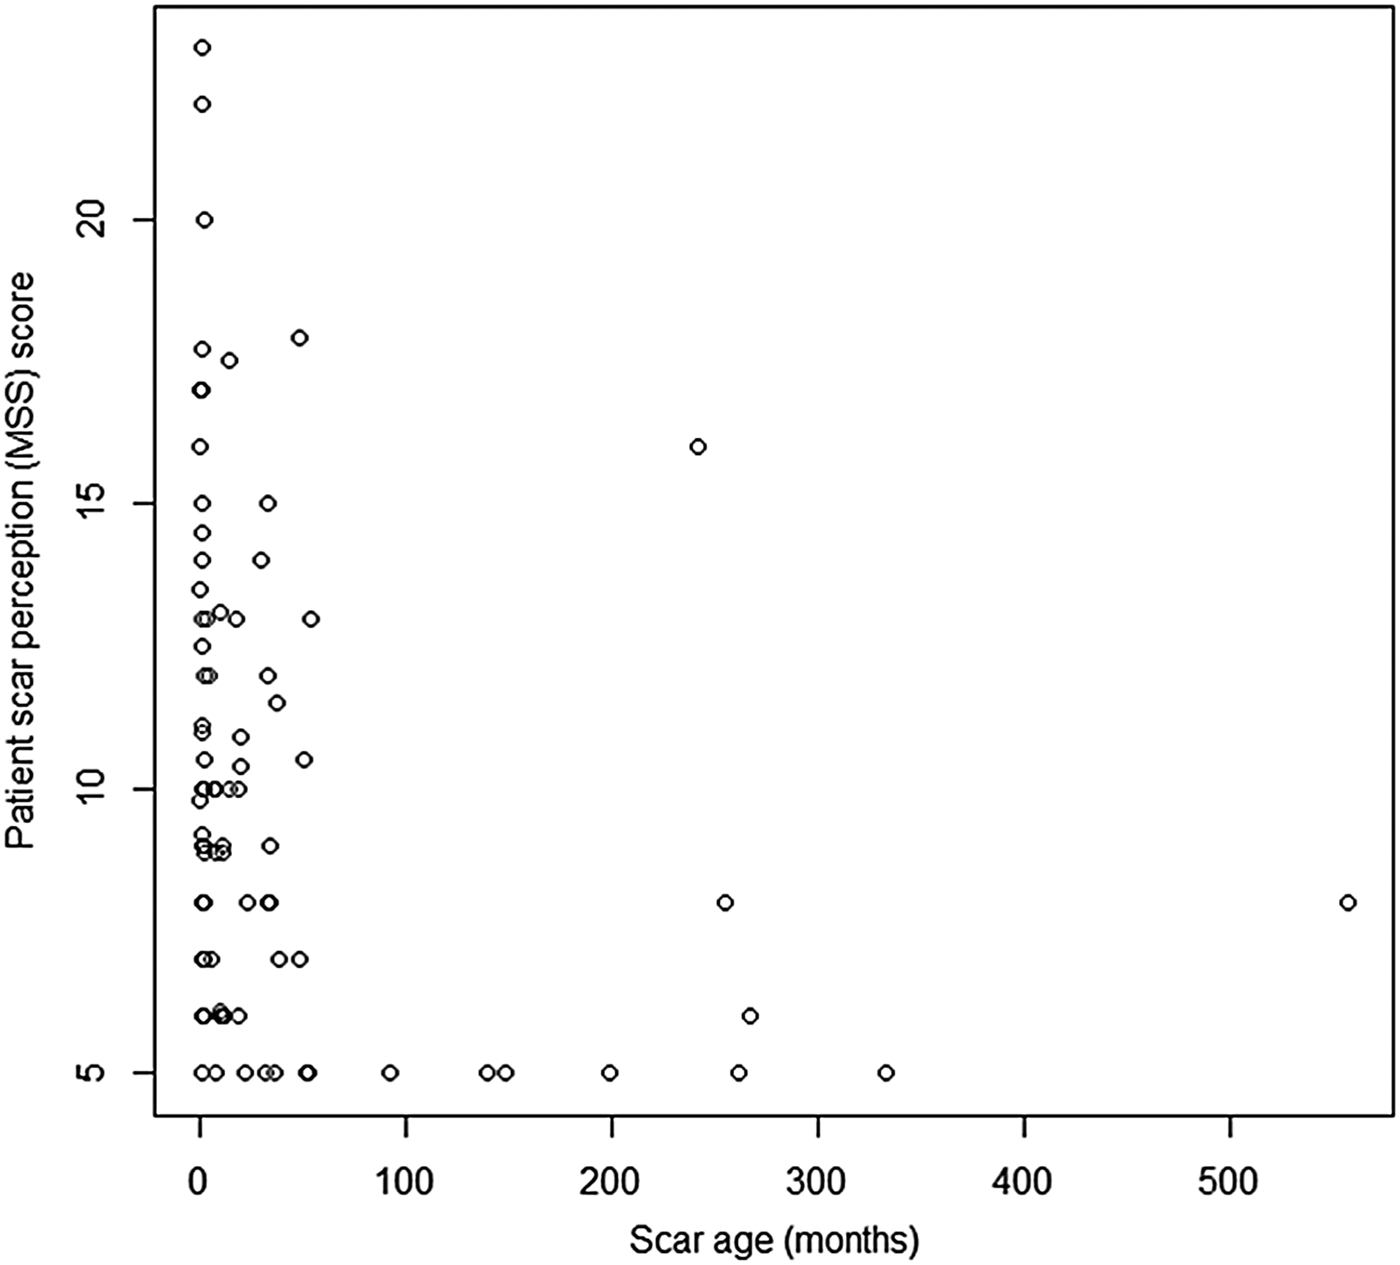
The Spearman rank correlation co-efficient for scar perception score (Manchester Scar Scale) and scar age was ρ = −0.526 (p < 0.05), demonstrating a statistically significant negative correlation, wherein scar perception improved as scar age increased (Figure 3).
Graph displaying patient scar perception score (Manchester Scar Scale (MSS)) and scar age in months. (Higher numbers on the y-axis denote a worse score.)
Scar length and scar perception
Scar length was not related to scar perception score, with values of ρ = 0.009 and p = 0.916 implying no significant correlation.
Patient age and scar perception
No significant relationship was found between patient age and patient scar perception (ρ = −0.029, p = 0.7).
Patient and clinician scar perception
When patient and clinician scar perception scores were compared, a statistically significant positive correlation was found (ρ = 0.766, p < 0.05) (Figure 4).
Graph displaying patient scar perception score and clinician scar perception score. (Higher numbers on the y-axis denote a worse score.)
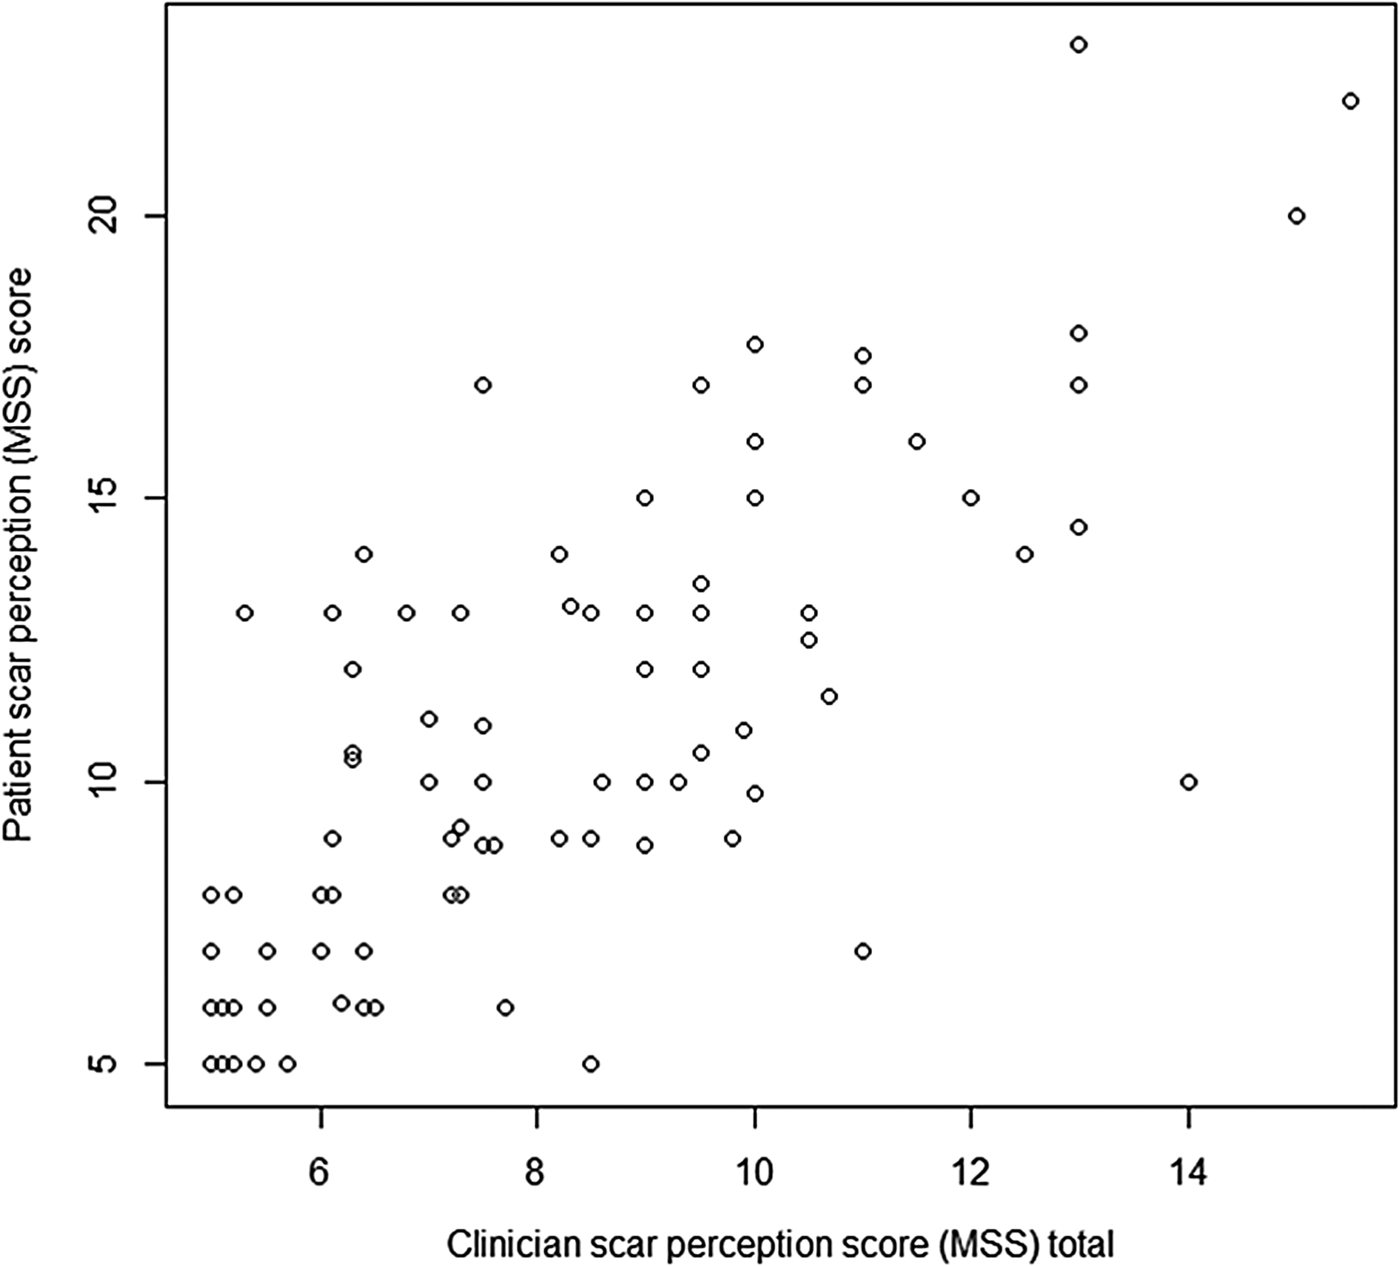
In addition, the mean Manchester Scar Scale score was 8.118 for clinicians compared to 10.808 for patients (p = 0.002), suggesting that patients rated their scars significantly worse compared to clinicians.
Life quality
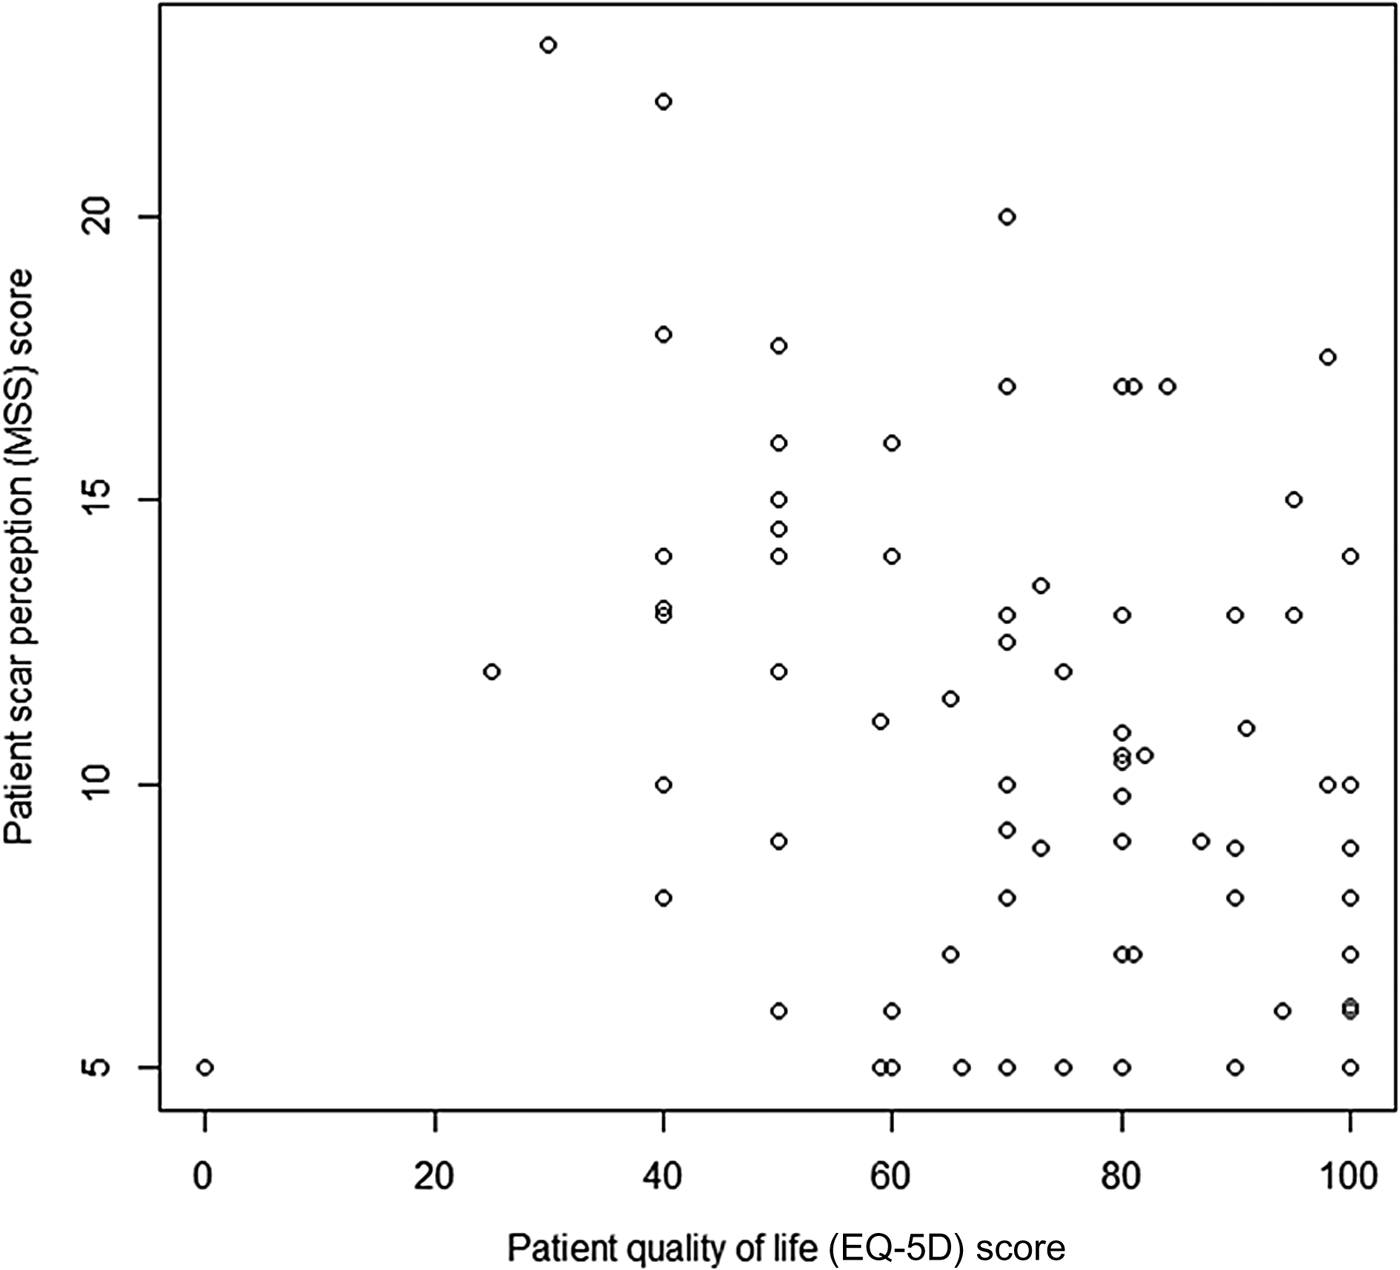
A statistically significant relationship between scar perception score and life quality (EQ-5D score) (Figure 5) was found, with values of ρ = −0.292 and p = 0.001 demonstrating that higher life quality scores correlated with better scar perception.
Graph displaying patient scar perception score (Manchester Scar Scale (MSS)) and life quality (EQ-5D). (Higher numbers on the y-axis denote a worse score.)
Body image
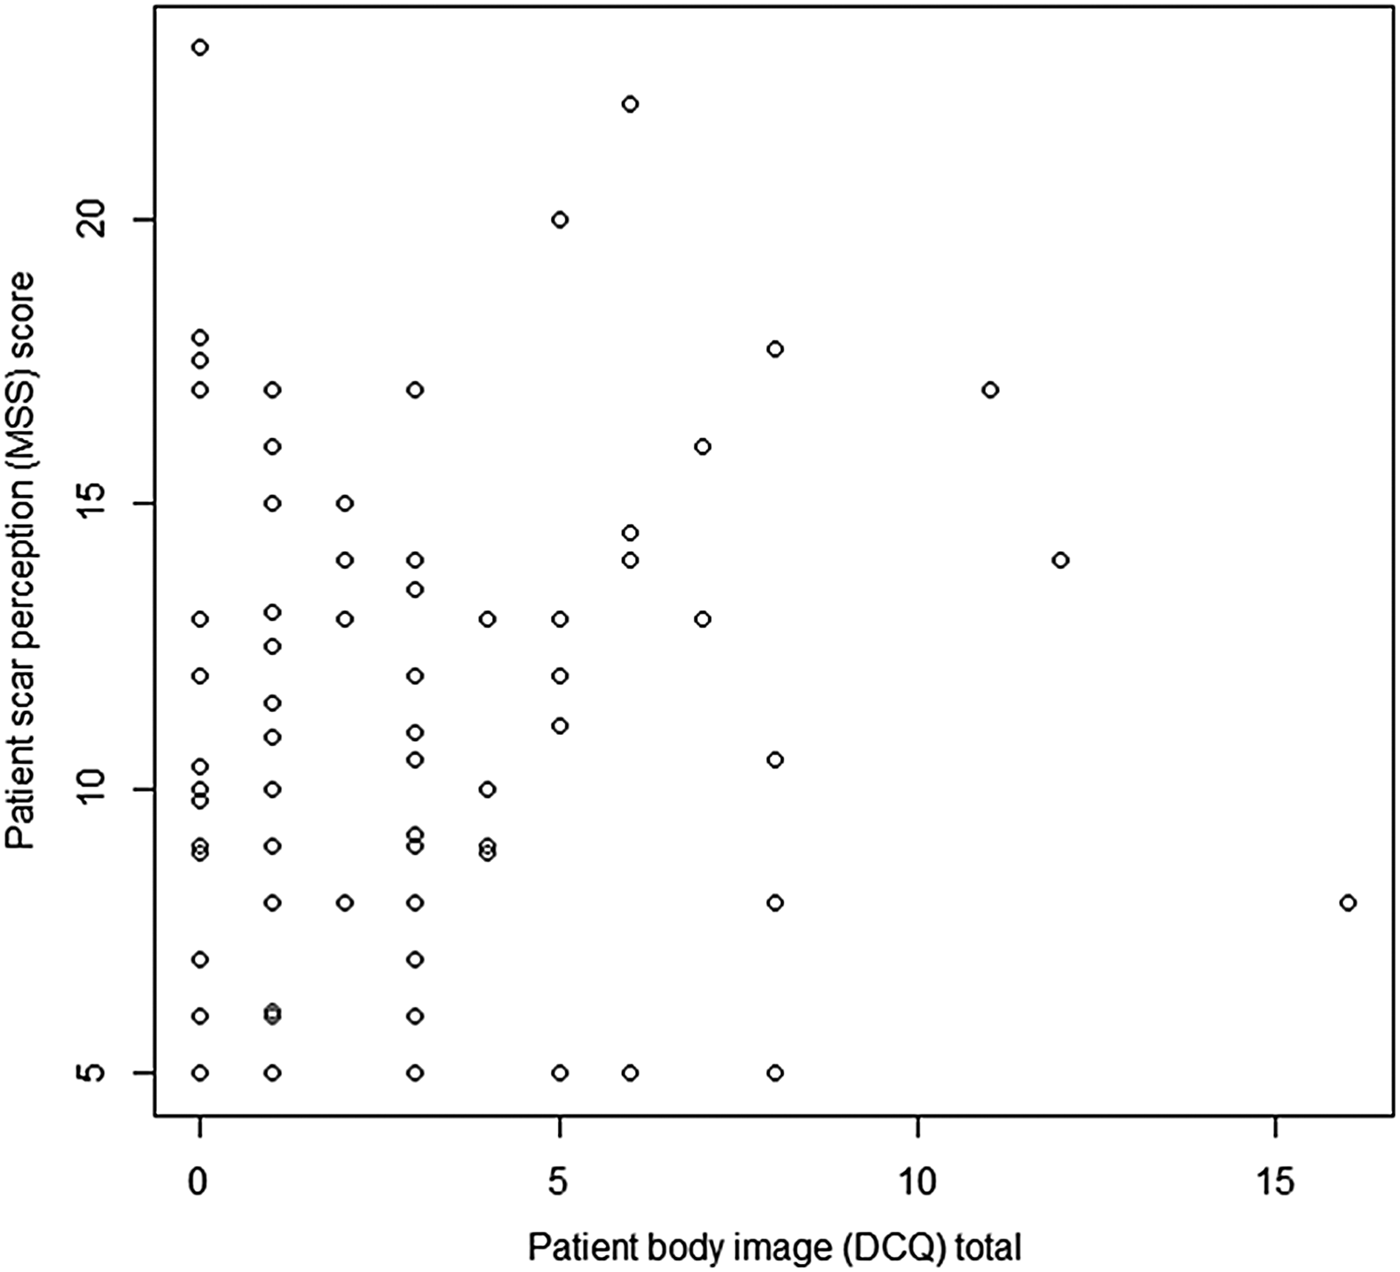
Utilising the Dysmorphic Concern Questionnaire, a statistically significant positive correlation between scar perception and body image concern was observed (ρ = 0.178, p = 0.05) (Figure 6), suggesting that negative body image correlates with negative scar perception.
Graph displaying patient scar perception score (Manchester Scar Scale (MSS)) and body image score (Dysmorphic Concern Questionnaire (DCQ)). (Higher numbers on the y-axis denote a worse score.)
According to Body Dysmorphic Concern Questionnaire criteria, 11 patients (8.94 per cent) screened positively for body dysmorphic disorder. All 11 patients were female, with a mean age of 43.8 years (range, 21–64 years). The mean duration spent by the patient thinking about the scar per day was 74.5 minutes (range, 5–240 minutes). This suggests that body dysmorphic disorder is prevalent in some patients who have undergone thyroidectomy, with a strong female preponderance, which is in keeping with the gender distribution in our population of thyroidectomy patients.
Image panel assessment
The image panel assessment enabled evaluation of inter- and intra-rater reliability. As the dataset was categorical, the weighted kappa test was used to determine reliability, as recommended by Durani et al.Reference Durani, McGrouther and Ferguson 10 The kappa co-efficient κ comprises the following values: less than 0.21 (poor), 0.21–0.40 (fair), 0.41–0.60 (moderate), 0.61–0.80 (substantial) and more than 8.0 (almost perfect).
When testing intra-rater reliability between experts and non-experts (i.e. whether the same result is obtained when the assessment is repeated later in time), κ was 0.809 and 0.47 respectively, denoting almost perfect intra-rater reliability among experts (clinicians) and moderate intra-rater reliability among non-experts (students).
When testing inter-rater reliability (i.e. whether different raters using the scale obtain the same result), an average κ of 0.242 was obtained among experts (σ = 0.116), which suggests a large amount of variance between the subgroup. The average κ between experts and non-experts was 0.217 (σ = 0.174), suggesting a poor level of agreement between raters.
However, when assessing the inter-rater agreement within the ranking of scars (as opposed to agreement between individual scores), the Spearman rank correlation co-efficient demonstrated a significant strong correlation between: experts (ρ = 0.809, σ = 0.094), experts and non-experts (ρ = 0.816, σ = 0.072), and non-experts (ρ = 0.838, σ = 0.079), with a p-value of less than 0.05 in each case. This demonstrates excellent agreement between individuals in the ranking of scars in terms of severity, which is clinically useful.
Discussion
Given the importance ascribed to scar cosmesis by patients undergoing thyroid surgery, there is a paucity of studies in this area. This study is the first of its kind to assess the impact of body image on the perception of thyroid scar cosmesis. Furthermore, no previous study in the literature has used the Manchester Scar Scale tool for patients to self-report their scar perception. We have demonstrated that this tool can be used effectively in a clinical setting, with a good correlation between patient and clinician scores (ρ = 0.766, p < 0.05).
This study is also the first to assess the reliability of the Manchester Scar Scale image assessment tool in the context of standardised scar photography assessment. The kappa co-efficient for intra-rater reliability was 0.809 for experts and 0.47 for non-experts, demonstrating strong intra-rater reliability. The disparity between groups could be attributed to levels of experience: the almost perfect intra-rater reliability of experts could be a result of greater experience of post-operative scars. Inter-rater reliability was lower in comparison. It is undoubtedly of clinical value that intra-rater reliability was high, regardless of variance among individual rater scores, especially as the same rater performed the assessment (i.e. the operating surgeon reviewing patients post-operatively). In addition to this, the tool shows excellent correlation in terms of scar severity ranking between all raters (Spearman rank correlation co-efficient was ρ = 0.809 between experts, σ = 0.838 between non-experts, and ρ = 0.816 between experts and non-experts (p < 0.05)). This significant high level of agreement in scar severity between raters enhances the scale's clinical usefulness, given the variation and number of scars faced by the clinician over time in day-to-day practice.
It is understood that scar formation is a dynamic process. The cellular processes involved are most active during the six months following injury or wounding.Reference Sahm, Schwarz, Schmidt, Pross and Lippert 11 In our study, scar ages ranged from 2 weeks to 333 months (mean, 44 months) post-operatively. This is the longest post-operative scar assessment period of thyroid patients in the literature. In previous studies, patients were followed up on average at: 22.4 months in Sahm et al.,Reference Sahm, Schwarz, Schmidt, Pross and Lippert 11 1 month post-operatively in Miccoli et al.,Reference Miccoli, Bellatone, Mourad, Walz, Raffaelli and Berti 12 6 months post-operatively in Bellantone et al.,Reference Bellatone, Lombardi, Bossola, Boscherini, De Crea and Alesina 13 and 18 months in Böhm et al.Reference Böhm, Minner, Engelhardt and Rödiger 5 With increased promotion of minimally invasive techniques, long-term cosmetic follow up is a sine qua non, which should also be the case for conventional approaches, to enable comparison and better understanding.
This study demonstrated that scar perception is not influenced by scar length, which is in keeping with current data.Reference Toll, Loizou, Davis, Porter and Pothier 4 , Reference Linos, Economopoulos, Kiriakopoulos, Linos and Petralias 14 Of note, when offered a choice of scar location, 55 per cent of patients preferred an axillary scar (with no scar in the neck) and 45 per cent opted for a standard cervicotomy scar. Therefore, it would seem that scar visibility is more important to patients. The literature is conflicting in this regard, with a qualitative study from Manchester demonstrating that non-visible scars generate greater psychosocial distress.Reference Brown, McKenna, Siddhi, McGrouther and Bayat 2
This study reinforces the view that there is a tendency for clinicians to underestimate patient scar perceptions or concerns. Our study shows that patients rate the severity of their scars as significantly worse than clinicians. This clearly prompts a need for greater emphasis on scarring when reviewing patients post-operatively, not only to further understand scarring in the context of thyroid surgery but also to improve patient satisfaction by addressing a potentially overlooked key concern.
As a result of the importance placed on scarring by patients, together with clinicians’ under-rating of severity, it would seem imperative to harness patient-reported outcomes in scar perception. Various studies highlight the importance of harnessing patient perception,Reference Brown, McKenna, Siddhi, McGrouther and Bayat 2 , Reference Durani, McGrouther and Ferguson 10 and we have shown that the Manchester Scar Scale can be used for the subjective, validated assessment of thyroidectomy scarring.
Subjective scar assessment tools are based on an individual's evaluation of the scar (e.g. patient or clinician), and are also useful in determining the significance of changes during wound healing.Reference Durani, McGrouther and Ferguson 10 There are a myriad of objective non-invasive assessment tools to assess skin scars, including laser Doppler, three-dimensional scanning and tonometry.Reference Perry, McGrouther and Bayat 15 Despite these tools being useful in a research setting, their application is neither practical nor feasible in a clinical practice setting, and there remains as yet no single most reliable non-invasive objective assessment tool.Reference Perry, McGrouther and Bayat 15 This study highlights a disparity between the severity rating of scars between patients and clinicians. This questions the actual clinical relevance of using a purely objective measurement tool in place of a subjective, validated self-report assessment.
A variety of subjective, validated scar assessment tools exist, such as the Patient and Observer Scar Assessment Scale,Reference Van de Kar, Corion, Smeulders, Draaijers, van der Horst and van Zuijlen 16 the Wound Evaluation Scale,Reference Hollander, Singer, Valentine and Henry 17 the Patient Scar Assessment QuestionnaireReference Durani, McGrouther and Ferguson 18 and the Manchester Scar Scale.Reference Beausang, Floyd, Dunn, Orton and Ferguson 9 As with objective measures, there remains no ‘gold standard’ subjective assessment tool. The Manchester Scar Scale was devised by Beausang et al. in the assessment of linear surgical scars.Reference Beausang, Floyd, Dunn, Orton and Ferguson 9 An image panel assessment was utilised, as in our study, to determine inter-rater agreement, which was found to be consistent (Spearman co-efficient = 0.87). Furthermore, a good correlation was demonstrated between overall macroscopic Manchester Scar Scale scores and microscopic histological scores of scar subtypes (RReference Brown, McKenna, Siddhi, McGrouther and Bayat 2 = 0.76, p < 0.001), enhancing its validity.Reference Durani, McGrouther and Ferguson 10 , Reference Durani, McGrouther and Ferguson 18
Similarly, there is an array of body image assessment tools.Reference Picavet, Gabriëls, Jorissen and Hellings 19 Oosthuizen et al. first constructed the Dysmorphic Concern Questionnaire in 1998, and it was originally developed to assess body image concern rather than being a tool to diagnose body dysmorphic disorder.Reference Oosthuizen, Lambert and Castle 7 The questionnaire has been validated, achieving satisfactory internal consistency (Cronbach α = 0.88), and it has a strong correlation with impairment in various life domains and with the Beck Depression Inventory (r = 0.47).Reference Oosthuizen, Lambert and Castle 7 It was also found, by Strangier et al., to be a useful instrument in assessing body image and body dysmorphic disorder in the female dermatological out-patient setting.Reference Stangier, Janich, Adam-Schwebe, Berger and Wolter 20
The Body Dysmorphic Concern Questionnaire, in contrast to the Dysmorphic Concern Questionnaire, is a self-report questionnaire, based on diagnostic criteria, specifically designed to screen for body dysmorphic disorder. It was designed by Phillips and colleagues,Reference Phillips 21 and has been successfully utilised in studies investigating the prevalence of body dysmorphic disorder in cosmetic rhinoplasty populations.Reference Veale, De Haro and Lambrou 22 , Reference Altamura, Paluello, Mundo, Medda and Mannu 23 The tool has been demonstrated to have 100 per cent sensitivity and 89 per cent specificity in detecting body dysmorphic disorder.Reference Sarwer, Cash, Magee, Williams, Thompson and Roehrig 24 , Reference Malick, Howard and Koo 25 Both the Dysmorphic Concern Questionnaire and the Body Dysmorphic Concern Questionnaire were selected because of their ease of use in the clinic and robust testing in patient populations not dissimilar to our own. In terms of body image, the Dysmorphic Concern Questionnaire provided the most useful means of elucidating a relationship between negative body image and poor scar rating, as demonstrated.
In regard to body dysmorphic disorder, the prevalence in general populations is estimated at between 0.7 and 7 per cent.Reference Picavet, Gabriëls, Jorissen and Hellings 19 , Reference Malick, Howard and Koo 25 In our study, the percentage of patients screening positively based on Body Dysmorphic Concern Questionnaire criteria was 8.94 per cent. This suggests that the prevalence of body dysmorphic disorder is greater than previously thought in our thyroidectomy patients, possibly enhanced by their underlying thyroid pathology and subsequent surgical intervention.
Lambrou et al. demonstrated that heightened aesthetic sensitivity had a role to play in body dysmorphic disorder, and could account for small defects in appearance severely disturbing patients with body dysmorphic disorder.Reference Lambrou, Veale and Wilson 26 No assessment of aesthetic sensitivity has yet been conducted in patients undergoing thyroid surgery. Anecdotally, the authors have encountered patients with high aesthetic standards perceiving their scars negatively, even disproportionately so, particularly in the context of robotic-assisted thyroidectomy. In those cases, the assessment of pre-operative body image perception and body dysmorphic disorder screening may have prompted further consideration of the type of surgery being offered. Where pathology is benign, and a patient screens positively for body dysmorphic disorder, there may be a strong case not to operate at all. Indeed, Reich states that surgery is contraindicated in patients unable to cope with an imperfect result.Reference Reich 27 With the baseline prevalence of body dysmorphic disorder being higher in this population of thyroidectomy patients, pre-operative assessment of body dysmorphic disorder and body image is imperative, as both factors exert definite bearing on outcome and scar satisfaction.
Scar cosmesis in the context of thyroid surgery is an area of growing interest.Reference O'Connell, Diamond, Seikaly and Harris 3 , Reference Böhm, Minner, Engelhardt and Rödiger 5 , Reference Sahm, Schwarz, Schmidt, Pross and Lippert 11 , Reference Linos, Economopoulos, Kiriakopoulos, Linos and Petralias 14 Our study has demonstrated that both life quality and body image are significantly correlated with scar perception. There is a clinical need to elucidate the prognostic value of these elements in scar satisfaction. Furthermore, we have demonstrated a higher than population prevalence of body dysmorphic disorder in thyroidectomy patients.
Clearly, this has implications for surgical intervention: caution must be exercised when operating on patients with body dysmorphic disorder and a negative body image, with appropriate support being offered pre- and post-operatively to help attain agreement between the patient's and surgeon's expectations. It is the surgeon's duty of care to offer the most appropriate intervention to the patient. In patients with benign thyroid pathology and a negative body image, or a definite diagnosis of body dysmorphic disorder, the authors would advocate proceeding with conventional surgical options, as opposed to minimally invasive techniques, if surgery itself cannot be avoided.
Limitations
Patient assessments were undertaken in the clinic setting under the supervision of a clinician. This was designed to facilitate the process for patients. The sensitive nature of some questions might have led to inaccurate self-reporting by patients.
No a priori power calculation was carried out; however, it was considered that 123 consecutively recruited patients would be sufficient to yield a clinically relevant analysis.
Overall life quality was assessed utilising the EQ-5D, chosen for its simplicity and ease of use. A more detailed questionnaire, such as the Medical Outcome Study's 36-item Short-Form Health Survey, could have resulted in a more in-depth analysis of impact upon aspects of life quality. However, this was beyond the scope of our study.
There was a discrepancy between the number of raters in the expert (n = 5) and non-expert (n = 10) subgroups of the image assessment panel.
Future studies may wish to investigate pre-operative body image and life quality assessment in patients undergoing thyroid surgery, as well as aesthetic concern.
-
• This study is the first to assess the impact of body image and body dysmorphia on thyroidectomy scar cosmesis
-
• Patient perception is the key criterion in assessing scar satisfaction
-
• Clinicians underestimate scar severity compared to patients
-
• Scar length does not affect scar perception
-
• Poor body image is associated with poor scar perception (ρ = 0.178, p = 0.05)
-
• Poor life quality correlates significantly with poor scar perception (ρ = −0.292, p = 0.001)
There is as yet no gold standard assessment tool for either scar perception or body image, yet we hope that utilising validated and robust assessment tools applicable to thyroidectomy patients will facilitate comparisons and future work.
Conclusion
In general, scar satisfaction was high in the patient population surveyed. Body image and life quality are important factors that significantly influence perception of scar cosmesis. Of the thyroidectomy patients, 8.94 per cent screened positively for body dysmorphic disorder, which is higher than quoted general population rates. The Manchester Scar Scale is a simple and clinically useful tool for gauging clinician and patient scar perception. It demonstrated high intra-rater reliability in its image assessment form, which could form a useful adjunct in the assessment of scars using photography, to accurately record and determine changes over time. Clinicians underrate the severity of patients’ scars, which is consistent with published literature; this highlights the need to determine patient-reported outcomes of scarring. Further studies are required in both conventional thyroidectomy and robotic-assisted thyroidectomy patient groups, to assess the prognostic value of body image, body dysmorphic disorder screening and life quality on scar perception.
Acknowledgements
The authors would like to thank: Chris Priest (director of Medical Illustration UK, London), for helping to create a standardised protocol for the image capture of thyroidectomy scars and subsequent patient photography; Dr David Veale, for his expertise on body dysmorphic disorder; Khan Doyme, for statistical analysis and expertise; and Ameer Mustafa, for assisting with data collection.


