

Land degradation arising from soil erosion driven partly by human activities, particularly farming systems, is emerging as a major threat to food security in sub-Saharan Africa (SSA) (Reynolds et al. Reference Reynolds, Smith, Lambin, Turner, Mortimore, Batterbury, Downing, Dowlatabadi, Fernandez, Herrick, Huber-Sannwald, Jiang, Leemans, Lynam, Maestre, Ayarza and Walker2007; Lobell, Burke, and Tebaldi Reference Lobell, Burke and Tebaldi2008; St Clair and Lynch Reference St Clair and Lynch2010). This is expectedly so, given the large proportion of SSA's populace that depends on land-based livelihoods, the success of which is dependent on soil fertility and general ecosystems’ health. The challenge, however, has been that Africa's smallholder agriculture is predominantly a slash-and-burn system that is traditionally combined with shifting cultivation to create sufficient fallow periods for the forest and soil on old plots to be replenished (Kleinman, Pimentel, and Bryant Reference Kleinman, Pimentel and Bryant1995; Hauser and Norgrove Reference Hauser, Norgrove and Levin2013). Unfortunately, rising land scarcity due to population pressure has caused fallow periods to vanish in most areas. This, coupled with rising pressure to meet the food needs of a rapidly growing population, creates impetus for continuous cropping and livestock grazing on marginal lands and the push to open more lands for agriculture, the consequences of which are deforestation, rising chemical dependence, soil degradation, and loss of ecosystems’ health in SSA (Lal Reference Lal2001; Lobell, Burke, and Tebaldi Reference Lobell, Burke and Tebaldi2008).
Available evidence suggests that human-induced land degradation is widespread in Africa, with as much as 494 million hectares out of the 2,966 million hectares of arable land in the region estimated to have been degraded (Lal Reference Lal2001). Kiage (Reference Kiage2013), citing statistics from World Meteorological Organization (2005), noted that losses in productivity of land in Sub-Saharan may be close to 1 percent annually. More recently, Le, Tamene and Vlek (Reference Le, Tamene and Vlek2012), in a study of the Volta basin of West Africa, reported that while land degradation is evident in about 8 percent of the land mass, as much as 65 percent of the land area around the basin might be losing some of its vital attributes such as soil quality or vegetation productivity to anthropogenic activities.
Considering the impacts, the current farming systems in SSA coupled with other unsustainable ecosystems’ services exploitation strategies appear to be unwise! They predispose the soil to erosion, leading to land degradation and desertification with an attendant decline in the productive capacity of the soil, lower yields and increased poverty, hunger, and food insecurity (Nana-Sinkam, Reference Nana-Sinkam, Onimode and Synge1995; MEA, 2005; Brabant, Reference Brabant2008; Muchena Reference Muchena2008). Deforestation and land degradation have also been identified as significant sources of greenhouse gas (GHG) emissions, leading to global warming (IPCC, 2007), while also contributing to loss of biodiversity and drastic reduction in capacity of ecosystems to support livelihoods and provide vital ecosystem services (MEA, 2005; Reynolds et al. Reference Reynolds, Smith, Lambin, Turner, Mortimore, Batterbury, Downing, Dowlatabadi, Fernandez, Herrick, Huber-Sannwald, Jiang, Leemans, Lynam, Maestre, Ayarza and Walker2007; FAO, 2010; Le, Tamene, and Vlek Reference Le, Tamene and Vlek2012). It is feared that if the present pace of land degradation in Africa is not checked, about two-thirds of the cropland in the region may soon become nonproductive, and this could leave hundreds of millions of people in Africa without the ability to produce or purchase sufficient food (Stern, Reference Stern2007). Moreover, the need to rise up to the challenge of feeding the rapidly growing population in Africa, while not compromising resource and environmental sustainability in the face of climate change, makes it imperative that Africa's agriculture is transformed, hence the call for a shift to climate-smart agriculture (CSA), as promoted by FAO (2010).
By CSA, reference is made to agriculture that sustainably increases productivity and income, build resilience to climate change, reduces/removes GHG emissions (where possible), and enhances achievement of national food security and development goals (FAO, 2010, 2013). According to FAO (2010), CSA entails embracing ecosystem approach in food production and working at the landscape scale. It requires intersectoral cooperation and coordination in planning response to climate change (FAO, 2010). At farm levels, it entails integrated adoption of a set of agricultural practices with CSA potentials (AP-CSAPs): that is, resilient production techniques that provide the possibility to produce more from the same area of land while conserving resources, reducing negative impacts on the environment and enhancing natural capital and the flow of ecosystem (FAO, 2016). In the context of this study, AP-CSAPs include conservation agricultural practices like zero/minimal tillage, cultivation of hybrid—high yielding, disease resistant and drought tolerant—crop varieties, and a wide range of context-specific integrated nutrient, water, pest and weed management practices, with emphases on minimal soil disturbance and reduced chemical, energy and resource use (FAO, 2016).
For Nigeria, and SSA in general, the need for a shift to CSA cannot be overemphasized. It is important in national pursuits of sustainable development goals (SDGs), particularly to protect, restore and promote sustainable use of terrestrial ecosystems (Goal 15) and combat climate change and its impacts (Goal 13), while making conscious efforts to end poverty, hunger and food insecurity (Goals 1 and 2) in the subregion. Nigeria has also identified shift to CSA as one of the main strategies for achieving its approved Intended Nationally Determined Contributions to the reduction of GHG emissions under the 2015 Paris Climate Submit agreements. The challenge, however, has been that while many AP-CSAPs have been introduced for quite sometime, the adoption rates are generally low in SSA (McCarthy and Brubaker Reference McCarthy and Brubaker2014). This suggests that concerted efforts are required at various levels to promote adoption of these practices if SSA will not again lag behind in achievement of SDGs as the case was with the Millennium Development Goals. There, therefore, arises the need for context-specific analysis that reveals the impacts of AP-CSAPs and the influence of various factors affecting the adoption in SSA.
Emerging evidence in the literature suggests that while the positive ecosystem impacts of many of these AP-CSAPs are well established, the impacts on productivity and income may be mixed and context specific. For example, while Nguyen (Reference Nguyen2011) reported that development and dissemination of Integrated Crop Management for Rice increased yields of existing rice varieties by as much as 1–4 tonnes, Arslan et al. (Reference Arslan, Cavatassi, Alfani, Mccarthy, Lipper and Kokwe2017) reported that minimum soil disturbance and crop rotation have no significant impact on the yield outcomes in maize. The study, however, found that legume intercropping significantly increased yields and reduced the probability of low yields even under critical weather stress during the growing season (Arslan et al. Reference Arslan, Cavatassi, Alfani, Mccarthy, Lipper and Kokwe2017). Similarly, Branca et al. (Reference Branca, Lipper, McCarthy and Jolejole2013), in a review of about 160 studies reporting original field data on the yield effects of sustainable land management (SLM) practices that sequester soil carbon, noted that while SLM generally leads to increased yields, the magnitude and variability of results varies by specific practice and agroclimatic conditions. They noted that rainfall distribution is a key determinant of the mitigation effects of adopting specific SLM practices and that the mitigation effects were higher in higher rainfall areas.
On adoption of AP-CSAPs and its determinants, Asfaw et al. (Reference Asfaw, McCarthy, Lipper, Arslan, Cattaneo and Kachulu2014) found that farmers’ exposure to delayed onset of rainfall and greater climate variability as well as biophysical sensitivity of their plots are key factors that are positively associated with the choice of risk reducing agricultural practices. They also found that wealthier households are more likely to adopt both modern and SLM inputs and highlighted the key role of rural institutions, social capital, and supply-side constraints in governing selection decisions for all AP-CSAPs examined. Similarly, Khatri-Chhetri et al. (Reference Khatri-Chhetri, Aggarwal, Joshi and Vyas2017) reported that socioeconomic characteristics and rainfall zones significantly drive farmers’ preferences for CSA technologies. They also reported that technologies and the cost of implementation significantly influenced farmers’ preferences and willingness to pay (WTP).
The widespread poverty among smallholder farmers in SSA is also a likely factor limiting adoption of new technologies (Obayelu et al. Reference Obayelu, Okuneye, Shittu, Afolami and Dipeolu2016; Akerele et al. Reference Akerele, Shittu, Ogunmola, Adekanmbi and Adekunle2017). Not only do they predominantly lack the requisite human and physical capital (Sachs et al. Reference Sachs, McArthur, Schmidt-Traub, Kruk, Bahadur, Faye and McCord2004), they also lack access to financial services (Honohan and King, Reference Honohan, King, Cull, Demirgüç-Kunt and Morduch2009), face limited marketing opportunities, and often have to contend with poor rural land governance, gender-based discrimination, weak institutions, and poor infrastructure (Sachs et al. Reference Sachs, McArthur, Schmidt-Traub, Kruk, Bahadur, Faye and McCord2004; Philip et al. Reference Philip, Nkoya, Pender and Oni2009; Barrientos Reference Barrientos2012). These call attention to the need to examine the possible impacts of these sociocultural, economic, and institutional factors on adoption of resilient production techniques, with a view to identifying appropriate mechanisms to incentivize widespread adoption of AP-CSAPs as to stop or reverse land degradation, restore ecosystem health, enhance livelihood outcomes, and build resilience to climate change.
This study thus has three goals. First is to assess the perceived rights that smallholder (maize and/or rice) farmers in Nigeria enjoy on their farmland, mode of acquisition of these rights, and the tenure security in the lights of the Land Use Acts of Nigeria. Second is to assess the influence of land tenure and property rights (LTPRs) on farmers’ willingness to accept (WTA) incentives to embrace CSA, as part of measures to combat land degradation, restore soil health, and thereby increase farmers’ productivity and income Nigeria. Third is to assess the effects of CSA scheme attributes viz. CSA types and features, incentive level and mode of payment, and the payment vehicles on farmers’ WTA incentives to embrace CSA Schemes in Nigeria. The study was part of a broad national study on incentivizing the adoption of climate-smart practices in cereals production in Nigeria, funded by the Economic Community of West African States through its Regional Agency of Agriculture and Food, and with funding support of the French Development Agency (AFD).
This paper presents results of a choice experiment (CE) based study that assessed farmers’ WTA incentives to enroll in a hypothetical, publicly funded, 30-year payment for ecosystem services (PES) scheme by which farmers would be rewarded for carbon that they may be able to sequester for embracing a set of context-specific AP-CSAPs. The study was conceptualized against the background that low adoption of AP-CSAPs in SSA is most likely a consequence of market failure that often characterizes private production of public goods (Kosoy et al. Reference Kosoy, Martinez-Tuna, Muradian and Martinez-Alier2007). Please note that investments in AP-CSAPs would reduce GHG emissions and contribute toward restoration of ecosystem health, which are public goods of national and international importance. Yet, no market exists for such services in Nigeria and most of SSA, hence the low adoption rates of AP-CSAPs. This makes implementation of publicly funded PES schemes indispensable, at least as short- to intermediate-term measures to promote a shift to CSA in Nigeria. PES schemes are generally implemented to correct market failures in recognition of value of ecosystem services, and thus they provide incentives to ecosystem services providers (Pagiola et al. Reference Pagiola, Ramírez, Gobbi, Haan, Ibrahim, Murgueitio and Ruíz2007; Zander et al. Reference Zander, Parkes, Straton and Garnett2013; Nyongesa et al. Reference Nyongesa, Bett, Lagat and Ayuya2016).
We conceptualize the hypothetical PES scheme as one funded from the federation account through annual budgetary provisions as well as with the funding support of international development and donor agencies. Possible local sources of funds for the scheme include imposition of emission taxes/levies on GHG-emitting companies, transport services providers and large-scale farms. The potentials and sustainability of these revenue sources shall be subject of further research. While noting that values of ecosystem services associated with AP-CSAPs is assessable by estimating WTP for such services, estimation of WTA incentives is more consistent with the interest of this study. The focus in WTP studies is usually ecosystem service valuation from the beneficiaries’/users' perspective. Our study seeks to estimate financial incentives that would be sufficient to compensate farmers – ecosystem service providers, in the study context – to invest in CSA as to combat land degradation, enhance productivity, and reduce agricultural GHG emission. Our results, however, included estimates of WTP for farmers who may rather prefer to maintain the status quo.
The CE data used were those collected from 1,138 farmers who operated on private/communal land, in rain-fed upland/lowland ecologies. The data were analyzed within the random utility theory (RUT) framework, and the random parameter (mixed) logit (RPL) as well as random effect logit (REL) econometric framework. Our results show that while farmers that are dependent on leased and/or communal lands showed strong preference for status quo, those that enjoy relatively more secure LTPRs had positive WTA incentives to combat land degradation.
In the next section, we explain empirical settings for the study. The theoretical and econometric framework were presented in the third section. The fourth section presents the study methodology. The fifth and the sixth sections present the descriptive and econometric results respectively, while the final section presents the main conclusions.
Empirical Settings for the Study
Nigeria in Brief
The study was conducted in selected farming communities reputed for maize and/or rice production across the six geopolitical zones (GPZs) of Nigeria, and covering five of the seven agro-ecological zones (AEZs) (Figure 1). Nigeria is located within the West African sub-region, lying between longitudes 3o and 14o east, and latitudes 4o and 14o north. It has a total land area of 923,768 square kilometers. It is bounded at the north by Niger Republic, to the east by Chad and Cameron, to the south by the Gulf of Guinea and west by Republic of Benin.
Map of Nigeria showing the study locations across the agro-ecological and geopolitical zones
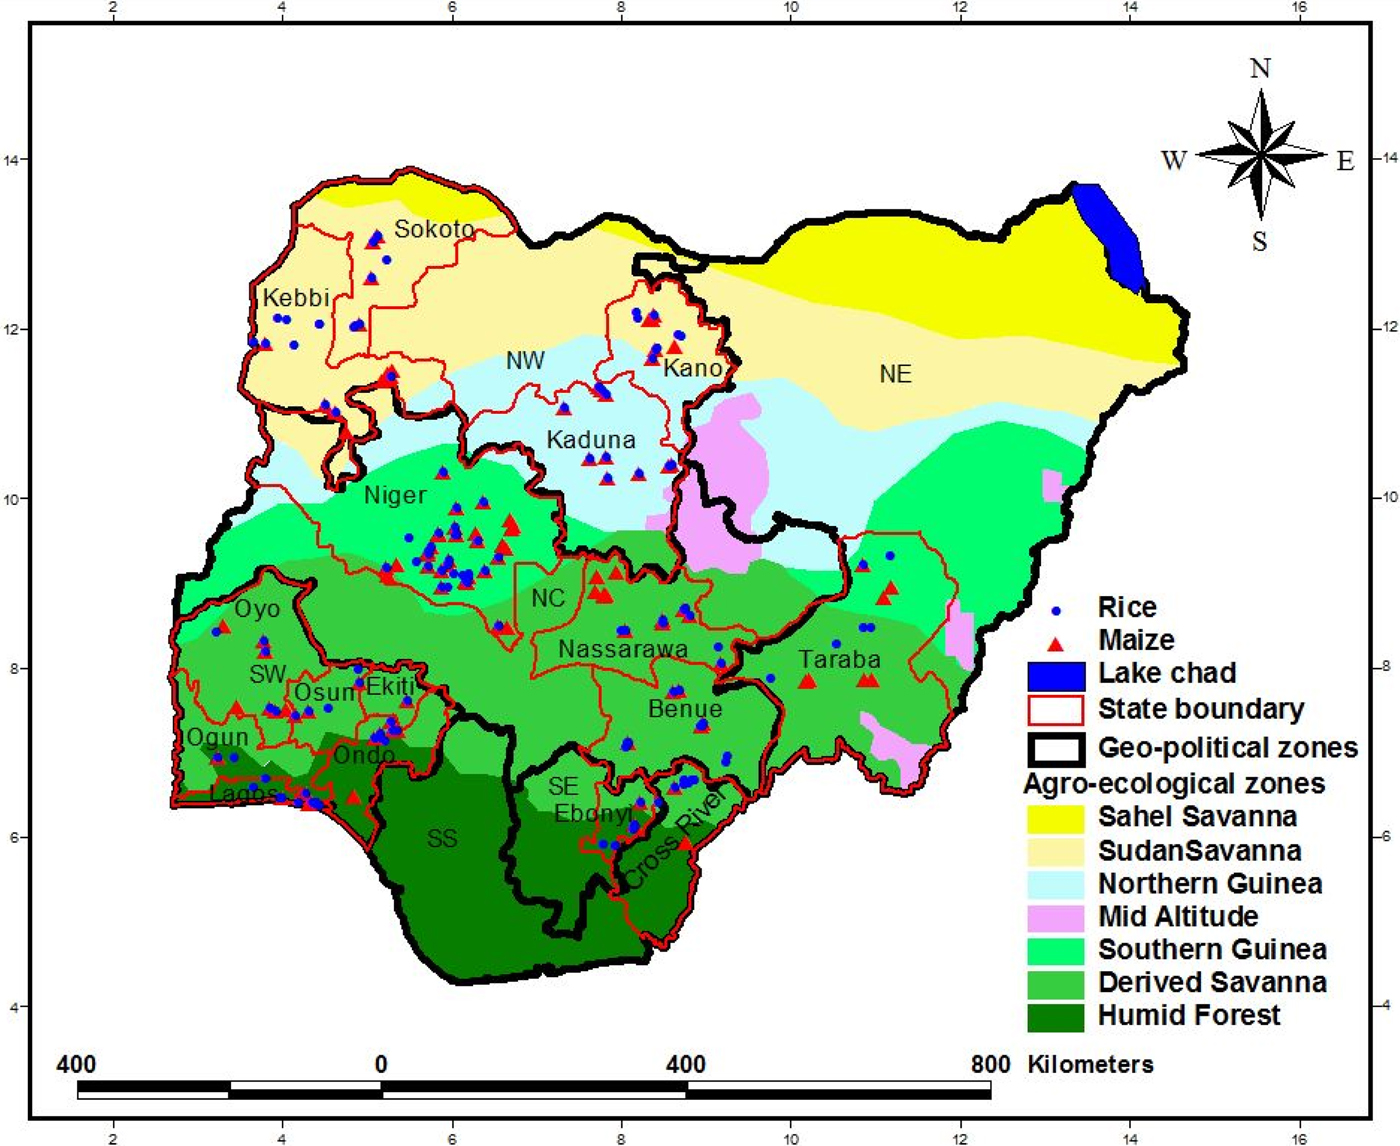
Nigeria's climate is tropical, with three distinct moisture regimes: wet, moist, and dry regions. There are also three distinct types of vegetation distinguishable as one moves from the southern part of the country to the north. These include forests (where there is significant tree cover), savannahs (insignificant tree cover, with grasses and flowers located between trees), and montane land. The climate and vegetation divide Nigeria into seven main AEZs, namely the Sahel Savannah, the Sudan Savannah and the Northern as well as Southern Guinea Savannahs. Other AEZs include the Derived Savannah, the Mid-Altitude, and the Humid Rainforests, all of which are suitable for maize and rice production, among several other crops such as cassava and yams. This study covered virtually all the ecologies, except the relatively small Mid-Altitude and the Sahel Savannah that is predominantly in conflict-ridden Northeast Nigeria.
Land Governance in Nigeria
Land ownership and control in Nigeria is de jure governed by the Land Use Act of the 1979 constitution (Laws of the Federation of Nigeria (LFN), 2004), formerly known as the Land Use Decree of 1978. This expressly vested all land in each state of the Federation in the Governor of that state, who is to hold such land in trust for the people, and is to administer the land for the use and common benefit of all Nigerians (Section 1). Section 2 of the Act provides that all land in areas designated as urban in a State shall be under the control and management of the State Governor, while all other lands in nonurban areas shall be under the control and management of the local government.
The law made provisions for granting of two types of land use (occupancy) rights to all categories of land users in Nigeria: Statutory and Customary Rights of Occupancy (LFN, 2004: Sections 2 & 3). A Statutory Right of Occupancy is a right over the use of land in any part of a state, rural or urban, granted under the Act by the State Governor. A Customary Right of Occupancy is the right of a person or community lawfully using or occupying land in accordance with customary law and include a customary right of occupancy granted under the Act by a local government (LFN, 2004).
A Certificate of Occupancy, the highest form of land title in Nigeria, is normally issued to an occupier as evidence of having been granted a Statutory Right of Occupancy on the land by the State Governor. One of the key requirements for issuance of a Certificate of Occupancy in most states is the evidence of having duly acquired the land from the indigenous people/local communities – the de facto landowners. This is usually evidenced by producing a duly verified/stamped deed of transfer, purchase receipt and an approved survey of the land. The latter, which is the next recognized level of land titling in Nigeria by private title registration at the State's land registry, may only be approved on lands that have not been gazetted as taken over for use by the federal, state or local government.
It is under the customary rights of occupancy, governed by the largely unwritten customary laws in various localities, that most LTPRs enjoyed on agricultural lands in Nigeria are defined, acquired and/or transferred, subject to the Act. Various provisions of the Act protect customary rights of occupancy enjoyed on agricultural lands. It provides, for example, that:
• Holders of lands in an area not classified as urban, which have been under use for agricultural purposes before the enactment of the Act be treated and registered as if they have been granted the customary right of occupancy under the Act by the Local Government (LFN, 2004: Section 36 (2 & 3));
• Where a customary right of occupancy is to be revoked in the overriding interest of the public, the holder shall be entitled to compensation for the value at the date of revocation of their unexhausted improvements on the land (LFN, 2004: Section 6 (5));
• Where, a land used for agricultural purposes is revoked in the overriding interest of the public, the Local Government is under obligation to allocate to such holder alternative land for use for the same purpose (LFN, 2004: Section 6 (6)); and
• The main requirement needed for alienation by assignment, mortgage, transfer of possession, sublease or otherwise howsoever of any part of a land under customary rights of occupancy is the approval of the appropriate Local Government (LFN, 2004: Section 21), which in practice is usually obtained via deed of transfer and new owners’ title registration at the Land Registry.
The above facts notwithstanding, the fact that LTPRs on agricultural lands in Nigeria are mostly informally defined and prone to unfair expropriation, in view of the overriding powers of the State Governor and local governments, makes it imperative that the likely impacts on AP-CSAP use be examined. Hence, a key focus of the study is an assessment of LTPRs on farmers’ WTA incentives to embrace CSA.
Theoretical and Econometric Framework
This study uses data from a CE that has its theoretical foundation in Lancaster's attribute theory of consumer choice (Lancaster Reference Lancaster1966) and an econometric basis in models of random utility (Luce Reference Luce1959; McFadden Reference McFadden and Zarembka1974).
Lancaster and Random Utility Theory
Lancaster proposed that consumers derive satisfaction not from goods themselves, but from their attributes. The RUT extended the attribute theory, positing that observation of utility is possible only imperfectly. Hence, the utility (U) derivable from the attributes embedded in a good can be conceptualized as consisting of a systematic (deterministic) component, V, and an error (random/stochastic) component, ε, which is independent of the deterministic part and follows a predetermined distribution (McFadden Reference McFadden and Zarembka1974; Hanemann, Loomis, and Kanninen Reference Hanemann, Loomis and Kanninen1991). That is:
 $$U_{kn} = V_{kn} + \varepsilon _{kn}. $$
Thus, an individual i will choose an alternative k from a specific choice set, n, given the utility U, if U k is greater than the utility of any other choice j in the choice set.
The probability that individual i chooses alternative k is:
 $$P_{kn} = \Pr \lpar U_{kn} \gt U_{\,jn}\rpar \forall _j \ne i$$
 $$U_{kn} \gt U_{\,jn} \to V_{kn} + \varepsilon _{kn} \gt V_{\,jn} + \varepsilon _{\,jn}\forall _j\; \ne k\semicolon \; k\comma \; j \in J. $$
V thus becomes the explainable proportion of the variance in choice and ε the nonexplainable. Random utility model assumes that individual acts rationally and chooses the alternative with the highest level of utility.
The Random Parameter (Mixed) Logit Model
Estimation of random utility models is often within the framework of conditional logit and RPL regressions. The conditional (or multinomial) logit modelling framework is applicable in the analysis of a dichotomous choice problem that assumes that preferences are homogenous across respondents. As noted by Greene (Reference Greene2003), however, preferences are in most cases heterogeneous, hence the need to account for this heterogeneity as to enable estimation of unbiased estimates of individual preferences and enhance the accuracy and reliability of estimates of demand, participation, marginal, and total welfare. A common method of evaluating preference heterogeneity is an estimation of RPL models. It is applicable in most cases in which preferences differ among individuals, and the researcher does not know which type of preferences an individual hold and thus cannot perfectly predict the choices made as typical of the RUT.
The RPL model is a specification of the mixed logit model in which coefficients are assumed to be random parameters (Kjaer Reference Kjaer2005). It is a highly flexible model that can approximate any random utility model and relaxes the limitations of the traditional multinomial logit by allowing random taste variation within a sample according to a specified distribution (McFadden and Train Reference McFadden and Train2000).
Following Train (Reference Train2003), the probability of individual i choosing alternative j from the choice set S in situation t is:
 $$\eqalign{{\rm Prob}(V_{ijt} & = 1 \vert X_{i1t}^{\prime},\; X_{i2t}^{\prime}, \ldots, \; X_{iKt}^{\prime}, \; \Omega) \cr & = \int \displaystyle{\exp \left[ {X_{ijt}^{\prime} \beta _i} \right] \over \sum\nolimits_{k = 1}^K \exp \left[X_{ikt}^{\prime} \beta _i \right]} f\,(\; \beta \vert\Omega)d \beta} $$
where the vector Ω defines, the parameters characterizing the distribution of the random parameters, which the researcher can specify. X ijt′ is a vector of observed variables, including the choice attributes and socioeconomic characteristics of the respondents, Coefficient vector βi is unobserved for each i and varies in the probability density f(β|Ω), where Ω is vector of parameters of a continuous probability distribution. The coefficient vector βi is the parameter associated with person i, representing that person's preference. These preferences vary over people; the density of this distribution has the parameter, Ω. The aim of the estimation procedure is to estimate Ω, or the population parameters that describe the distribution of individual parameters. The log-likelihood function is:
 $$LL\lpar \Omega \rpar = \; \Sigma _ilnV_i\lpar \Omega \rpar. $$
This log-likelihood function is maximized via simulation, specifically V i(Ω), and is approximated by a summation over values of βi generated by Halton draws (Train Reference Train1998). The distribution of βi can be either continuous or discrete. A model with continuously distributed coefficients is usually called a mixed logit model (Hole Reference Hole2007a, Reference Hole2007b). The mixed logit model has been applied in several circumstances in economics including environmental, transport, and agricultural economics (Asrat et al. Reference Asrat, Yesuf, Carlsson and Wale2009).
Given consistent estimates of RPL model parameters, the coefficient associated with the j th attribute, βj is the marginal utility of that attribute. Given any two attributes, the ratio of their coefficients (βj/βs) measures the marginal rate of substitution (i.e., the trade-off) of one attribute in terms of the other, and where the referenced attribute is that of income (price), the ratio, (βj/ − βprice) is the marginal WTP or WTA (Hjelmgren and Anell Reference Hjelmgren and Anell2007; Casey, Kahna, and Rivasb Reference Casey, Kahna and Rivasb2008).
Study Methodology
Data Collection and Sampling
Data used in this study are part of data collected in a broader nationwide cross-section survey of maize and/or rice farmers with 1,747 farmers interviewed across 141 farming communities that were spread across 16 of the 36 States, all the six geopolitical zones (GPZs) and five (5) of the seven agro-ecological zones (AEZs) in Nigeria. The data collection was by field observations, focus group discussions and personal interviews coupled with CE conducted between February and April 2017. This was after some reconnaissance survey and a series of pilot tests of the data collection instruments across the main agro-ecological zones (AEZ) of Nigeria between December 2016 and January 2017.
The study respondents were drawn in a multistage sampling process. This was based on the structure created under the World Bank-sponsored Agricultural Development Programme (ADP) across the 36 States of Nigeria, which organized farming communities into Cells (or Circles), Blocks and Zones. The cells are groups of farming communities assigned for coverage to an Agricultural Extension Officer under the Training and Visit (T & V) Extension System adopted by various States’ ADPs in Nigeria. The Blocks are groups of five to eight Cells, usually made up of the Cells in a Local Government Area (LGA), which are assigned for routine Supervision and Monitoring to an LGA level/Senior Agricultural Extension Officer. A number of Blocks are brought together as a Zone, under the headship of a Zonal Manager, with each State having three or four agricultural zones under the Programme Manager.
The first stage was a purposive selection of two to four States from the main AEZs noted for maize and/or rice production in Nigeria, with the number of states, selected proportional to the number of States/AEZ, while those selected were States reputed as the leading producers of rice and/or maize in the AEZ. Also taken into consideration is the need for national spread, covering all the GPZ, and avoiding unnecessary risk, particularly the conflict-prone areas in the northeast. The second stage of the sampling process was by purposive selection of two Blocks, one Block per crop in each of the three to four agricultural zones of the state, and two Cells randomly selected per Block, among those located in the main maize- and/or rice-producing areas of the State. The final stage of the sampling process was by random selection of 5 to 15 members of the rice/maize farmers’ groups in each of the selected cells. This process yielded 1,747 rice and/or maize farmers that were interviewed in the study. The sampling was done in consultation with the States’ ADPs, who also nominated the Enumerators used from among the AEOs in the State.
The survey in each Cell/Farming Community was usually commenced with interactions with community leaders, identification of existing maize and/or rice farmers’ groups and focus group discussions with members of the identified groups, during which a list of their members was collected/compiled and used to select the farmers whose households were interviewed. Each household interview entailed collection of primary data on the farmers’ personal, household, farm and community characteristics. Also collected are plot-level data on production practices including plot characteristics, resource use, outputs, and prices during the 2016/2017 farming season. Other issues covered include those related to land tenure and property rights (LTPRs) and livelihood assets of the plot managers. At the final phase of the interview, the CE questions/tasks were then presented to the sampled farmers.
Land Tenure and Property Rights Measurement
Two indicators were employed in assessing LTPR of farmers in this study. They include:
(i) Tenure type: This was measured on a nominal scale, using dummy variables freehold, leasehold, and communal, that takes the value of one if the right to use the parcel of land was acquired through direct inheritance and/or purchase for freehold, leased or rented for leasehold, and joint ownership with extended family or other community members for communal. Otherwise, the dummy variables were assigned a zero.
(ii) Tenure security (legal): A tenure was classified as de jure secured if the parcel has been surveyed and duly registered with the Land Registry; otherwise, it was classified as unsecured (de jure). This variable was meant to assess the importance of title registration.
Design of the Choice Experiment
The CE conducted in this studyFootnote 1 was in respect of farmers’ preferences for some hypothetical PES schemes, by which incentives (cash and/or in-kind) may be provided to farmers to shift from current farming system to one of a set of context/crop specific CSA that reduce agriculture-related GHG emissions. These include agroforestry as well as a complementary set of good agricultural practices (GAPs), with or without manure application. The GAPs are improved agronomic practices and minimum/no-tillage coupled with integrated nutrient, water, and residue management. We estimated the carbon sequestration potentials of a shift to a CSA option as against maintaining a prior state of not using any AP-CSAP, under various climate and soil conditions in Nigeria, using the FAO Ex-Ante Carbon Balance Tool (Ex-Act). We set the implementation phase at 10 years and the capitalization phase at 20 years to give a project duration of 30 years. The estimated carbon sequestration potentials were valued at carbon prices between US$10/tCO2 Eq. and US$50/tCO2 Eq. in determining the incentives presented to the farmers. This was based on statistics in Carbon Pricing Watch (World Bank and ECOFYS 2016), which put carbon prices as at April 1, 2016, in most European and North American Carbon markets at between US$6/tCO2 Eq. and US$53/tCO2 Eq.
The choice attributes of concern and their levels are summarized in Table 1. These were selected based on shreds of evidences from our preliminary studies, pretests, and consultation with key stakeholders. The attributes’ levels were combined into profiles (i.e., options presented in the choice sets) using the orthogonal design procedures in Statistical Package for Social Scientists (SPSS) Version 17. As noted in the SPSS help file, the orthogonal main effect design procedure creates a reduced set of profiles that are small enough to include in a survey but large enough to assess the relative importance of each factor (attribute). It noted further that the design framework permits statistical testing of several factors without testing every combination of factor levels.
Attributes and Levels of AP-CSAPs for Upland Rice and Maize Farmers
Two sets of orthogonal main-effect designs, each consisting of 25 profiles, were generated in two runs per crop/context-specific scenarios and were randomly combined with the status quo in creating the tasks that were presented to the respondents (see Table 2 for example). This process produced 25 sets of tasks, which were divided into five blocks, each with five tasks that were presented sequentially to all respondents. The blocks were randomly assigned to respondents in a systematic manner: the first respondent to be interviewed gets tasks in Block A, the second B, third C, fourth D, and the fifth E. The cycle was in the same order for respondents 6–10, 11–15, and so on. The task was simply for the respondent to choose one of three options (labelled A, B, and C). The choice was expected to be their most preferred if presented with a legally enforceable contract that will entail payment of specified incentive annually, under specified terms/conditions if the farmer agreed and was verified to have shifted his/her farming practices to the preferred CSA option, or nothing if he/she prefers to maintain the status quo.
Typical Tasks Presented to Respondents
Note: Official exchange rates at the time of the study was an average of N305.44/US$1.
Data Analysis
Data analysis was by a combination of descriptive and econometric techniques. Data from the household survey, land acquisition, key rights held and usage of AP-CSAPs was analyzed using descriptive statistical methods to generate frequencies and percentages. Data on WTA incentives and the influence of LTRPs and other socioeconomic factors on this were analyzed within the framework of mixed logit and REL models. The choice of the mixed logit analytical framework was motivated by the fact the mixed logit obviates three of the limitations of the standard logit model by allowing for random preference variation, unrestricted substitution patterns, and correlation in unobserved factors over time (Train Reference Train2003). Moreover, discrete choice models that are derived from maximization of random utility are known to have choice probabilities that can be closely approximated by mixed logit model under mild regularity conditions (McFadden and Train Reference McFadden and Train2000; Alfnes et al. Reference Alfnes, Guttormsen, Steine and Kolstad2006).
The mixed logit model is specified as follows:
 $$ U_{ij} = \; X_{ij}{\rm \beta} _i + W_{ij}{\rm \alpha} + Z_i{\rm \delta} _j + {\rm \varepsilon} _{ij}\quad {\rm where} \quad j\; = \; {\rm 1}\comma \; \; \ldots\comma \; \; J$$
where:
U ij = the utility that individual i receives from alternative j
βi = random coefficients that vary over individuals in the population
X ij = vector of alternative specific variables with random coefficients
W ij = vector of alternative specific variables with fixed coefficients
α = fixed coefficients on W ij
Z i = a vector of case-specific variables (LTPRs)
δ j = fixed alternative-specific coefficients on Z i
εij = random term that follows a Type I extreme value distribution.
Because we found that the mixlogit command restricted the maximum number of variables allowed in an analysis to 21, and did not allow variables that do not vary within case (respondent), the influence of such factors as the socioeconomic characteristics of the farmers, soil and climatic conditions, and geopolitical zones were examined within the RPL framework. The REL takes cognizance of the correlations between individuals and permits time (case) invariant variables. The REL is thus specified below:
 $$y_{ij}^{\ast} = \; \alpha + \Sigma \delta _z A_{ijz} + \Sigma {\rm \beta} _l S_{il}^{\ast} A_{ijz} + \; u_i + \; \varepsilon_{ij}$$
where  $y_{ij}^* $ is a latent variable associated with whether or not rice and/or maize farmer i consider the offer in card j acceptable (y ij). $y_{ij} = 1 \quad {\rm if}\; y_{ij}^{\ast} \gt 0$, and y ij = 0 if otherwise.
A ijz is the z th attribute of the CSA scheme in card j presented to respondent, i.
S il is l th LTPRs characteristics of the i th rice farmer that is hypothesized to be a determinant of y ij = 0.
u i stochastic residual due to differences among the respondents
εij stochastic residual due to differences among observations
Corr (u i, εij) = ρ; and ρ take care of potential correlation between observations from one individual
α and δ are parameters to be estimated.
Model Estimation and Options
The RPL (mixed logit) and REL models in equations (8) and (9) were respectively estimated using the “mixlogit” (Hole Reference Hole2007a) and “xtlogit” (“re” option) commands in Stata 15, while the marginal WTAs (or WTPs) were computed with the “wtp” command (Hole Reference Hole2007b). Two key considerations however, had to be made in selection of estimation options. First is the fact that the CE data were collected based on cluster design at the block level, which was a result of assigning CE tasks to respondents in blocks. Hence, we selected the cluster-robust option in estimation of standard errors of the parameter estimates in both the mixed logit and REL models.
Second, nonavailability of sampling frame and other relevant preliminary information on various categories of the survey respondents made it impossible for us to stratify respondents on key characteristics. We attempted to correct possible impact of this on our estimates by resorting to the use of estimated total population of farmers, which was only available at the state level, as sampling weight in the estimated mixed logit model. We found, however, that sampling weight option is not available in Stata command for REL estimation.
Descriptive Results
Socioeconomic Characteristics of the Rice/Maize Farmers
As a background to subsequent analyses, the socioeconomic background of the study respondents (maize and/or rice farmers in Nigeria) was analyzed and the results summarized in Table 3. As shown in the table, a typical maize and/or rice farmer in Nigeria is about 45 years old with mean years of schooling of 7 years. He is 90.1 percent likely to be a male and 93.2 percent likely to be married. The mean household size was seven people, while the mean size of household landholdings was 5.5 acres, with only about half (55.5 percent) having a consolidated landholding.
Socioeconomic Characteristics of the Cereals Farmers

Source: Field Survey, 2017.
Comparing the three categories of farmers as shown in Table 3, there is no discernible or striking difference in their socioeconomic profiles. However, the typical maize farmer was found to be slightly younger (44 years), a bit more educated (8 years of schooling), the household had slightly larger landholdings (6.3 Ha), and the farmland is also more likely to be fragmented (50.9 percent) than those of the typical rice farmer. This shows that farmers in the country are most likely similar in their socioeconomic characteristics, with the choice of crop(s) most likely defined by agro-ecological conditions and/or crop(s) that is/are most suitable to the farmers’ landholding.
Land Tenure and Property Rights of the Rice/Maize Farmers
The maize and/or rice farmers interviewed in the study supplied plot level information on a total of 2,579 parcels of land that were cultivated by members of their farm households during the 2016/2017 farming season. Table 4 summarizes the farmland characteristics in terms of the size, mode of acquisition, the property rights enjoyed by the households on those lands, and the status of registration on those parcels.
Distribution of Cultivated Parcels by Tenure Characteristics

Source: Field Survey, 2017.
As shown in Table 4, the average parcel size was 3.47 acres with the majority (about 54 percent) inherited, while 16 percent of the parcels were purchased, 19 percent on leasehold, and 13 percent were communal lands. Table 4 also shows that majority (64–78 percent) of the plot managers believed they possess most of the rights needed to make medium- to long-term investment on the parcels, with as much as two-thirds believing they could sell or bequeath the land to others. However, results further show that only 18 percent of the parcels had boundary surveys while only 3 percent had their title registered at the State land registry. Meanwhile, another 8 percent of the parcels were reported as registered with some traditional institutions and 5 percent with the LGA. The main import of these results is that while the majority of the farmers do not perceive any risk to the long-term use of their farmland, with transfer rights enjoyed in about two-thirds (67 percent) of the cases, only a few (3 percent) of the land titles were duly registered. They are thus prone to unfair expropriation and land grabbing.
Use of AP-CSAPs among Rice/Maize Farmers in Nigeria
Given the central interest of this study is AP-CSAPs, existing patterns of use of these practices, and the results summarized in Table 5. The results revealed a generally low level of AP-CSAPs use among maize and/or rice farmers in Nigeria. However, we found that zero tillage, FYM/compost, and residue retention were the three most widely adopted AP-CSAPs. These were respectively used on about 41 percent, 35 percent, and 41 percent of the parcels, whereas green manure and crop rotation were practiced on 15 percent and 19 percent, respectively, of the parcels.
Use of Selected AP-CSAPs on Cultivated Parcels by Crop
Source: Field Survey, 2017.
Econometric Results
This section presents results of econometric data analyses with respect to the CE conducted to assess the influence of CSA schemes’ attributes and other factors on farmers’ WTA incentives to embrace CSA and combat land degradation. Key factors whose influence were examined include the farmers’ socioeconomic characteristics, LTPRs, income, labor availability at the household level, soil and climatic conditions as proxies for agro-ecological zones. The results in respect of the estimated REL and weighted RPL models are summarized in Table 6. We discuss the results under the following subheadings:
Estimated Random-effect and Weighted RPL Model of Farmers’ WTA Incentives
Source: Field Survey; 2017.
Note: ***, **, * represent statistical significance at 1%, 5%, & 10%. Number of observations: 17070.
Preference for Measures to Combat Land Degradation
There were 17,070 choice observations included in the model estimation, with data on 1,138 respondents each with 15 choice sets (three options per task and five tasks). As shown in Table 6, the estimated constant terms were negative and strongly significant (p < 0.01) in all versions of the models estimated. This reveals an implicit dissatisfaction with the status quo, suggesting strong WTA incentives to embrace CSA among the farmers.
In line with a priori expectation, a higher incentive level was found to be significantly associated with the likelihood that a farmer will accept an offer to shift to a CSA option. This confirms the expected positive supply response to increase in value of the incentives that may be provided to the farmers to invest in CSA that have the potential to sequester carbon, while promoting soil health and raising productivity and income. This is in consonance with Schulz, Breustedt, and Latacz-Lohmann (Reference Schulz, Breustedt and Latacz-Lohmann2014), in which higher payment increases the likelihood of “greening” being preferred to opt-out option.
Influence of Choice Attributes: CSA Scheme, Payment Vehicle and Management
Three CSA options were evaluated in this study: agroforestry, GAPs with manure application and GAPs without manure application. Of these, agroforestry has the largest potential to sequester carbon followed by GAPs with manure. However, the labor requirement may be much higher on farms that may have to apply manure, which is also not readily available in most part of the country at the scale required. Results in terms of farmers’ preference (WTA incentives) to embrace the three CSA options on Table 6, suggest, ceteris paribus, that virtually all the attributes related coefficients were significant at 1 percent level in the REL model and only that of GAPs with manure in RPL model. In general, coefficients of the GAPs with manure were higher than obtained for other options. This would imply that farmers CSA preferences are significantly influenced by CSA type (characteristics), with farmers showing stronger willingness to trade off manure use in favor of other CSA options.
Focusing on preferences for mode of incentive payments, cash and/or in-kind, results on Table 6 suggest that farmers’ preferences are not significantly different with cash or in-kind payment, but expected WTA would be significantly much higher if the payment would be split into 50 percent cash and 50 percent in-kind. This will suggest a preference of one-off annual payment rather that split payments. In terms of the payment vehicle manager of the CSA schemes, all the coefficients were significant, mostly at 1 percent in both versions of the estimated models. We also found that coefficients associated with NGO-managed schemes were generally higher than those of CDA-led schemes, while coefficients of private sector-led schemes were found to be negative, suggesting a clear dislike for private sector managed PES schemes relative to the public sector-managed schemes (the reference group). These results suggest a higher willingness to trade off NGO- and CDA-led schemes for those managed by the public sector and a clear rejection of private sector-managed PES schemes.
Influence of Main Crop and LTPRs WTA Incentives
To examine the influence of main crop and LTPRs on farmers’ preferences for CSA Schemes, the level of these factors were interacted with CSA options in both the REL and RPL models. The results, focusing on the preferred RPL model, suggests that farmers’ preferences are largely indifferent across crop type, except for GAPs with manure for which rice farmers expressed a dislike, given the negative marginal utility. The results, in respect of LTPRs, of virtually all the parameters with respect to leased and communal lands were negative and significant, mostly at 10 percent level in the RPL model. These show that farmers who leased their lands and those who cultivated communal lands consider a shift to CSA as a source of negative utility for them and hence are significantly less likely to accept any financial incentive in that regard when compared to those who inherited and/or purchased their farmlands. While effects of land titling were generally positive on WTA incentives, it was only significant in the case of GAPs without manure and negative for agroforestry. This suggests that land titling may not be too important in promoting shift to CSA in Nigeria. However, while land titling may promote use of GAPs without manure; it tends to discourage a shift to agroforestry.
Influence of Income, Labor Availability, Community, and Agro-Ecological Variables
Results on Table 6 shows that preference for CSA schemes were significantly more likely with farming households residing in south-south GPZ as against those in northeast GPZ. However, farmers’ location within the LAC moist and LAC dry agro-ecologies, group membership, household income and labor availability at the household level have no significant influence on farmers’ WTA incentives and shift to any CSA option.
Preference Heterogeneity as Revealed by RPL Regression Result
In Table 6, the standard deviations (SD) of GAPs without and with manure, agroforestry, CDA and private attributes were all significant across the models, which means that there was significant variation among responses, or heterogeneity within the sample. However, the SD for some of the random coefficients such as cash and in-kind alongside interaction of CSA scheme with registered land were not significant. This explains why some of the estimated coefficients for these attributes were not significant or less significant in this model.
The SD of Table 6 demonstrates the heterogeneity in farmers’ preferences for various interactions with agroforestry, for GAPs with or without manure attributes. Virtually all of the estimated standard deviations were statistically significant, indicating a clear rejection of homogeneous preferences (that is, fixed coefficients) for these attribute levels.
Marginal WTA Incentives for Measures to Combat Land Degradation
Table 7 presents estimates of the marginal WTA (WTP) associated with various investments and options based on parameter estimates from Table 6. Please note that we represented results of the wtp command, such that figures in parentheses are WTP estimates in cases where preference was expressed for the status quo. All other things being equal, the marginal WTA figures for the three CSA options by the average farmer in Nigeria are N38,625.19 (US$122.62) per hectare for GAPs with manure, N6, 977.76 (US$22.21) per hectare for GAPs without manure, a WTP of N1,620.83 (US$5.15) per hectare to avoid shift to agroforestry.
Estimated Marginal WTA Incentives to Invest in Measures to Combat Land Degradation
Source: Field Survey; 2017.
Further evidence showed that while the average farmer would accept positive incentives to shift to CSA, preferences differ widely based mainly on LTPRs and crop types. A typical rice farmer would rather pay some taxes to avoid a shift to GAPs with manure application. The same scenario applies to an average farmer who leased or is allowed to use communal land. All other categories of farmers expressed positive WTA incentives to embrace CSA.
Summary and Conclusions
This study has contributed to literature on the influence of LTPRs on farming households’ WTA incentives to invest in measures to combat land degradation in Nigeria using CEs. LTPRs was analyzed on plot level and is summarized as the farmland characteristics in terms of the size, mode of acquisition, the property rights enjoyed by the households on those lands, and the status of registration on those parcels. The average parcel size was 3.47 acres, of which about 54 percent of the parcels were inherited, 16 percent were purchased, 19 percent were leased, and 13 percent were communal lands. The majority (64-78 percent) of the plot managers believed they possessed most of the rights needed to make medium- to long-term investment on the parcels, with about two-thirds believing they could sell or bequeath the land to others. However, LTPR results show that only 3 percent of the farmers had registered title on their farmland, with most of the claims on farmland susceptible to unfair expropriation by the government, in view of the Land Use Act.
Using both unweighted REL and weighted RPL models, we analyzed the effect(s) of CSA characteristics, payment vehicle, management institutions, and LTPRs, among other factors on farming households’ preferences for CSA options. The results revealed a general dissatisfaction with the status quo, and WTA incentives to embrace CSA. The results confirmed that substantial preference heterogeneity exists with respect to CSA choices and the determinants among the maize and/or rice farmers in Nigeria. All other things being equal, the marginal WTA figures for the three CSA options by the average farmer in Nigeria are N38,625.19 (US$122.62) per hectare for GAPs with manure, N6, 977.76 (US$22.21) per hectare for GAPs without manure, and a WTP of N1,620.83 (US$5.15) per hectare to avoid a shift to agroforestry.
We found that there is a strong linkage between the farmers’ preference for CSA scheme and the payment vehicle. Hypothetical PES schemes managed by the government were found to be the most preferred, followed by those managed by CDAs and NGOs, while private sector-managed schemes were generally rejected. LTPRs were found to exert significant impacts on WTA incentives to embrace CSA schemes. Farmers who leased or cultivated communal land were significantly not willing to embrace any CSA option, unlike the majority who inherited or purchased their farmlands. However, while land titling has positive influence on likelihood of accepting incentives to embrace CSA, the effects are mostly insignificant. The results suggest the need to promote private land ownership in strengthening rural land governance towards sustainable land use and agricultural production in Nigeria.
We wish to acknowledge that our failure to base the design of our CE on a priori power calculation, which remains a major challenge with CE studies in general (de Bekker-Grob et al. Reference de Bekker-Grob, Donkers, Jonker and Stolk2015), is not the best practice. We would also have loved to explore and possibly correct for the influence of possible correlations between LTPRs and factors such as wealth, tribe, and social factors in our modelling, but this we could not do due to software limitations. These notwithstanding, we opine that our study has made significant contributions to knowledge of the subject matter.
Acknowledgements
This material is based upon work supported by the Economic Community of West African States (ECOWAS) with funding support of the French Development Agency (AFD), under Agreement No: 18_AP3_TH3/2016/ECOWAS/AEWR /RAAF/PASANAO. The project development has also benefitted from a wide range of capacity building support of the African Growth & Development Policy (AGRODEP) modeling consortium, facilitated by International Food Policy Research Institute (IFPRI), Washington, DC. The lead author is indeed very grateful to AGRODEP Management Team and IFPRI for this privilege. The views expressed are the authors’ and do not necessarily represent the policies or views of any sponsoring agencies.
APPENDIX 1
Statistical Power Evaluation
A reviewer suggested the need to present the power analysis behind the CE conducted in the study, hence this appendix. Please note that the sample size for the study was based on preliminary information collected during the series of pilot tests conducted in the study and our budget constraint. Results of the pilot tests suggested that adoption rates of various AP-CSAPs among the targeted farmers may range between 20 percent and 50 percent, which at 5 percent level of significance (α = 0.05) and targeting a 95 percent power (1 − β = 0.95) suggest the minimum sample needed to estimate adoption rates of various AP-CSAPs is 272. The minimum sample was computed with G*Power 3 (Faul et al. Reference Faul, Erdfelder, Lang and Buchner2007). This evidence, coupled with the desire to generate AEZ level disaggregated statistics within the limit of the survey budget, caused the decision to fix the target sample per AEZ at 300, and 1800 nationwide.
We note however, following de Bekker-Grob et al. (Reference de Bekker-Grob, Donkers, Jonker and Stolk2015), that if information is available on the effect size (δ k = |γ k|) and variance (Σγk) of the parameter of an attribute (k) in a discrete CE, the minimum sample needed to achieve a desired power (1 − β) in its estimation at (1 − α) confidence level is:
 $$N \gt \lpar \lpar Z_{1 - \beta} + Z_{1 - \alpha} \rpar \sqrt {\Sigma _{\gamma k}} /\delta _k\rpar ^2$$
Re-arranging the terms in this expression, we find that:
 $$Z_{1 - \beta} \lt \sqrt N \left ({\displaystyle{{\delta_k} \over {\sqrt {\Sigma_{\gamma k}}}}} \right ) - Z_{1 - \alpha} = Z_{1 - \alpha} \lpar \sqrt N - 1\rpar = z^{\ast}$$
 Note that  $\sqrt {\Sigma _{\gamma k}} $ is the standard error of the estimated parameter γ k, while $\delta k/\sqrt {\Sigma _{\gamma k}} = Z_{1 - \alpha} $, which is the absolute value of the asymptotic Z-ratio achieved in estimation of γ k. We thus, opine that achieved statistical power for estimated parameter in DCE may be evaluated as:
 $$1 - \hat {\rm \beta} \gt F\lpar z^{\ast} \rpar = \Pr \lpar z \le z^{\ast} \rpar $$
We thus applied equations 9 and 10 in a post-hoc evaluation of parameters of our RPL model. The lowest z* we got was 1.67, while all except one of the estimated parameters were associated with z* values greater than 1.96 (Table 6). This shows therefore, that at least 95 percent power was achieved in most of the RPL parameter estimates except in one, whose statistical power is also larger than 90 percent.


 Open access