


INTRODUCTION
Q fever is a globally distributed zoonotic infection caused by Coxiella burnetii (C. burnetii). The inhalation of contaminated aerosols is the main route of infection in humans. These aerosols originate from the excretions and birth products of infected animals such as sheep, goats and cattle. The materials can then contaminate dust particles which, driven by the wind, go on to infect humans [Reference Maurin and Raoult1]. It is assumed that in humans, nearly 60% of Q fever cases are asymptomatic [Reference Maurin and Raoult1]. During an outbreak of Q fever in Switzerland 224 of the 415 (54%) serologically confirmed cases were asymptomatic [Reference Dupuis2]. The majority of symptomatic cases result in a mild influenza-like illness, but they can also develop into more severe manifestations such as pneumonia and chronic disease [Reference Maurin and Raoult1, Reference Dupont, Thirion and Raoult3, Reference Bartelink4]. The diagnosis of acute Q fever relies mainly on the detection of antibodies of IgM and IgG subclasses directed to phase II C. burnetii, while chronic Q fever is indicated by high titres of phase I IgG antibodies. The sole presence of phase II IgG antibodies against C. burnetii indicates previous or past infection [Reference Dupont, Thirion and Raoult3, Reference Waag5]. Because asymptomatic or mild cases might go unnoticed, the true prevalence of C. burnetii infections can only be estimated by the detection of these antibodies in human sera. Antibodies against C. burnetii can be detected by enzyme-linked immunosorbent assay (ELISA), complement fixation test (CFT) or immunofluorescent assay test (IFAT), of which the latter has been proclaimed as the reference method in the literature for the serodiagnosis of Q fever [Reference Dupont, Thirion and Raoult3, Reference Fournier, Marrie and Raoult6]. IFAT is more laborious, whereas ELISA can be better automated, making it better suited to the testing of large numbers of samples. However, the choice of test to measure seroprevalence is under debate because these tests have not been validated for this use and because different cut-off titres have been used in various studies [Reference Kilic7–Reference Bolanos10].
Starting in 2007, an outbreak in the village of Herpen in the south of The Netherlands heralded a large Q fever outbreak, with 168 notified human cases in 2007, followed by 1000 in 2008 and >2300 in 2009 [Reference Karagiannis11–Reference Schimmer15]. To investigate the source and routes of transmission in the 2007 outbreak, a case-control study was conducted in 2007 in the village, where most of that year's cases originated [Reference Karagiannis12]. Serum samples taken as part of this outbreak investigation were used to evaluate the performance of an ELISA against an IFAT – both as a diagnostic tool and for seroprevalence surveys.
MATERIALS AND METHODS
In total 487 serum samples were tested by IFAT and ELISA. Sera were taken from 473 individuals in the village of Herpen (in the municipality of Oss), the epicentre of the 2007 outbreak. These individuals took part in a frequency-matched case-control study in September 2007, about 4 months after that year's peak incidence [Reference Karagiannis12]. Thirty of these individuals had been identified as cases previously [Reference Karagiannis12]. Additional samples were taken from the sera of suspected cases tested elsewhere with CFT (n=7) and of a farmer's household working at a farm with infected livestock (n=7). Samples were tested for the presence of IgM and IgG antibodies against phase II of C. burnetii using a commercial IFAT (Focus Diagnostics, USA), according to the manufacturer's instructions. All samples were first tested at an initial screening dilution of 1:64. Positive samples were further tested at titres of 1:512 and 1:1024. For primary analysis in this study, samples with a titre of ⩾1:64 were considered positive. This cut-off titre is a compromise of the manufacturer's instructions, which sets the cut-off titre at 1:16 if both phase I and II IgG are positive and at 1:256 for a solitary phase II IgG. Cut-off levels for this IFAT are under debate, so the effect of using a higher cut-off titre of 1:512 was also investigated [Reference Villumsen16]. The same sera were also tested for the presence of IgG and IgM antibodies against phase II C. burnetii with a commercial ELISA (Serion Immundiagnostica, Germany), according to the manufacturer's instructions. Following the manufacturer's instructions, phase II IgG antibody levels <20, 20–30 and >30 IU/ml were scored as negative, borderline-positive or positive, respectively. In further comparisons of the IFAT and ELISA, borderline-positive ELISA results were considered as positive. The kappa values for ELISA and IFAT were calculated for IgM and IgG antibodies separately. The sensitivity and specificity of the ELISA test for both IgM and IgG were calculated taking IFAT as the reference method. In this respect, the ELISA was evaluated against IFAT cut-off titres of 1:64 and 1:512. The status of infection was defined in terms of recent infection, past infection or uninfected. Antibody titres equal to or above the cut-off level were considered positive. Recent infection was indicated by a positive phase II IgM titre with or without a positive phase II IgG titre. The sole presence of phase II IgG antibodies against C. burnetii indicated a past infection. When phase II antibodies were below the cut-off titre, samples were considered to be uninfected. The distinction between recent and past infections is of interest in the cases of an outbreak or a seroprevalence study, respectively. For both methods, seroprevalence was calculated by the percentage of past infections in the 487 tested samples.
RESULTS
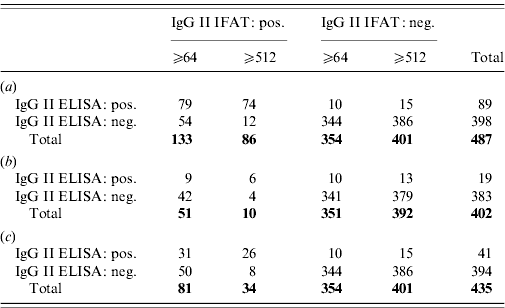
With IFAT, using a cut-off of 1:64, 133 samples were positive for phase II IgG. Of these, 79 (59%) were positive by ELISA, whereas 344 (97%) of the 354 IFAT negatives were also negative in the ELISA. In order to compare the two tests regarding past infections all IgM-positive samples as detected by IFAT (n=85 or n=52, cut-off titres 1:65 and 1:512, respectively) were excluded. In seroprevalence studies this would be the great majority of cases. Nine (18%) of the 51 IFAT IgG-positive samples were ELISA positive, whereas 341 (97%) of the 351 IFAT IgG-negative samples were ELISA negative. When using a cut-off of 1:512 for IFAT, 74 (86%) of the 86 IFAT IgG positives were ELISA IgG positive and 386 (96%) of 401 IFAT negatives were ELISA negative (Table 1).
IgM phase II ELISA and IFAT results
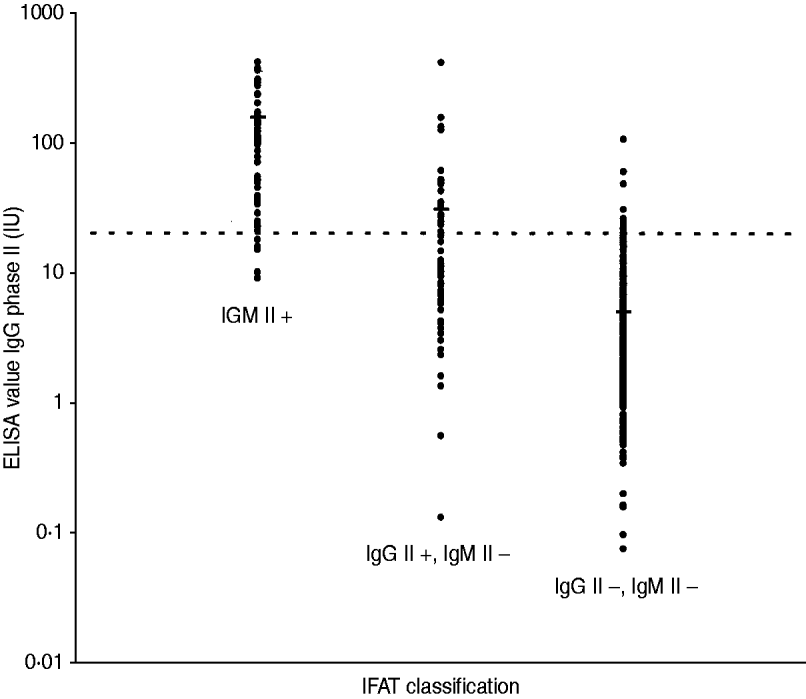
The kappa value of the two tests was 0·63 when a cut-off titre of 1:64 was used. Increasing the cut-off titre to 1:512 resulted in a kappa value of 0·81. When IgM-positive samples representing recent infection (n=85 or n=52) were excluded, the sensitivity of the phase II IgG ELISA decreased to 0·18 and 0·38, respectively in the case of a phase II IgG IFAT cut-off titre of 1:64, while specificity remained 0·97. Under these conditions, the kappa values between the two tests were 0·2 and 0·44. When an IFAT phase II IgG cut-off titre of 1:512 was used, the sensitivity of the phase II IgG ELISA was 0·60 and 0·76, respectively, while specificity remained almost equal at respectively 0·97 and 0·96. Kappa values of 0·39 and 0·66 were observed between the two tests. The difference in IgG ELISA values between the three groups of recent infections, past infections and seronegatives is shown in Figure 1.
IgG phase II antibody levels as determined by ELISA compared to status of infection: recent, past and no infection, as defined by IFAT, with mean values for each status. IgM phase II positive sera (n=85) represent recent infections. IgM phase II negative, but IgG phase II positive sera (n=51) represent past infections. IgM phase II and IgG phase II negative sera (n=341) represent individuals without infection. The dotted line represents the cut-off titre (20 IU/ml) for a borderline-positive ELISA result.
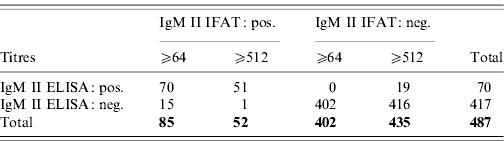
Regarding IgM, 85 serum samples were positive for IgM phase II antibodies with IFAT using a cut-off of 1:64, of which 70 (82%) samples were also found positive by ELISA. All 402 IFAT negatives were negative by ELISA as well. Using a cut-off of 1:512, 51 (98%) of 52 IFAT IgM positives were positive by ELISA, whereas 416 (96%) of 435 IFAT negatives were ELISA negative (Table 2).
(a) IgG phase II; (b) IgG phase II for IgM phase II negative sera (cut-off 1:64); (c) IgG phase II for IgM phase II negative sera (cut-off 1:512)
The kappa values between the two phase II IgM tests were 0·89 and 0·81, respectively.
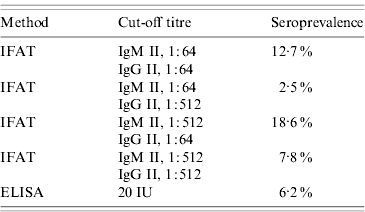
When IFAT (with a cut-off titre of 1:64 for both phase II IgM and IgG) was employed as method of choice for the detection of antibodies, seroprevalence was estimated at 12·7% (51/402). The application of an ELISA resulted in a seroprevalence estimate of 6·2% (26/417). The application of different cut-off titres for the two phase II subclasses of antibodies against C. burnetii resulted in different estimates of seroprevalence (Table 3).
Seroprevalence as determined by IFAT and ELISA at different cut-off titres
DISCUSSION
The performance of assays may differ significantly when used in different contexts, such as a diagnostic tool or as an instrument to measure seroprevalence. Earlier studies in the late 1980s and early 1990s reported that ELISA was a more sensitive and specific method then IFAT or CFT, when used for diagnostic purposes [Reference Cowley17, Reference Peter18]. Although this was debatable, IFAT became the preferred method of choice and even the reference method [Reference Maurin and Raoult1]. At that time, however, both ELISA and IFAT were ‘in-house’ methods that were not standardized. Recently, several commercially developed ELISAs and IFATs have become available [Reference D'Harcourt19–Reference Frangoulidis22]. Field et al. evaluated the performance of an ELISA IgG kit (Panbio) in relation to an ‘in-house’ IFAT. A sensitivity of 71% and specificity of 96% was observed, while the agreement between the two tests was moderate (53%) [Reference Field21]. Sanz et al. compared the Serion and Panbio ELISA kits with an ‘in-house’ IFAT in 53 samples of 29 patients [Reference Sanz23]. Sensitivity of the Serion IgG phase II ELISA kit was 89% while it was 72% for Panbio IgG phase II. Specificity was 97% for both kits. Both Sanz et al. and Field et al. employed a different IFAT as a reference method than the one we used. Other authors have employed their own ‘in-house’ IFAT to evaluate ELISAs, with different methods and/or cut-off titres [Reference D'Harcourt19, Reference Setinoyo24, Reference Slabá, Skultéty and Toman25].
Our study evaluated the performance of a commercial ELISA compared to a commercial IFAT, in the context of a large outbreak of human Q fever in the southeastern part of The Netherlands [Reference Karagiannis12]. To study the seroprevalence of Q fever, the detection of phase II IgG antibodies against C. burnetii in serum samples from patients with past infections is essential. In the context of an outbreak of human Q fever we considered samples with present phase II antibodies in the absence of IgM phase II antibodies against C. burnetii, as indicative of a past infection. From previous studies it is known that phase II IgG antibody levels remain at a constantly high level for almost a year and decrease slowly afterwards, remaining at detectable levels for years [Reference Dupont, Thirion and Raoult3, Reference Dupuis26]. As expected, IgG phase II antibodies are easily detectable by both IFAT and ELISA in recent infections, as shown in Figure 1. However, when sera are in a convalescent phase (as indicated by the absence of IgM phase II antibodies and the presence of just IgG phase II antibodies as determined by IFAT), most antibody levels, as determined by ELISA, fall below the cut-off titre (42/51). Increasing IFAT cut-off titres for both IgM and IgG to 1:512 improves agreement between ELISA and IFAT.
Although IFAT is often regarded as the reference method, that does not make it the true gold standard. Ideally, to establish cut-off levels for seroprevalence studies, samples should be tested from patients several years after a proven acute infection, as shown by seroconversion, in order to establish that low antibody levels are from a C. burnetii infection. This type of sera were not yet available to us at the time of our evaluations. Furthermore, cut-off levels established in literature from an in-house assay may not be directly applicable to other in-house or commercial assays such as the commercial IFAT used in this study. A recent study from Denmark proposed altering cut-off titres of the IFAT from the same manufacturer as our study to much higher levels, close to the 1:512 for IgG phase II analysed in our study. The proposed cut-offs were based upon the assumption that it was unlikely that 27% of healthy volunteers from an urban area were positive for one or more of the four types of antibodies tested (IgM phases I and II, IgG phases I and II). These authors proposed to take a titre above the 98th percentile of the values obtained from a healthy urban population as the new cut-off titre [Reference Villumsen16]. This would improve specificity, but the effect on sensitivity was not considered.
In our study, we evaluated the effect of an increase in the cut-off titres of the IFAT, as proposed by the Danish study. This resulted in better agreement between the ELISA and IFAT. However, it remains uncertain whether the increased specificity of a higher cut-off is not outweighed by the loss in sensitivity.
Because so many different assays and cut-off titres are used to detect antibodies against C. burnetii, it is difficult to compare incidence and seroprevalence in different countries and areas. Our study indicated a seroprevalence of Q fever in the village of Herpen that varies between 2·5% and 18·6%, depending on the method of antibody detection and cut-off chosen. In order to compare different values in so many seroprevalence studies (both published and unpublished), a standardized method should be developed to define optimal cut-off levels.
ACKNOWLEDGEMENTS
We thank Mr Krijn Haasnoot for his practical work with the IFAT experiments.
DECLARATION OF INTEREST
None.



