

Introduction
Analysis of ice cores provides critical information for determining past conditions on the planet, documenting changes in temperature and atmospheric chemistry (Reference Wolff, Moore, Clausen, Hammer, Kipfstuhl and FuhrerWolff and others, 1995), biomass burning and volcanic events (Reference McConnellMcConnell and others, 2007) and anthropogenic impacts (Reference McConnell and EdwardsMcConnell and Edwards, 2008). Fundamental to these studies is determining the age of the ice, i.e. how long ago the ice fell as snow on the surface. Continuous flow analysis (CFA; Reference Sigg, Fuhrer, Anklin, Staffelbach and ZurmühleSigg and others, 1994) provides high-resolution measurements of chemical species by progressively melting sticks of ice cut from the core and sampling the water with techniques like inductively coupled plasma mass spectrometry (ICP-MS) (Reference McConnell, Lamorey, Lambert and TaylorMcConnell and others, 2002) or ion chromatography (Reference Cole-Dai, Mosley-Thompson and ThompsonCole-Dai and others, 1997). CFA can readily identify seasonal variation in chemical properties, and multivariate chemical analysis provides very accurate annual dating (Reference Anklin, Bales, Mosley-Thompson and SteffenAnklin and others, 1998; Reference Banta and McConnellBanta and McConnell, 2007; Reference Banta, McConnell, Frey, Bales and TaylorBanta and others, 2008). CFA works very well in shallow firn/ice and in deep ductile ice. However, in brittle ice from intermediate depths at which air bubbles are forced into clathrates in the crystal structure, the ice cores shatter almost spontaneously and the physical integrity needed for CFA often cannot be maintained. In contrast, the dielectric properties (DEP) of the ice can be measured with a non-contact method to indicate annual variation in electrical conductivity, even in partially shattered brittle ice cores. DEP measures alternating current (a.c.) conductance continuously along the core. Several studies attribute the DEP signal to acidity and neutral salt concentrations (Reference Moore, Wolff, Clausen, Hammer, Legrand and FuhrerMoore and others, 1994; Reference Wilhelms, Kipfstuhl, Miller, Heinloth and FirestoneWilhelms and others, 1998), as well as density variations (Reference WilhelmsWilhelms, 2005). Working with data collected by the Greenland Icecore Project (GRIP; 72.58° N, 37.63° W), Reference Moore, Wolff, Clausen, Hammer, Legrand and FuhrerMoore and others (1994) found that electrical conductivity measurements were in large part explained by acidity, ammonium salts and chloride within the ice core. Chemical impurities deposited in the snow may represent timescales from long-term trends in atmospheric chemistry (Reference Wolff, Moore, Clausen, Hammer, Kipfstuhl and FuhrerWolff and others, 1995) to shorter-term seasonal cycles (Reference Moore, Wolff, Clausen and HammerMoore and others, 1992; Reference Curran, van Ommen and MorganCurran and others, 1998).
Numerous studies have used electrical conductivity or DEP as part of an ice-core dating strategy, though many of these depend on extracting volcanic peaks from a single ice core (Reference Karlöf, Øigård, Godtliebsen, Kaczmarska and FischerKaczmarska and others, 2005; Reference Karlöf, Øigård, Godtliebsen, Kaczmarska and FischerKarlöf and others, 2005) or aligning volcanic signals between multiple cores (Reference Wolff, Moore, Clausen, Hammer, Kipfstuhl and FuhrerWolff and others, 1995; Reference VintherVinther and others, 2006; Reference Rasmussen, Seierstad, Andersen, Bigler, Dahl-Jensen and JohnsenRasmussen and others, 2008) rather than identifying individual annual cycles. Annual snow layers will have varying thickness depending on the amount of precipitation, but sublimation, wind erosion/deposition and melt layers may also complicate the interpretation of annual cycles (Reference Wolff, Moore, Clausen, Hammer, Kipfstuhl and FuhrerWolff and others, 1995). The selection curve method presented here provides a consistent means of machine-assisted identification of annual layers in an ice core to increase the efficiency of DEP dating and provide a check on the consistency of manual interpretations. The method accounts for the complexities of the annual DEP signal that is non-stationary (e.g. changing average layer thickness) and potentially composed of multiple peaks of varying magnitude within a single season. While multi-parameter dating methods provide a more robust approach, DEP remains one of the few quantitative methods for identifying annual cycles in the brittle zone. This paper tests the selection curve method on DEP measurements beginning in the firn and continuing into the brittle zone of the WDC06A ice core of the West Antarctic ice sheet (WAIS) Divide project (79.467° S, 112.085° W) (http://waisdivide.unh.edu).
Methods
The selection curve method develops a spline curve whose shape is used in selecting successive annual peaks in plots of DEP. This spline curve must be scaled to the average annual layer thickness at a given depth, ![]() . Here we describe the datasets and the parameter estimation method and describe three methods that were tested for estimating
. Here we describe the datasets and the parameter estimation method and describe three methods that were tested for estimating ![]() and how the selection curve functioned.
and how the selection curve functioned.
Measurements
The dataset analyzed here covers 1200 m of the WDC06A ice core from 250 to 1450 m depth (∼1000 CE to 5600 BCE). The 12.2 cm wide core was drilled electromechanically, and sections of ice were extruded from the drill directly into plastic netting that maintained the physical structure of the core even through the brittle zone. DEP measurements were made at the drill site before the core was exposed to the possibility of physical damage during shipment. The DEP instrument used electrodes that wrapped 100° around the circumference of the core, forming a 5 mm wide capacitor with ice as the dielectric between the electrodes. The conductance at 100 kHz was measured using an Agilent E4980A LCR meter. Measurements were made every millimeter as the electrodes were moved along the core. The measurement was made through the plastic netting, which tightly held together any loose pieces of ice. Fractures in the core that were tight-fitting did not adversely influence the DEP measurement, though such ice could not be physically processed for continuous, high-resolution chemical measurement.
DEP measurements vary with the density and internal temperature of the ice core (Reference Wolff, Moore, Clausen, Hammer, Kipfstuhl and FuhrerWolff and others, 1995). Each ∼1 m section of the WDC06A core had a consistent temperature history and internal temperature, but there were temperature differences among 1 m sections. This dataset had already been normalized to compensate for these changes. For each 1 m section, the mean DEP was subtracted and resulting values were divided by the average absolute value so the normalized series had a mean of 0 and an average absolute value of 1. This type of normalization would be expected to create occasional small false peaks at section boundaries owing to imprecision in the adjustments. However, missing data at the section breaks and deletion of edge effects where the electrodes encountered and departed each section generally ensured that the gradient across section gaps was larger than the imprecision in matching sections, so such false peaks were infrequent.
For calibrating and testing the selection curve method, two experienced analysts independently interpreted plots of DEP versus depth and separately recorded their interpretation of annual peaks for the WDC06A core. The total annual counts for the analysts’ initial interpretations were very similar at 6153 and 6151, but the two diverged on their way to that total. Using a 20 year moving average of widths between successive counts as an estimate of actual annual-layer thickness, the mean absolute difference in annual counts across all depths was 6.3 years with a standard deviation of 9.4 years, representing <1% difference between analysts. The analysts jointly reconciled the two visual interpretations into one list of 6152 annual peaks between 250 and 1450 m depth. The sensitivity of results to calibration inputs was tested by analyzing variability among four different lengths of calibration data (12.5, 25, 50 and 100 m) extracted from this list of annual picks at six depths in the core (262, 622, 712, 862, 1162 and 1312 m). These depths were selected to cover a wide range and to avoid any sections of missing data.
Parameter estimation
Parameter estimation was performed using the multi-objective complex (MOCOM) global optimization method of Reference Yapo, Gupta and SorooshianYapo and others (1998) that had been successfully applied in a previous ice-core study (Reference McGwire, McConnell, Alley, Banta, Hargreaves and TaylorMcGwire and others, 2008). MOCOM starts with multiple sets of input parameters whose values are randomly distributed. Each parameter set is independently run through the program being optimized, and the outputs are evaluated with a set of user-defined objective functions (e.g. root-mean-square error (RMSE), bias). Using a downhill search method, each parameter set is independently optimized with respect to these objective functions. The process continues until every parameter set is optimal with respect to at least one objective function (Pareto-optimal). The multiple Pareto-optimal solutions represent trade-offs between the objective functions (e.g. lower RMSE at the cost of higher bias).
Estimating average layer thickness
The average layer thickness at a given depth, ![]() , varies throughout an ice core owing to changes in net snowfall and other climate variables at the time of deposition, increasing compression with burial, and eventually by flow-induced layer thinning. Three methods were tested for estimating
, varies throughout an ice core owing to changes in net snowfall and other climate variables at the time of deposition, increasing compression with burial, and eventually by flow-induced layer thinning. Three methods were tested for estimating ![]() : (1) fitting a polynomial to the average layer thickness of a few calibration segments from different depths, (2) using a running mean of prior annual picks and (3) Fourier analysis. The first method used a second-order polynomial and was evaluated using either three or five equally spaced calibration segments that were 50 m in length. The two polynomial fits were very similar, so the three-segment approach (depths 200–250 m, 800–850 m, 1400–1450 m) was selected as representing a more reasonable level of effort for calibration. While capturing the overall change in
: (1) fitting a polynomial to the average layer thickness of a few calibration segments from different depths, (2) using a running mean of prior annual picks and (3) Fourier analysis. The first method used a second-order polynomial and was evaluated using either three or five equally spaced calibration segments that were 50 m in length. The two polynomial fits were very similar, so the three-segment approach (depths 200–250 m, 800–850 m, 1400–1450 m) was selected as representing a more reasonable level of effort for calibration. While capturing the overall change in ![]() due to compression and thinning, the polynomial could only capture the coarsest scale of changes in
due to compression and thinning, the polynomial could only capture the coarsest scale of changes in ![]() due to climate.
due to climate.
The second option of using a running mean of prior annual picks to estimate ![]() provided a convenient approach that was integrated directly into the calibration of the selection curve by including an additional parameter, N, as the number of prior years used in the running mean (range 15–60 years). The running mean of prior picks provided a way to capture continuous low-frequency variation in
provided a convenient approach that was integrated directly into the calibration of the selection curve by including an additional parameter, N, as the number of prior years used in the running mean (range 15–60 years). The running mean of prior picks provided a way to capture continuous low-frequency variation in ![]() , but since it was retrospective it could fall ‘out of sync’ with dynamic changes in
, but since it was retrospective it could fall ‘out of sync’ with dynamic changes in ![]() .
.
Finally, ![]() was estimated by Fourier analysis of the DEP dataset prior to running the selection curve program. Fourier analysis provides a continuously varying, physically based method that utilizes the entire dataset in a consistent manner. In this study, a 10 m wide sliding window was stepped through the DEP dataset to plot changes in the fast Fourier transform (FFT) power spectrum with depth (Fig. 1). Darker regions in Figure 1 represent higher FFT intensities at a given frequency and depth in the core. The power spectra are noisy because the FFT is sensitive to abrupt discontinuities in the data, and there are multiple signals at seasonal and annual timescales within the sliding window. Peaks from these multiple frequencies are also mirrored at harmonic frequencies. Despite this noise, a visible trend in peak power values down the core in Figure 1 corresponds well with expected changes in
was estimated by Fourier analysis of the DEP dataset prior to running the selection curve program. Fourier analysis provides a continuously varying, physically based method that utilizes the entire dataset in a consistent manner. In this study, a 10 m wide sliding window was stepped through the DEP dataset to plot changes in the fast Fourier transform (FFT) power spectrum with depth (Fig. 1). Darker regions in Figure 1 represent higher FFT intensities at a given frequency and depth in the core. The power spectra are noisy because the FFT is sensitive to abrupt discontinuities in the data, and there are multiple signals at seasonal and annual timescales within the sliding window. Peaks from these multiple frequencies are also mirrored at harmonic frequencies. Despite this noise, a visible trend in peak power values down the core in Figure 1 corresponds well with expected changes in ![]() . It should be possible to manually interpret a path or to fit a polynomial trend through the peak frequencies. We developed an automated method to follow peaks in the FFT power spectra that allowed dynamic changes in response to relatively short depth/timescale phenomena. The starting frequency was manually estimated. Then a triangular search area was calculated that covered the upcoming half of the 10 m sliding window in depth and an increasing range of frequencies up to ±50% change in thickness. This is illustrated at the bottom of Figure 1. As the method progressed through the depth series, peak values of the log-transformed power spectra within the search area were down-weighted so that:
. It should be possible to manually interpret a path or to fit a polynomial trend through the peak frequencies. We developed an automated method to follow peaks in the FFT power spectra that allowed dynamic changes in response to relatively short depth/timescale phenomena. The starting frequency was manually estimated. Then a triangular search area was calculated that covered the upcoming half of the 10 m sliding window in depth and an increasing range of frequencies up to ±50% change in thickness. This is illustrated at the bottom of Figure 1. As the method progressed through the depth series, peak values of the log-transformed power spectra within the search area were down-weighted so that:

where W is the weighted value of FFT intensity, p is the original FFT intensity, d is the distance in depth as a proportion of search extent, Y is the calibrated exponent for decay of W in depth dimension, f is the absolute change in frequency as a proportion of search extent and F is the calibrated exponent for decay of W in frequency dimension.
The method for estimating ![]() from a plot of FFT power spectra versus depth. The grayscale background indicates distribution of FFT intensities at different frequencies. The solid curve indicates the selected frequency,
from a plot of FFT power spectra versus depth. The grayscale background indicates distribution of FFT intensities at different frequencies. The solid curve indicates the selected frequency, ![]() , at each depth for one run of the algorithm. The diagram extending from the end of this curve represents the method’s search area.
, at each depth for one run of the algorithm. The diagram extending from the end of this curve represents the method’s search area.
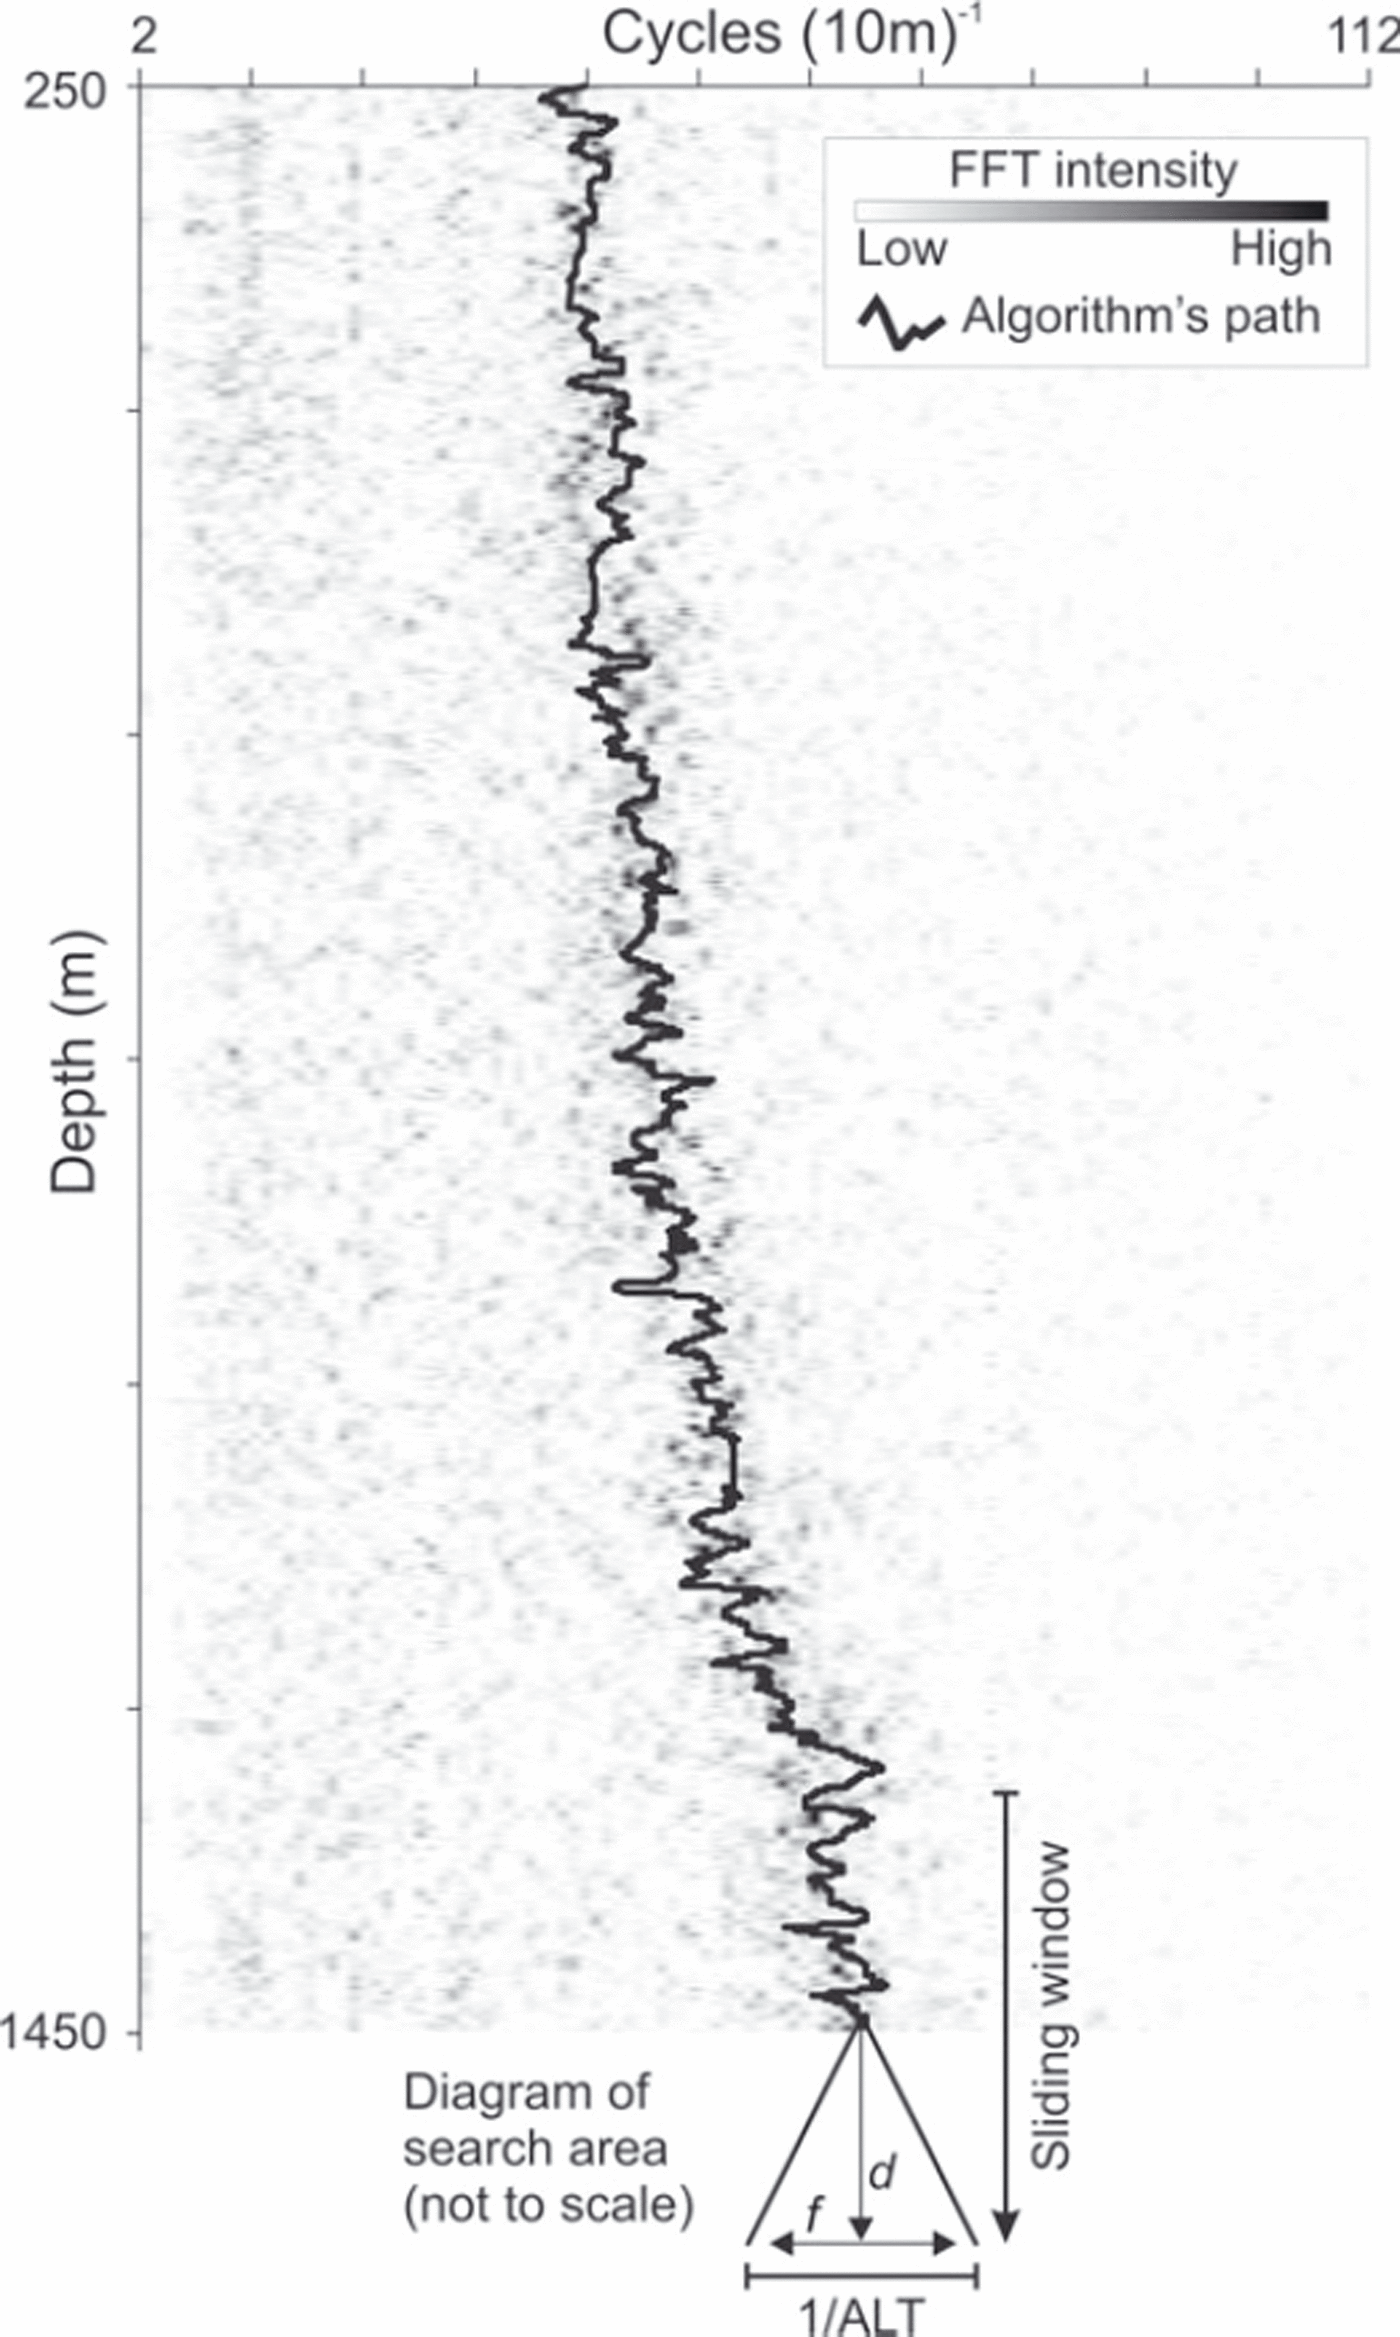
A change vector was calculated to adjust ![]() towards the greatest W; however, to reduce the influence of noise, the magnitude of this change vector was divided by an inertia parameter, I. The three free parameters of the FFT tracing method (Y, F and I) were calibrated using the MOCOM method, minimizing both the absolute bias in
towards the greatest W; however, to reduce the influence of noise, the magnitude of this change vector was divided by an inertia parameter, I. The three free parameters of the FFT tracing method (Y, F and I) were calibrated using the MOCOM method, minimizing both the absolute bias in ![]() for the entire calibration segment and the RMS difference from the manual thicknesses observed within the running window. For calibration, the FFT method stepped from one manual annual pick to the next, and the accumulated error statistics were passed to MOCOM at the end of the program run. Once calibrated, the FFT method calculated individual
for the entire calibration segment and the RMS difference from the manual thicknesses observed within the running window. For calibration, the FFT method stepped from one manual annual pick to the next, and the accumulated error statistics were passed to MOCOM at the end of the program run. Once calibrated, the FFT method calculated individual ![]() estimates at discrete depths down the core with spacing equal to the average layer thickness of the calibration data. Continuous estimates of
estimates at discrete depths down the core with spacing equal to the average layer thickness of the calibration data. Continuous estimates of ![]() were interpolated linearly between these discrete steps. An example of results from the tracing method is shown with the solid curve in Figure 1.
were interpolated linearly between these discrete steps. An example of results from the tracing method is shown with the solid curve in Figure 1.
Selection curve definition and calibration
The selection curve method is designed to mimic the manual process of interpreting annual layers. Figure 2 illustrates how the method uses a spline curve to identify the most probable peak to represent an annual cycle. An artificial datum (B in Fig. 2) is established above a series of DEP measurements from which a spline curve drops towards the observed data. This spline curve describes a balance between the expected magnitudes and spacings of annual peaks. The length of the spline curve is ![]() . This length was expected to be sufficient, given that the greatest ratio of a single annual thickness to the corresponding 20 year running mean in a draft CFA-based timescale of the WDC06A core from 250 to 450 m was 1.7. The greatest difference, D, between the spline and the datum occurs at
. This length was expected to be sufficient, given that the greatest ratio of a single annual thickness to the corresponding 20 year running mean in a draft CFA-based timescale of the WDC06A core from 250 to 450 m was 1.7. The greatest difference, D, between the spline and the datum occurs at ![]() . Two control points on the spline are positioned at some proportion (S1, S2) of
. Two control points on the spline are positioned at some proportion (S1, S2) of ![]() , and their values are both a fraction, M, of D. These two control points are adjusted to control symmetry and to make the selection curve more sharp or blunt. A Kochanek–Bartels spline (Reference Kochanek and BartelsKochanek and Bartels, 1984) with a tensioning parameter of 0.5 provided a smooth interpolation while preventing large excursions between the defined points.
, and their values are both a fraction, M, of D. These two control points are adjusted to control symmetry and to make the selection curve more sharp or blunt. A Kochanek–Bartels spline (Reference Kochanek and BartelsKochanek and Bartels, 1984) with a tensioning parameter of 0.5 provided a smooth interpolation while preventing large excursions between the defined points.
The lower curve represents a series of filtered, normalized DEP measurements. The upper curve represents the selection curve (B: datum; ![]() : average layer thickness; D: curve amplitude at
: average layer thickness; D: curve amplitude at ![]() ; S1/S2: curve control points as a proportion of
; S1/S2: curve control points as a proportion of ![]() : value of curve at S1 and S2 as a fraction of D). The shortest distance, Hi
, between local maxima in DEP and the selection curve is used to identify the annual peak.
: value of curve at S1 and S2 as a fraction of D). The shortest distance, Hi
, between local maxima in DEP and the selection curve is used to identify the annual peak.

Prior to using the selection curve, a low-pass filter is applied to the DEP dataset to reduce much of the high-frequency, sub-annual information that would be irrelevant to the selection of annual layers. The full-width, half-maximum (FWHM) value of this low-pass sinc filter is an adjustable percentage, P, of ![]() and uses a Blackman window to avoid aliasing (Reference SmithSmith, 2002). Since
and uses a Blackman window to avoid aliasing (Reference SmithSmith, 2002). Since ![]() varies with depth, the low-pass filter is recalculated and applied separately to each local segment of data
varies with depth, the low-pass filter is recalculated and applied separately to each local segment of data ![]() before applying the selection curve. Any peaks (local maxima) that remain after filtering are candidates for selection. The filtered DEP peak that has the least difference from the value of the spline curve, Hi
, at that depth is selected as an annual peak. In the illustrated example, H
3 is selected. Then the selection curve is shifted to start at this new annual peak (H
3 becomes prior pick in Fig. 2), and the process is repeated. In regions of completely missing data, annual steps are assigned at intervals equal to
before applying the selection curve. Any peaks (local maxima) that remain after filtering are candidates for selection. The filtered DEP peak that has the least difference from the value of the spline curve, Hi
, at that depth is selected as an annual peak. In the illustrated example, H
3 is selected. Then the selection curve is shifted to start at this new annual peak (H
3 becomes prior pick in Fig. 2), and the process is repeated. In regions of completely missing data, annual steps are assigned at intervals equal to ![]() . At this time there is no logic to deal with smaller amounts of missing data specifically in the vicinity of
. At this time there is no logic to deal with smaller amounts of missing data specifically in the vicinity of ![]() , assuming that these cases will be relatively infrequent and that forced picks at shorter or longer distances will tend to cancel out.
, assuming that these cases will be relatively infrequent and that forced picks at shorter or longer distances will tend to cancel out.
Because the selection of annual peaks is based on a simple difference, the spline curve’s datum is set to an arbitrary large value. The remaining five parameters of the selection curve method (D, S1, S2, M and P) were calibrated using MOCOM. MOCOM calculated a set of solutions representing Pareto-optimal trade-offs between three objective functions: (1) the sum of squared differences in depth from the manual calibration picks to the closest selection curve pick, (2) the sum of squared differences in depth from selection curve picks to the closest manual pick and (3) the difference in annual counts between the automated and manual interpretations. Early attempts to directly minimize just the difference in annual counts between the automated and manual interpretations were found to bias the selection curve shape too dramatically to the specific calibration dataset, so the MOCOM solution that best balanced the two sum-of-squares measures was selected. The difference in annual counts was only included to ensure that if multiple parameter sets had the same balance in sum of squares, the one with the least difference in annual counts was employed. In addition to identifying the level of agreement on the position of specific picks, objective functions 1 and 2 captured the trade-off between errors of omission (manual pick has no corresponding selection curve pick) and commission (selection curve pick has no corresponding manual pick). Omissions will create larger differences between manual picks and their closest automated pick for the first objective function, while commissions will have smaller, but more numerous, differences in the second objective function.
Results and Discussion
Figure 3 illustrates a small portion of one run of the selection curve program. This range of depths was selected to show a case where the selection curve method picked one more and one less annual count than the manual interpretation. The average calibrated FWHM of the low-pass sinc filter was ![]() , and Figure 3 shows a typical filtering result.
, and Figure 3 shows a typical filtering result.
A portion of the selection curve analysis, showing original and filtered DEP, annual peaks selected by manual and selection curve methods, and the specific selection curve for each automated pick.

Comparison of selection curve methods with the consensus interpretation
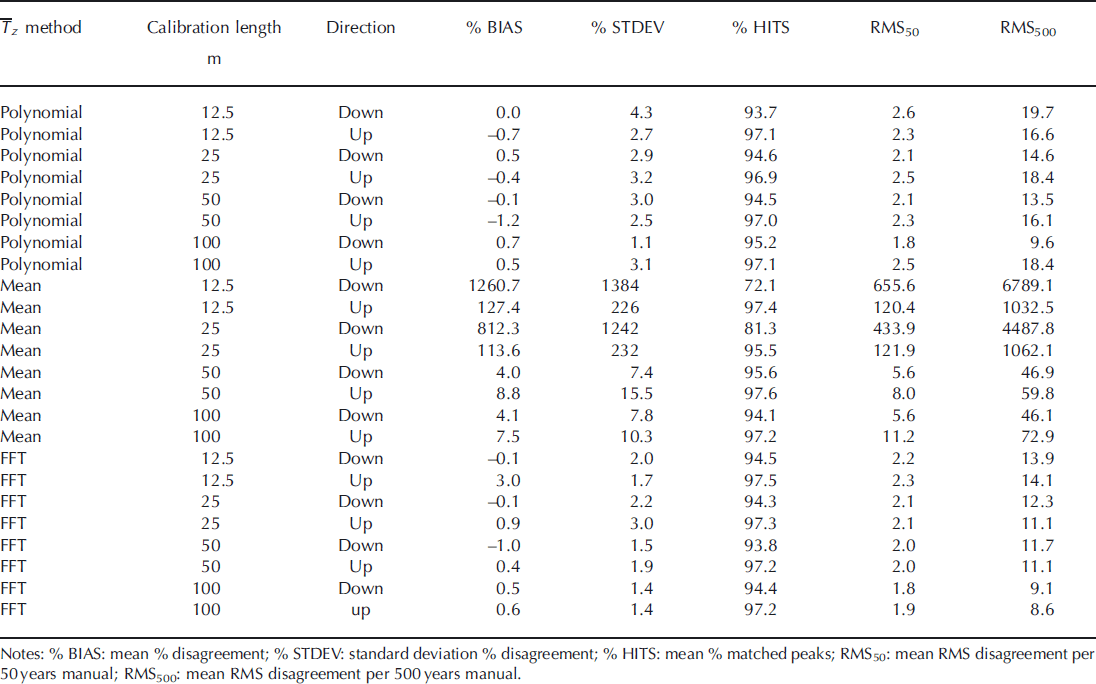
In order to test the accuracy and stability of the method, selection curves were calibrated separately to combinations of the three methods for estimating ![]() , four lengths of calibration data, six depths in the core, and running downwards versus upwards on the core. Each calibration was applied to the WDC06A core from 250 to 1450 m, and Table 1 describes the level of agreement with the manual interpretation. The average percentage difference in total annual counts (BIAS) from the manual interpretation indicated potential bias. The standard deviation of the percentage difference in total annual counts (STDEV) indicated the stability of results across varying depths. The percentage of manually selected peaks that were also selected by the automated method (HITS) indicated how well the selection curve dealt with sub-annual variability. Finally, the RMS of the difference in counts between the selection curve and manual interpretation was calculated at two timescales, 50 and 500 years. RMS differences were determined by passing a sliding window of 50 or 500 years along the list of manual picks, identifying top and bottom depths for each time interval, and counting the number of selection curve picks in that depth interval.
, four lengths of calibration data, six depths in the core, and running downwards versus upwards on the core. Each calibration was applied to the WDC06A core from 250 to 1450 m, and Table 1 describes the level of agreement with the manual interpretation. The average percentage difference in total annual counts (BIAS) from the manual interpretation indicated potential bias. The standard deviation of the percentage difference in total annual counts (STDEV) indicated the stability of results across varying depths. The percentage of manually selected peaks that were also selected by the automated method (HITS) indicated how well the selection curve dealt with sub-annual variability. Finally, the RMS of the difference in counts between the selection curve and manual interpretation was calculated at two timescales, 50 and 500 years. RMS differences were determined by passing a sliding window of 50 or 500 years along the list of manual picks, identifying top and bottom depths for each time interval, and counting the number of selection curve picks in that depth interval.
The selection curve method with a polynomial fit for ![]() showed little BIAS relative to STDEV in Table 1. Different patterns were observed when running downwards versus upwards. In the downward direction, STDEV decreased by one-third when the calibration segment was doubled to 25 m, and by another two-thirds when increasing from 50 to 100 m. The proportion of cases where identical peaks in DEP were chosen also increased at these same calibration lengths. RMS50 and RMS500 did not show such a threshold response and improved with each increase in calibration length. As seen in Figure 4, the relative disagreement in age for four of the six downward 50 m calibrations increased rapidly near the beginning of the series. Proceeding further down the core in Figure 4, the relative error of results from the worst-fitting calibrations reduced gradually toward a stable level as the annual count increased. The calibration segment, labeled A for the polynomial method in Figure 4, came from the uppermost part of the core and proceeded through the entire series with the best fit.
showed little BIAS relative to STDEV in Table 1. Different patterns were observed when running downwards versus upwards. In the downward direction, STDEV decreased by one-third when the calibration segment was doubled to 25 m, and by another two-thirds when increasing from 50 to 100 m. The proportion of cases where identical peaks in DEP were chosen also increased at these same calibration lengths. RMS50 and RMS500 did not show such a threshold response and improved with each increase in calibration length. As seen in Figure 4, the relative disagreement in age for four of the six downward 50 m calibrations increased rapidly near the beginning of the series. Proceeding further down the core in Figure 4, the relative error of results from the worst-fitting calibrations reduced gradually toward a stable level as the annual count increased. The calibration segment, labeled A for the polynomial method in Figure 4, came from the uppermost part of the core and proceeded through the entire series with the best fit.
Percentage difference between the consensus interpretation and selection curves calibrated to 50 m training segments running down the core. Different curves represent different starting depths for calibration segments (A: 262 m; B: 622 m; C: 712 m; D: 862 m; E: 1162 m; F: 1312 m).

When running upwards from the bottom of the core with the polynomial estimate for ![]() there was little improvement with increasing amounts of calibration data. Interestingly, HITS was consistently higher when calibrating and running the method upward from the bottom of the core, even though the RMS measures were generally worse (i.e. same peak within a season, but more likely to miss a year). The repeating pattern of upward selections corresponding more frequently with specific peaks in the manual interpretation suggests an asymmetry in seasonal variability, with the dominant peak occurring deeper in the core and hence earlier in the season. Examination of DEP with other physically based measurements (e.g. high-resolution trace chemistry) may help elucidate this phenomenon. Though not developed here, it might be possible to improve results by automatically comparing patterns between downwards and upwards runs of the program.
there was little improvement with increasing amounts of calibration data. Interestingly, HITS was consistently higher when calibrating and running the method upward from the bottom of the core, even though the RMS measures were generally worse (i.e. same peak within a season, but more likely to miss a year). The repeating pattern of upward selections corresponding more frequently with specific peaks in the manual interpretation suggests an asymmetry in seasonal variability, with the dominant peak occurring deeper in the core and hence earlier in the season. Examination of DEP with other physically based measurements (e.g. high-resolution trace chemistry) may help elucidate this phenomenon. Though not developed here, it might be possible to improve results by automatically comparing patterns between downwards and upwards runs of the program.
For the running-mean method of estimating ![]() , the median calibrated number of prior picks, N, was 36 years. This method was prone to a positive feedback where the selection of closer peaks in DEP drove down
, the median calibrated number of prior picks, N, was 36 years. This method was prone to a positive feedback where the selection of closer peaks in DEP drove down ![]() , which led to the selection of more closely spaced peaks (Table 1). While some runs showed good agreement with the manual interpretation, even with just 12.5 m of calibration data, cases of large overestimation persisted in the 50 and 100 m tests. Again, calibrating and running in the upwards direction improved the chances of picking features identical to the manual interpretation. Despite gradual improvement as the number of calibration data increased, the results were too unstable to recommend estimating
, which led to the selection of more closely spaced peaks (Table 1). While some runs showed good agreement with the manual interpretation, even with just 12.5 m of calibration data, cases of large overestimation persisted in the 50 and 100 m tests. Again, calibrating and running in the upwards direction improved the chances of picking features identical to the manual interpretation. Despite gradual improvement as the number of calibration data increased, the results were too unstable to recommend estimating ![]() with a running mean. Figure 4 shows how error with the running-mean method could rapidly accumulate in rather small regions of the dataset. However, disregarding the two worst cases in Figure 4, the remaining program runs had lower disagreement in age than the polynomial method and were comparable with the FFT method.
with a running mean. Figure 4 shows how error with the running-mean method could rapidly accumulate in rather small regions of the dataset. However, disregarding the two worst cases in Figure 4, the remaining program runs had lower disagreement in age than the polynomial method and were comparable with the FFT method.
The FFT method provided the best results for the selection curve (Table 1), with automated analysis based on a single calibration segment providing better guidance on ![]() than the more laborious effort of manually interpreting multiple calibration segments at different depths for fitting with a polynomial. BIAS was small relative to STDEV, except when running upwards with 12.5 m of calibration data where five of the six calibration depths overestimated the count. In the downward direction, STDEV only changed noticeably when increasing to 50 m of calibration data, while RMS50 and RMS500 improved steadily with increasing calibration data. Figure 4 shows that the FFT-based selection curves had low error rates until ∼263 m depth. As with the polynomial method, results for the uppermost 50 m calibration (A in Fig. 4), which included this problematic region, diverged much less from the manual interpretation. As before, running the selection curve upwards increased HITS.
than the more laborious effort of manually interpreting multiple calibration segments at different depths for fitting with a polynomial. BIAS was small relative to STDEV, except when running upwards with 12.5 m of calibration data where five of the six calibration depths overestimated the count. In the downward direction, STDEV only changed noticeably when increasing to 50 m of calibration data, while RMS50 and RMS500 improved steadily with increasing calibration data. Figure 4 shows that the FFT-based selection curves had low error rates until ∼263 m depth. As with the polynomial method, results for the uppermost 50 m calibration (A in Fig. 4), which included this problematic region, diverged much less from the manual interpretation. As before, running the selection curve upwards increased HITS.
While HITS was comparable between the polynomial and FFT methods, both the downwards and upwards runs of the FFT method had consistently lower RMS at both 50 and 500 year timescales. The relative improvement of the FFT over the polynomial method was substantially greater for RMS500 than for RMS50. This suggests that the fine-scale estimation of ![]() by automatically tracing the noisy FFT power spectra was imprecise. However, the tracing method did capture important deviations from a simple polynomial trend at the 500 year timescale. Therefore, an easier method of fitting a smoother curve through the FFT power spectra might provide similar results to the more complex method presented here.
by automatically tracing the noisy FFT power spectra was imprecise. However, the tracing method did capture important deviations from a simple polynomial trend at the 500 year timescale. Therefore, an easier method of fitting a smoother curve through the FFT power spectra might provide similar results to the more complex method presented here.
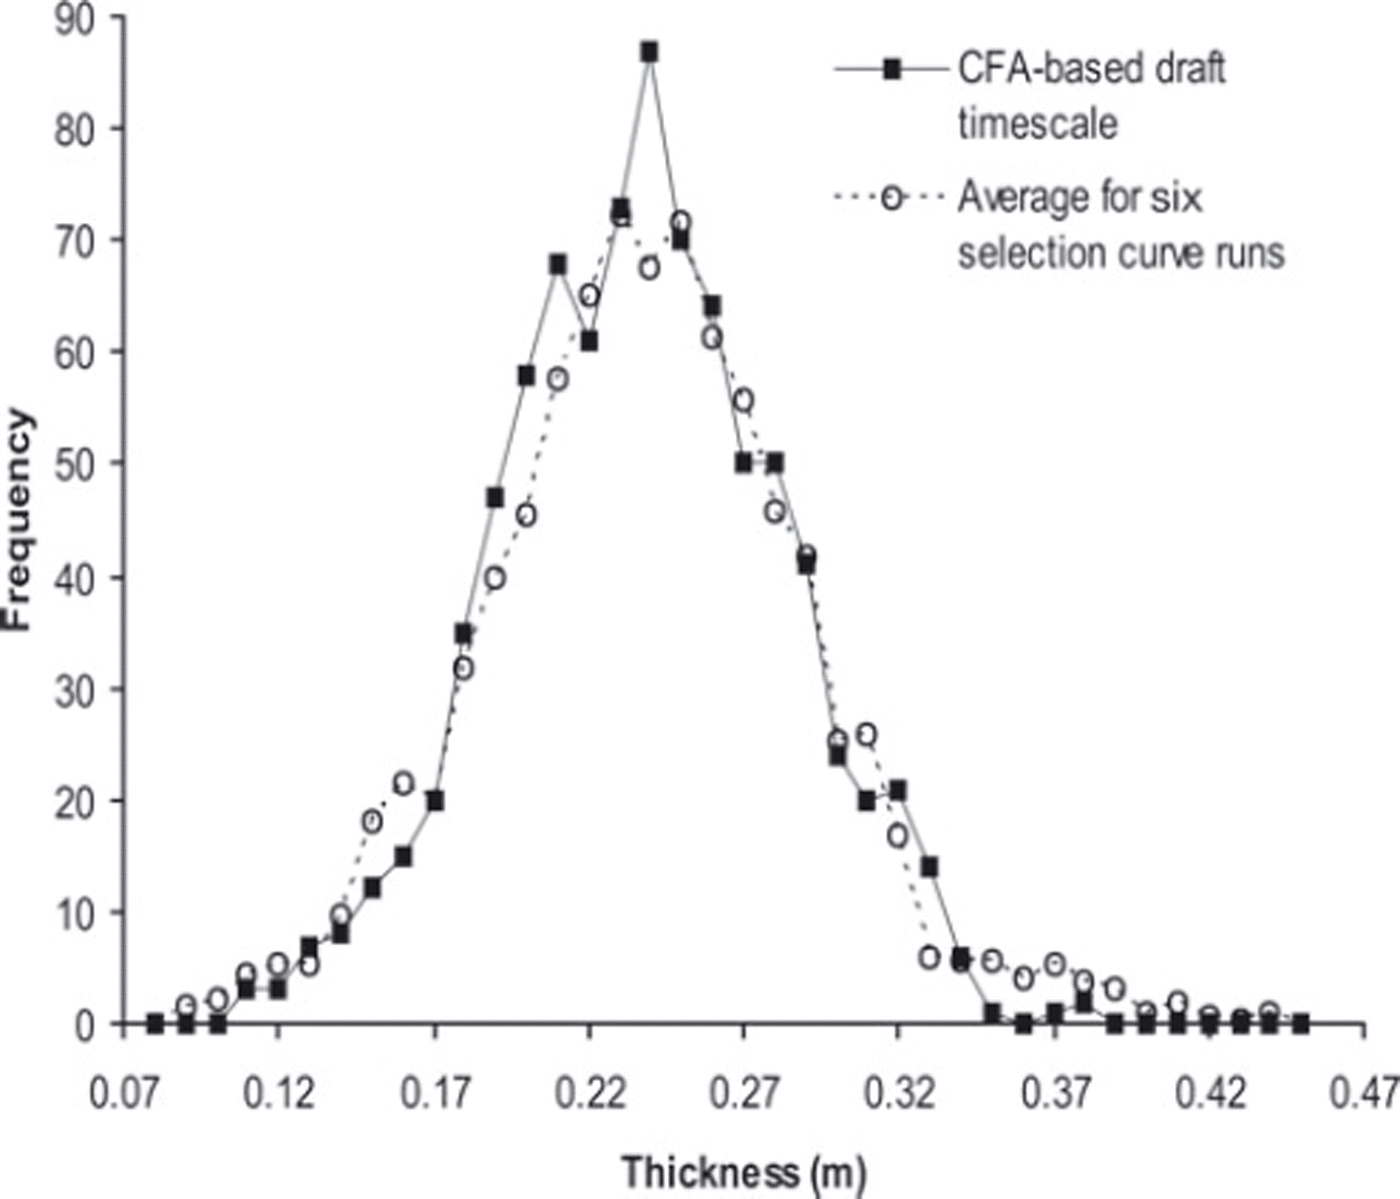
To confirm the correspondence between the DEP selection curve method and another accepted measure of annual cycles in the ice core, comparisons were also made with a 200 m long segment of a draft timescale developed for WDC06A above the brittle zone by McConnell and others (unpublished information) based on continuous flow analysis with mass spectrometry. The draft CFA-based timescale counted 861 years between 250 and 450 m. The FFT-based selection curves for DEP with the downward 50 m calibrations had a mean of 851 years (1.2% difference from CFA) and standard deviation of 21.6 years (2.5% difference), showing no statistically significant bias. Figure 5 compares a distribution curve for layer thickness frequencies of the CFA versus the average frequency for the aforementioned FFTbased selection curves. Since the data are not strain-corrected, the distribution in Figure 5 only compares consistency between the two methods and does not indicate snow accumulations. The DEP results were similar to the CFA-based timescale, with a slightly heavier tail towards larger annual thicknesses. Some of the discrepancy between CFA and DEP results in Figure 5 may be due to differences in seasonal timing between the specific chemicals measured by CFA versus the aggregate dielectric response.
Frequency distribution curves comparing annual-layer thicknesses (not strain-corrected) from 250 to 450 m for the FFTbased selection curve versus the draft CFA timescale.
One issue with the FFT method is that the 10 m sliding window represents an increasing number of years in the dataset as it moves down the core into thinner annual layers. The FFT method could be run a second time, allowing the width of sliding window to vary based on the trend in ![]() calculated from the first run. While some studies might benefit from the more consistent time window of a second run, we tested this and the results did not change noticeably for this dataset. For this dataset the selection curves showed no consistent change in shape as the depth of calibration data segments increased. After this method is applied to ice cores from multiple sites and multiple environmental signals, we may find that the shape of a calibrated selection curve contains information that is relevant to climate investigations.
calculated from the first run. While some studies might benefit from the more consistent time window of a second run, we tested this and the results did not change noticeably for this dataset. For this dataset the selection curves showed no consistent change in shape as the depth of calibration data segments increased. After this method is applied to ice cores from multiple sites and multiple environmental signals, we may find that the shape of a calibrated selection curve contains information that is relevant to climate investigations.
Disagreements between the manual interpretation and the calibrations from different depths showed some similarities among the three techniques for calculating ![]() (Fig. 4), but there was no consistent trend associated with the depth of the calibration data. Test runs that interpolated curve parameters between the multiple calibration regions (not shown) provided no noticeable improvement over a fixed curve derived from a single depth range.
(Fig. 4), but there was no consistent trend associated with the depth of the calibration data. Test runs that interpolated curve parameters between the multiple calibration regions (not shown) provided no noticeable improvement over a fixed curve derived from a single depth range.
Conclusion
Using only 25 m of manually interpreted calibration data, the FFT method agreed with the manual interpretation with an RMS of ≤2% over 1200 m of the core. For short ice cores it is not worth the effort to use this approach. However, in cores that span tens of thousands of years the approach presented here can provide a draft interpretation that increases the consistency and reduces the effort of the final manually adjusted interpretation. This consistency is particularly valuable for DEP measurements in the brittle zone of an ice core where multi-parameter CFA is not possible. This algorithm can be applied to any time or depth series where complex combinations of peaks make it difficult to select those peaks that best represent seasonal or annual variation.
Acknowledgements
This work was funded by grants 0440819, 0839093 and 0739780 of the US National Science Foundation (NSF) Office of Polar Programs. We thank J. Vrugt for sharing his MATLAB version of the MOCOM code and T.J. Fudge for reviewing the manuscript.


