





Nomenclature
Abbreviations
- DAE
differential-algebraic equation
- DP
design point
- EVA
EnVironmental Assessment
- GPA
gas path analysis
- HCM
health coefficient matrix
- HP
high pressure
- HPC
high pressure compressor
- HPT
high pressure turbine
- HPX
HorsePower eXtraction
- LPT
low pressure turbine
- M&S
modelling & simulation
- MBSE
model-based systems engineering
- MDU
Mälardalen University
- OD
off-design
- OEM
original equipment manufacturer
- QoI
quantity of interest
- UQ
uncertainty quantification
- V&V
verification & validation
Greek symbols ${\rm{\Delta }}$
deviation
- $\alpha $
weight exponent
- $\beta $
component map beta index
- $\delta $
uncertainty contribution
- $\eta $
isentropic efficiency
- $\mu $
average
- $\sigma $
standard deviation


Variables (excluding Greek symbols)
- $D$
observer system response
- $E$
total uncertainty
- $J$
Jacobian
- $N$
rotational speed or number of operating conditions
- $P$
total pressure
- $PR$
pressure ratio
- $Ps$
static pressure
- $R$
residual
- $S$
modelled system response
- $Sf$
skewness factor
- $T$
true system response or total temperature
- $Ts$
static temperature
- $W$
mass flow
- $d$
distance
- $w$
weight
- $x$
health parameter
- $z$
measurement


Subscripts
- $0$
ambient
- ${\rm{\Theta }}$
parameter
- $D$
measurement
- $M$
number of measurements
- $N$
number of health parameters
- $P$
component map corrected speed index
- $Q$
component map
$\beta $ index- $S$
system response
- $act$
actual
- $base$
baseline
- $c$
corrected
- $enhance$
enhanced
- $i$
health parameter index
- $input$
input
- $m$
component map index
- $map$
component map
- $max$
maximum
- $min$
minimum
- $model$
model
- $n$
operating condition index
- $num$
numerical
- $x$
boundary condition


1.0 Introduction
Every mechanical system experience, wear and tear and will eventually require some sort of maintenance, and gas turbines are no exception. To determine when to perform maintenance tasks, various schedules may be utilised based on the criticality of the component to be maintained [Reference Franciosi, Iung, Miranda and Riemma1]. The simplest maintenance method is corrective maintenance, where parts are overhauled or replaced after they are broken. This is essentially the same as a repair, and it is therefore only feasible for non-critical components. The next method is preventive, also known as scheduled, maintenance where components are inspected and overhauled at fixed intervals. Depending on the nature of the degradation, these may be based on either calendar time or operational cycles. The final method is condition based, where maintenance tasks are determined based on the current state of the component. The condition of a component can be determined in various ways, varying from visual inspection to advanced model-based or data-driven methods [Reference Bengtsson2, Reference Karim, Dersin, Galar, Kumar and Jarl3]. When measurements are used to determine the state of a component, it is performed through a diagnostic system [Reference Tahan, Tsoutsanis, Muhammad and Abdul Karim4].
A gas turbine diagnostic system may be based on a well-tuned simulation model, a data-driven algorithm or a combination, making it a hybrid method [Reference Baheta, Gilani and Kyprianidis5]. There are pros and cons with each approach, where the model-based approach relies on a simulation model, often denoted as a digital twin or digital shadow [Reference Candell, Hällqvist, Olsson, Fransson, Thadurin and Karim6, Reference Grieves and Vickers7], to find deviations from expected behaviour. The data-driven method instead relies on large amounts of data, from which the algorithm is trained to perform diagnostic tasks. Regardless of approach, the overall task is to detect anomalies and thereafter isolate and identify the fault or degradation.
The most commonly used model-based method for gas turbine diagnostics is gas path analysis (GPA), where changes in measurements are correlated to degradations of the rotating components. The first linear formulation of this method was proposed by Urban [Reference Urban8]. While this was a large step forward for model-based gas turbine diagnostics, the linear formulation meant it was only valid for a very narrow range of operating conditions. The method has since then been further developed to handle non-linear problems by utilising an iterative approach [Reference Escher9]. The method has also been adopted to work on quasi-steady state [Reference Tang, Volponi and Prihar10] and even transient data [Reference Yang, Tu, Zeng and Xuan11]. This has opened up possibilities to use much more of the data collected during the operation of aero engines, especially for fighters which rarely achieve full thermal steady-state conditions [Reference Merrington12].
A general issue when it comes to gas turbine diagnostics, especially for aero engines, is the lack of sensors [Reference Simon and Rinehart13]. While adding sensors may lead to additional diagnostic information, they also add cost, weight and complexity. From a diagnostic perspective, the most useful sensor placement usually lacking for turbofans is between the turbines, which is a harsh environment for a sensor, regarding both temperatures and contaminants. Since these sensors generally lack from a standard instrumentation, the diagnostic system is usually underdetermined with an infinite number of mathematical solutions. To overcome this, one must either add additional data to the system or make assumptions to balance the equations.
One way of extracting additional information is to make use of multiple operating conditions to obtain a unique solution [Reference Pinelli, Spina and Venturini14]. The data fusion from multiple operating conditions can be performed in various ways. Mathioudakis et al. used a method to combine the data into a single Jacobian matrix to be used for diagnostics [Reference Mathioudakis and Kamboukos15]. Gulati et al. proposed a sensor diagnostic method based on a multi-point approach [Reference Gulati, Zedda and Singh16]. Other methods make use of multiple assets instead of multiple operating conditions, such as a fleet of engines as proposed by Zaccaria et al. [Reference Zaccaria, Fentaye, Stenfelt and Kyprianidis17].
Apart from dealing with the diagnostic system being underdetermined, uncertainty quantification (UQ) should also be taken into account [Reference Roy and Oberkampf18, Reference Riedmaier, Danquah, Schick and Diermeyer19]. Depending on the application and quantity of interest (QoI), different uncertainties may be more or less important to consider. An example is manufacturing precision and tolerances, which directly affect the performance of gas turbines [Reference Wang and Zheng20]. For model-based diagnostics, measurement and model uncertainties are the two most important factors. Uncertainties in measurements will, to various extent, propagate to the estimated health parameters. Uncertainties in the model will also affect the estimated health parameters. This contribution may, however, vary significantly with operating conditions if the model uncertainty vary within the operational domain of the model [Reference Roy and Oberkampf18, Reference Hällqvist21]. Apart from affecting model-based diagnostic studies, having knowledge of the uncertainties affecting the model-based processes is an enabler for efficient model-based systems engineering (MBSE) [22].
In the study presented, a multi-point model-based gas turbine diagnostic method is proposed and evaluated in the presence of both measurement noise and model uncertainties. The core of the diagnostic method is an optimiser, which minimises the scatter in health parameter estimations for the range of operating conditions evaluated. To highlight the importance of UQ, the scenario considered is that the gas turbine simulation model used for diagnostics is well tuned at the design point (DP) but suffers from higher uncertainty at off-design (OD) operation. To evaluate, and to some extent mitigate these uncertainties, errors in the component characteristics are introduced in the gas turbine model used for diagnostics by skewing the component maps. The objective function in the multi-point optimisation is then modified, based on estimations on model uncertainty, to reduce the effect on the diagnostic result.
The novelty of the presented study is to connect UQ to model-based diagnostics in general and to the proposed multi-point algorithm in particular. In general, the importance of having a well-tuned gas turbine simulation model when running GPA is widespread knowledge. However, some model uncertainties will inevitably remain after tuning a simulation model. Once a model is tuned, these uncertainties should either be deemed to be acceptably low for the purpose of the model or there should be appropriate methods in place to handle these uncertainties. Through this paper, the aim is to highlight errors due to model uncertainties while at the same time proposing an approach to mitigate these effects.
2.0 Theoretical background
The research presented herein combines and investigates classical approaches of modelling and simulation (M & S) and UQ to health monitoring and diagnostics within the field of aircraft propulsion. The following sub-sections summarise the relevant theory enabling the presented research and, in the end, the sought contributions.
2.1 Uncertainty quantification (UQ)
As described by Coleman et al. in Refs [Reference Coleman and Steele23, 24], the true system response  $T$ is not observable; instead the experimental result
 \begin{align}D = T + {\delta _D}\end{align}
is registered where  $D$ represents the experimental result and ${\delta _D}$ the measurement uncertainty. Similarly
 \begin{align}{\delta _S} = S - T\end{align}
is the discrepancy between the response of the model  $S$ and the true system $T$. Solving Equation (1) for $T$ and inserting the result into Equation (2) yields the total uncertainty as
 \begin{align}E = {\delta _S} - {\delta _D}\end{align}
where
 \begin{align}{\delta _S} = {\delta _{model}} + {\delta _{num}} + {\delta _{input}}\end{align}
consists of several superimposed uncertainties from different categories:  ${\delta _{model}}$ captures any uncertainties in the modeled physics, and ${\delta _{num}}$ summarises numerical uncertainties emergent from, for example, solving the model equations. The term ${\delta _{input}}$ represent uncertainties in system inputs and parameters. Please note that the partitioning of ${\delta _S}$ presented in Equation (4) is taken from Ref. (24), other descriptions can be found in the literature. Riedmaier et al. choose to distinguish between errors in parameters settings from those of the inputs [Reference Riedmaier, Danquah, Schick and Diermeyer19]. Eek further partitions ${\delta _D}$ in order to separate measurement errors originating from the measurement registration setup from sensor measurement uncertainty [Reference Eek, Gavel and Ölvander25]. The separation
 \begin{align}{\delta _{input}} = {\delta _x} + {\delta _{\rm{\Theta }}}\end{align}
is relevant for the application example of the presented work. In Equation (5),  ${\delta _x}$ represents the uncertainty of the inputs serving as model boundary conditions, ${\delta _{\rm{\Theta }}}$ represents the uncertainties of the parameters that remain constant throughout an experiment. Oberkampf and Roy [Reference Oberkampf, Pilch and Trucano26] identify three fundamental activities of an uncertainty analysis: characterisation of the sources of uncertainty, propagation and analysis of model output uncertainties. Uncertainties are often grouped into two different main categories: aleatory and epistemic.
Uncertainties specified as aleatory are characterised by an inherent randomness or variability that is irreducible. This randomness arises from the nature of the system or process in focus. Aleatory uncertainties are frequently modeled as normally distributed, since many random processes in nature are identified as Gaussian. In this context, parameters like mean and standard deviation of the normal distribution represent the average and variability of the uncertain phenomenon.
On the other hand, epistemic uncertainty is associated with a lack of knowledge or information. It is reducible through learning and gaining more information. The choice of probability distribution for epistemic uncertainty may depend on the available information and the modeling assumptions. It might involve using different probability distributions or statistical methods based on subjective beliefs, expert opinions, or available data.
The propagation of uncertainties concerns quantifying the impact of uncertain sources of information, i.e. selected contributions of Equation (4), on the results. This process is typically initiated through some selected sampling procedure where contributions to  ${\delta _{input}}$, expressed as statistical populations, are sampled using some sampling algorithm. Through this approach, the deterministic simulation model can be executed based on the uncertain inputs. A number of different sampling algorithms with different characteristics are available in the literature, see for example Ref. [Reference Riedmaier, Danquah, Schick and Diermeyer19].
2.2 Gas turbine modeling
Gas turbine simulations can be performed for either steady-state or transient operating conditions. Unless the study at hand explicitly requires a transient solution, requiring a differential-algebraic equation (DAE) to be solved, steady-state solutions are generally used. To calculate a steady-state solution, a traditional system of equations is, due to the non-linear characteristics, solved iteratively to obtain a converged solution. To initialise the solution process, an initial state must either be guessed or based on a previously converged state. From there a marching direction is obtained through a Jacobian matrix
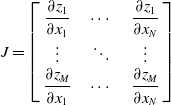 \begin{align}J = \left[ {\begin{array}{c@{\quad}c@{\quad}c}{\dfrac{{\partial {z_1}}}{{\partial {x_1}}}} {}& \cdots & {}{\dfrac{{\partial {z_1}}}{{\partial {x_N}}}}\\
\vdots & {} \ddots {}& \vdots \\
{\dfrac{{\partial {z_M}}}{{\partial {x_1}}}} {}& \cdots & {}{\dfrac{{\partial {z_M}}}{{\partial {x_N}}}}\end{array}} \right]\end{align}
\begin{align}J = \left[ {\begin{array}{c@{\quad}c@{\quad}c}{\dfrac{{\partial {z_1}}}{{\partial {x_1}}}} {}& \cdots & {}{\dfrac{{\partial {z_1}}}{{\partial {x_N}}}}\\
\vdots & {} \ddots {}& \vdots \\
{\dfrac{{\partial {z_M}}}{{\partial {x_1}}}} {}& \cdots & {}{\dfrac{{\partial {z_M}}}{{\partial {x_N}}}}\end{array}} \right]\end{align}
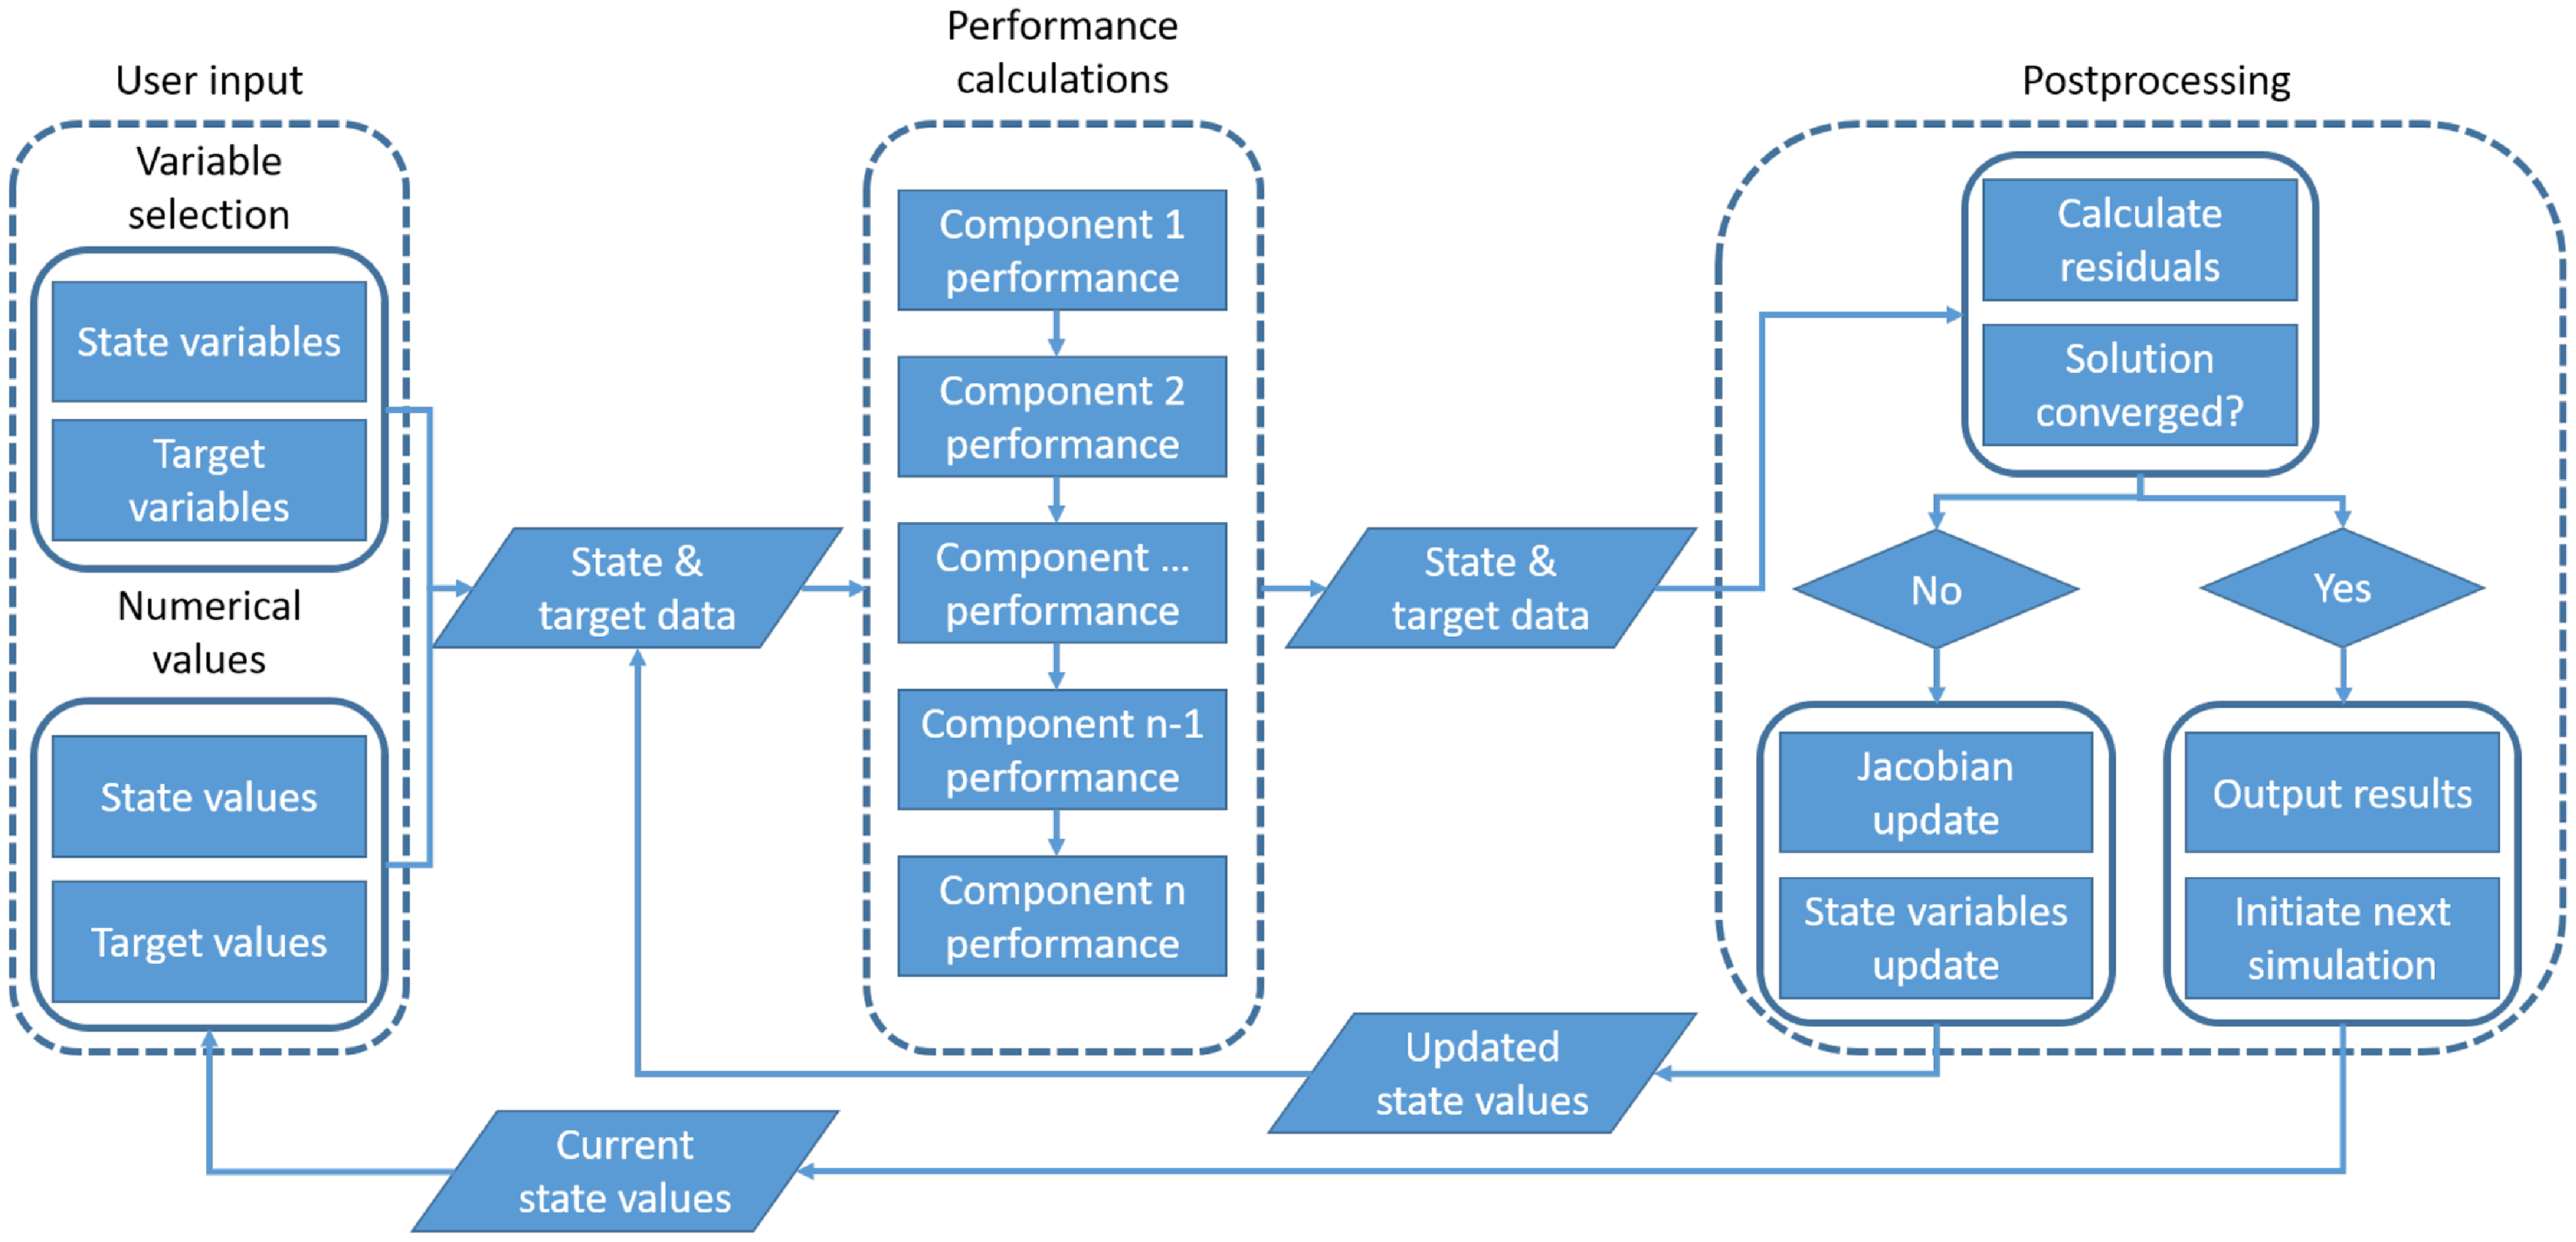
containing the first order partial derivatives of the target values  ${\rm{\Delta }}z$ relative the state values ${\rm{\Delta }}x$, as seen in Equation (6). For a pure Newton solver, the Jacobian has to be updated before every step to obtain the steepest gradient, leading to a large number of function evaluations. To reduce the computational burden the Broyden method, being a Newton-Rhapson method, instead reuse and update the previously calculated Jacobian, leading to a significant reduction in function calls [Reference Broyden27, Reference Broyden28]. A simplified flowchart of the solution process describing the solution process in the performance code EnVironmental Assessment (EVA), which is further described in Section 3.1, is shown in Fig. 1. More details of the performance code execution process and component modelling is provided by Stenfelt et al. [Reference Stenfelt29].
Simplified layout of the environmental assessment (EVA) performance code.
2.3 Gas path analysis
GPA is the most commonly used model-based method for gas turbine diagnostics. The linear formulation of GPA was proposed by Urban [Reference Urban8] in the early 1970s. It is based on a matrix operation where changes in health parameters are calculated from changes in measurements through a health coefficient matrix (HCM), containing the partial derivatives of the health parameters relative to the measurements used for diagnostics. This can be seen in Equation (7),
 \begin{equation} {\rm{\Delta }}\bar x = HCM \cdot {\rm{\Delta }}\bar z \end{equation}
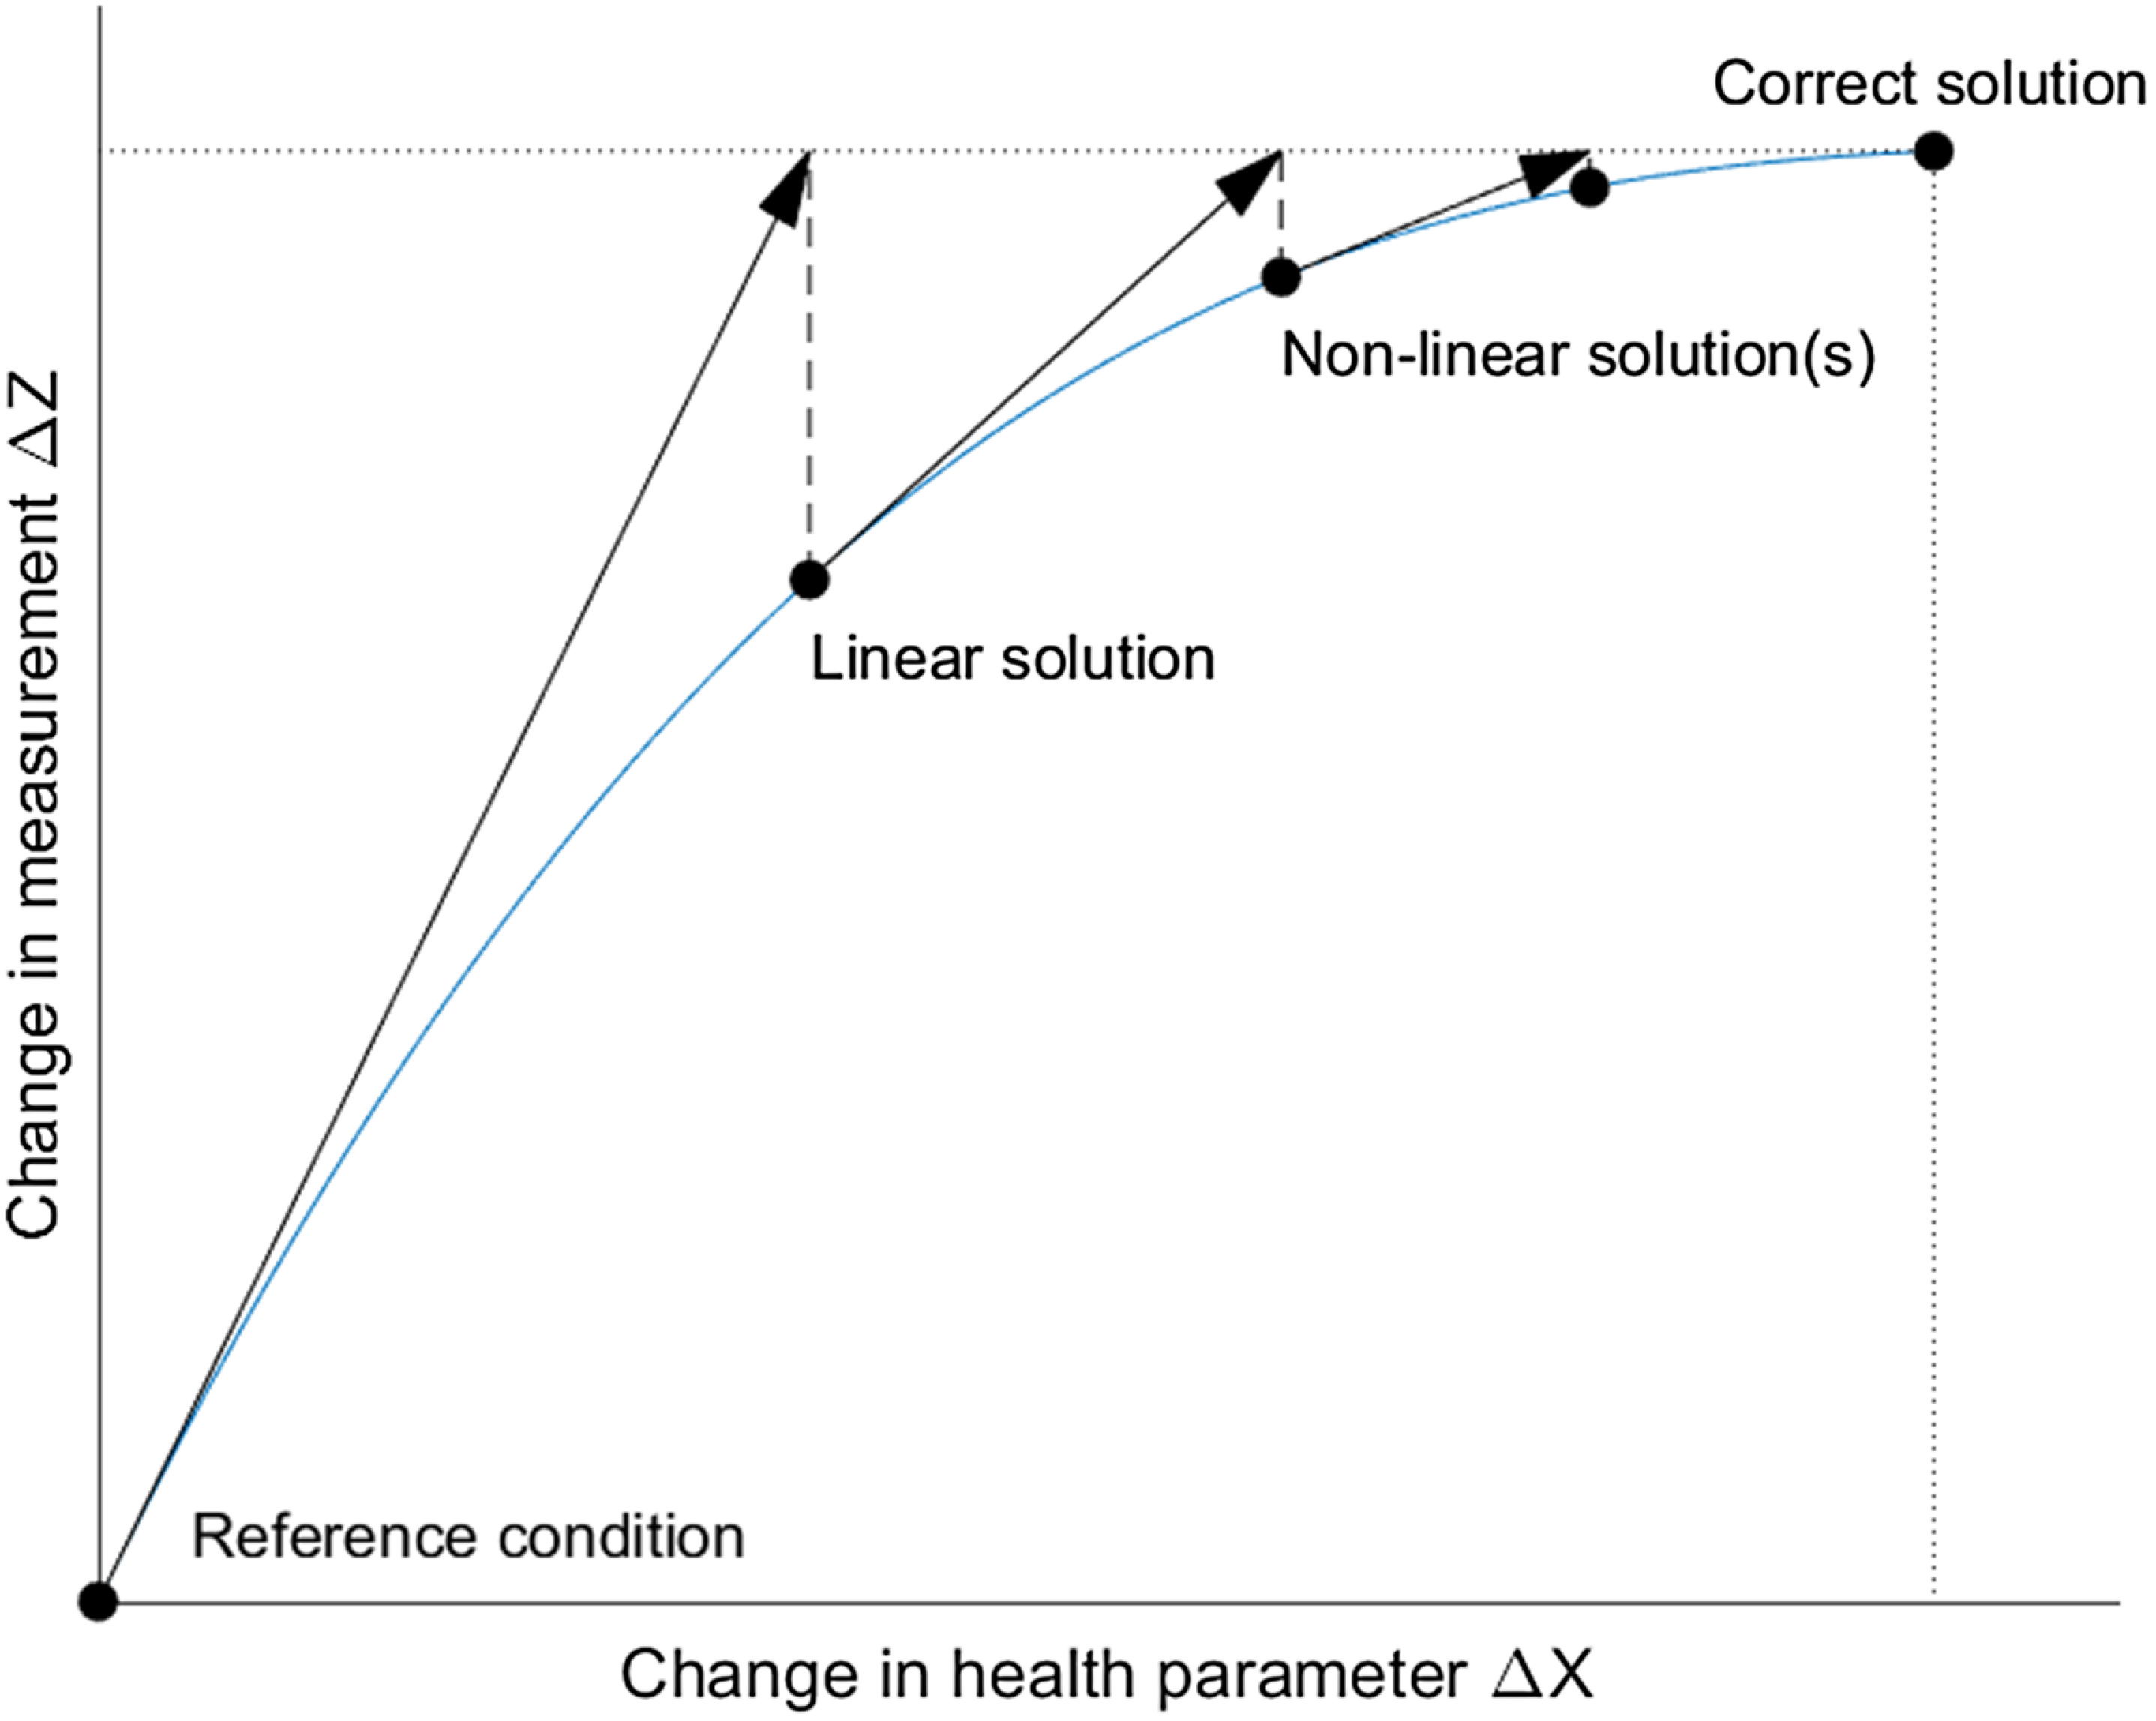
where the vectors  ${\rm{\Delta }}x$ and ${\rm{\Delta }}z$ correspond to the changes in health parameters and measurements, respectively. It is worth noticing that the variables $x$ and $z$ are a subset of the variables seen in Equation (6). Thereby the HCM is simply an inverse of the sub-matrix $J$ containing the corresponding health parameters and measurements. By using a single snapshot of the HCM, the linear GPA solution is obtained. To obtain the non-linear solution, the HCM is iteratively updated together with $J$ during the solution process, just like the gas turbine equilibrium is solved according to Fig. 2. Note that since the HCM comes from a matrix operation, it must obey the criteria of being square and non-singular to be invertable. In practice, this implies that the number of measurements must be the same as the number of health parameters sought. There must also be a physical coupling between the measurements and health parameters [Reference Stenfelt, Zaccaria and Kyprianidis30].
Iterative non-linear solver principle.
3.0 Methodology
In the following subsections, methodologies and preconditions for the evaluated study are presented.
3.1 Gas turbine model
The gas turbine simulation code used for modeling is a Mälardalen University (MDU) in-house performance code named EVA [Reference Kyprianidis31, Reference Kyprianidis, Quintero, Pascovici and Ogaji32]. The thermodynamic calculations are based on Gibbs free energy, and the EVA models encompass all first order, as well as several second order, physical effects of the gas turbine. The characteristics of the rotating components are described by the use of component maps. It is also possible to use maps to model other components, such as the exhaust nozzle and mixer, in order to describe various off-design behaviour. The default steady-state numerical solver in EVA is a gradient-based Broyden solver [Reference Broyden27, Reference Broyden28] where a non-linear solution is obtained by iteratively moving along the steepest gradient until a converged solution is obtained.
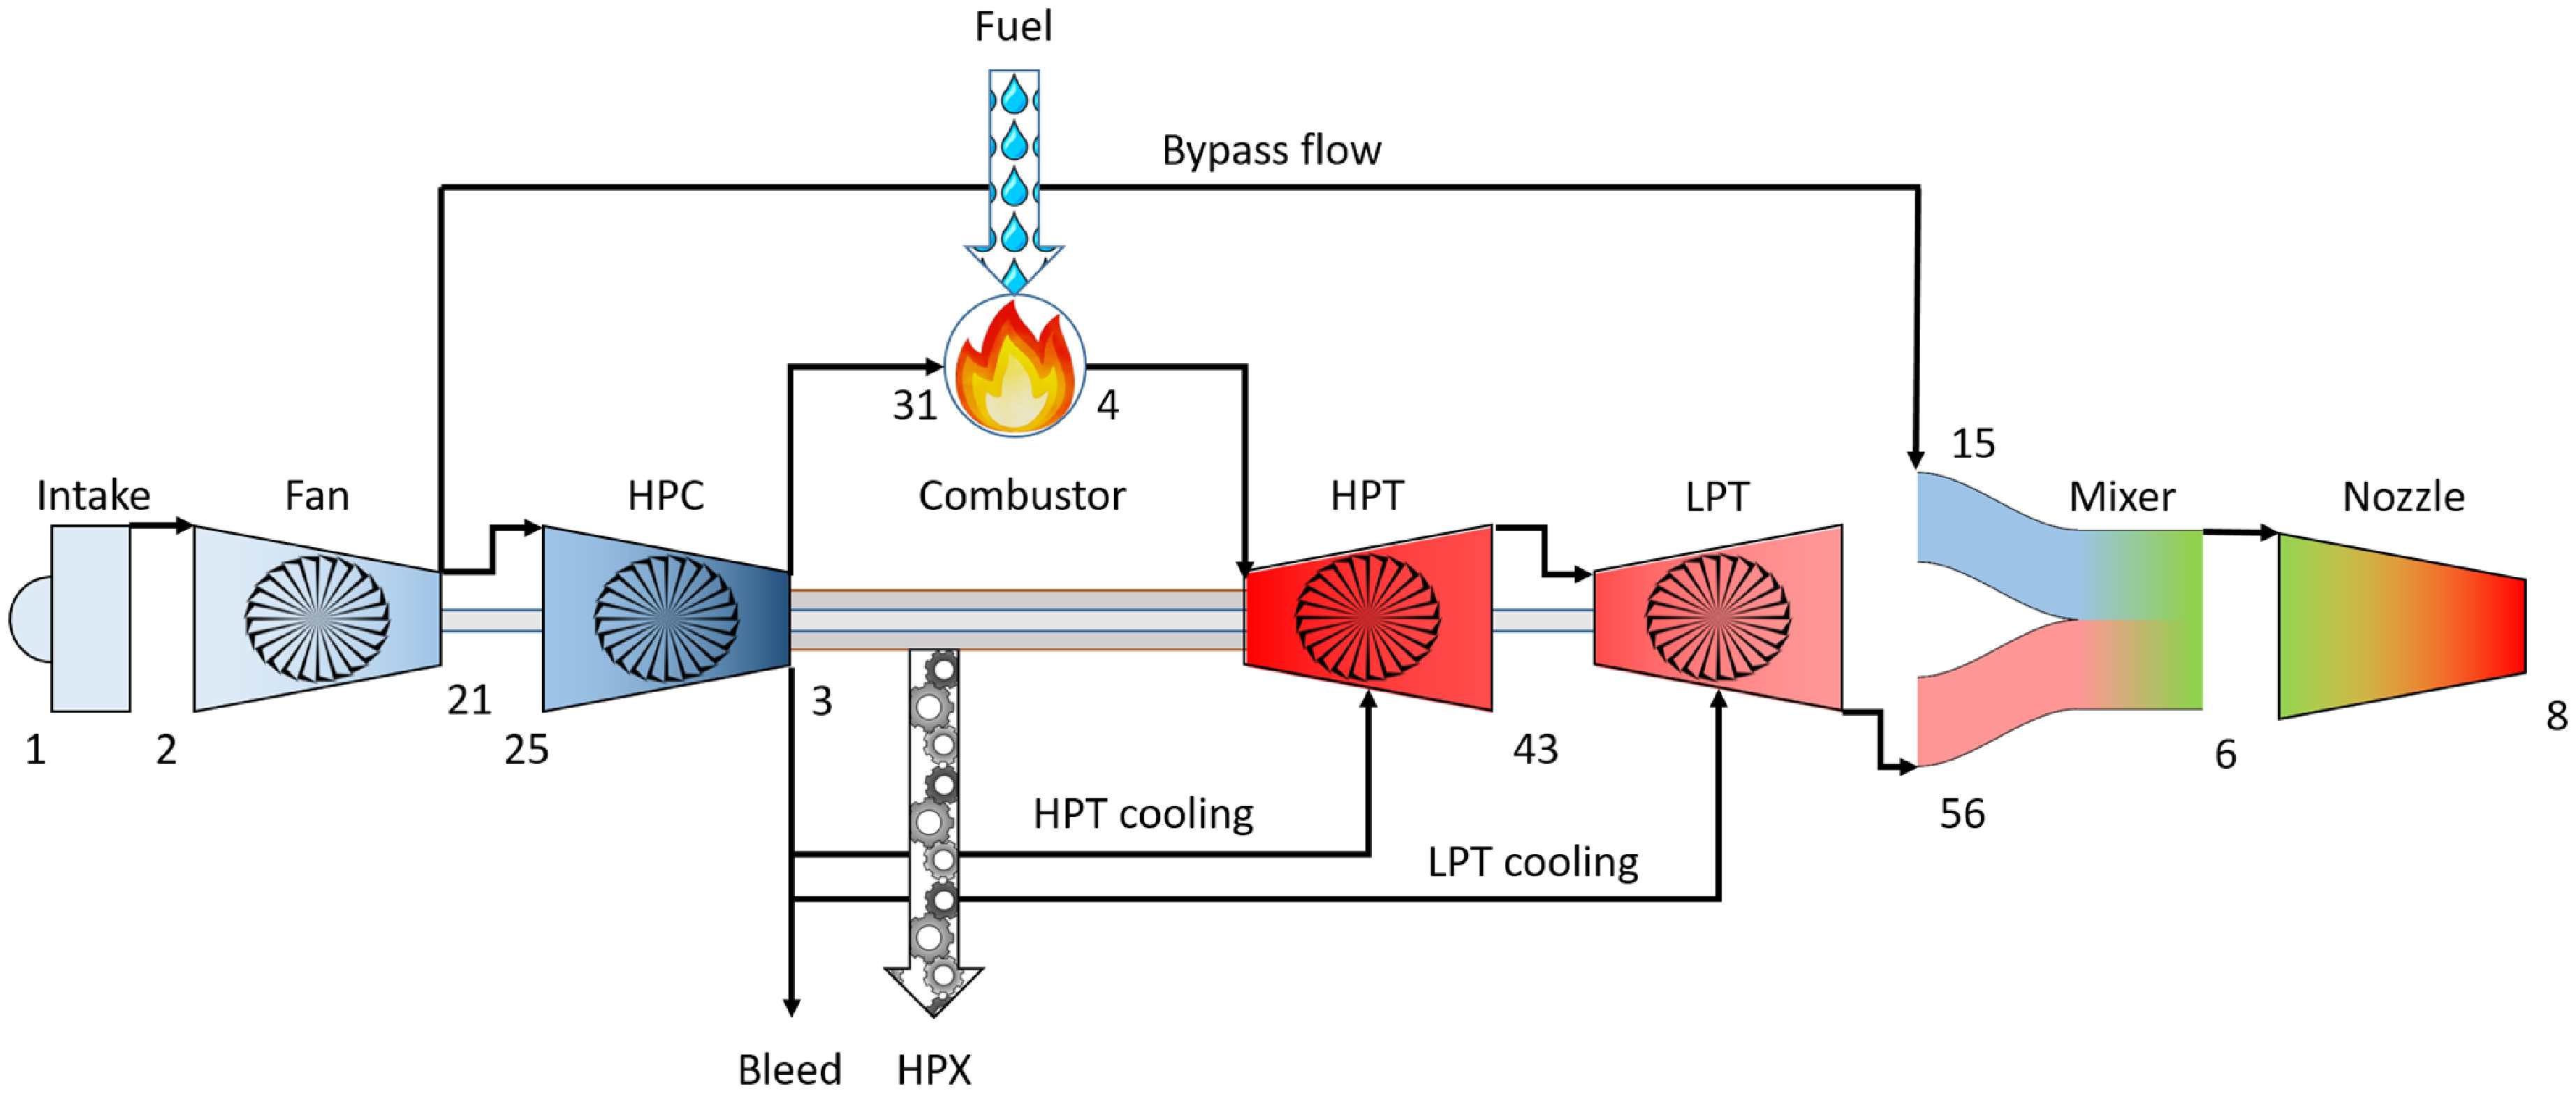
The gas turbine model used for the study is a low-bypass two-spool mixed-flow turbofan in the thrust class of a GE-F414-400. The model is tuned to performance levels based on information found in the open literature [Reference Gunston33] as well as engineering judgement. An overview of the model and its corresponding station numbering can be seen in Fig. 3. The station numbering is set according to the SAE ARP755D standard [34]. Customer bleed is supplied from the high-pressure compressor (HPC) discharge station and horsepower extraction (HPX) is extracted from the high-pressure (HP) shaft. For the work related to this paper, no bleed nor HPX is extracted.
Overview of the gas turbine simulation model including station numbering. Explanations to the abbreviations can be found in the nomenclature.
3.2 Model uncertainty
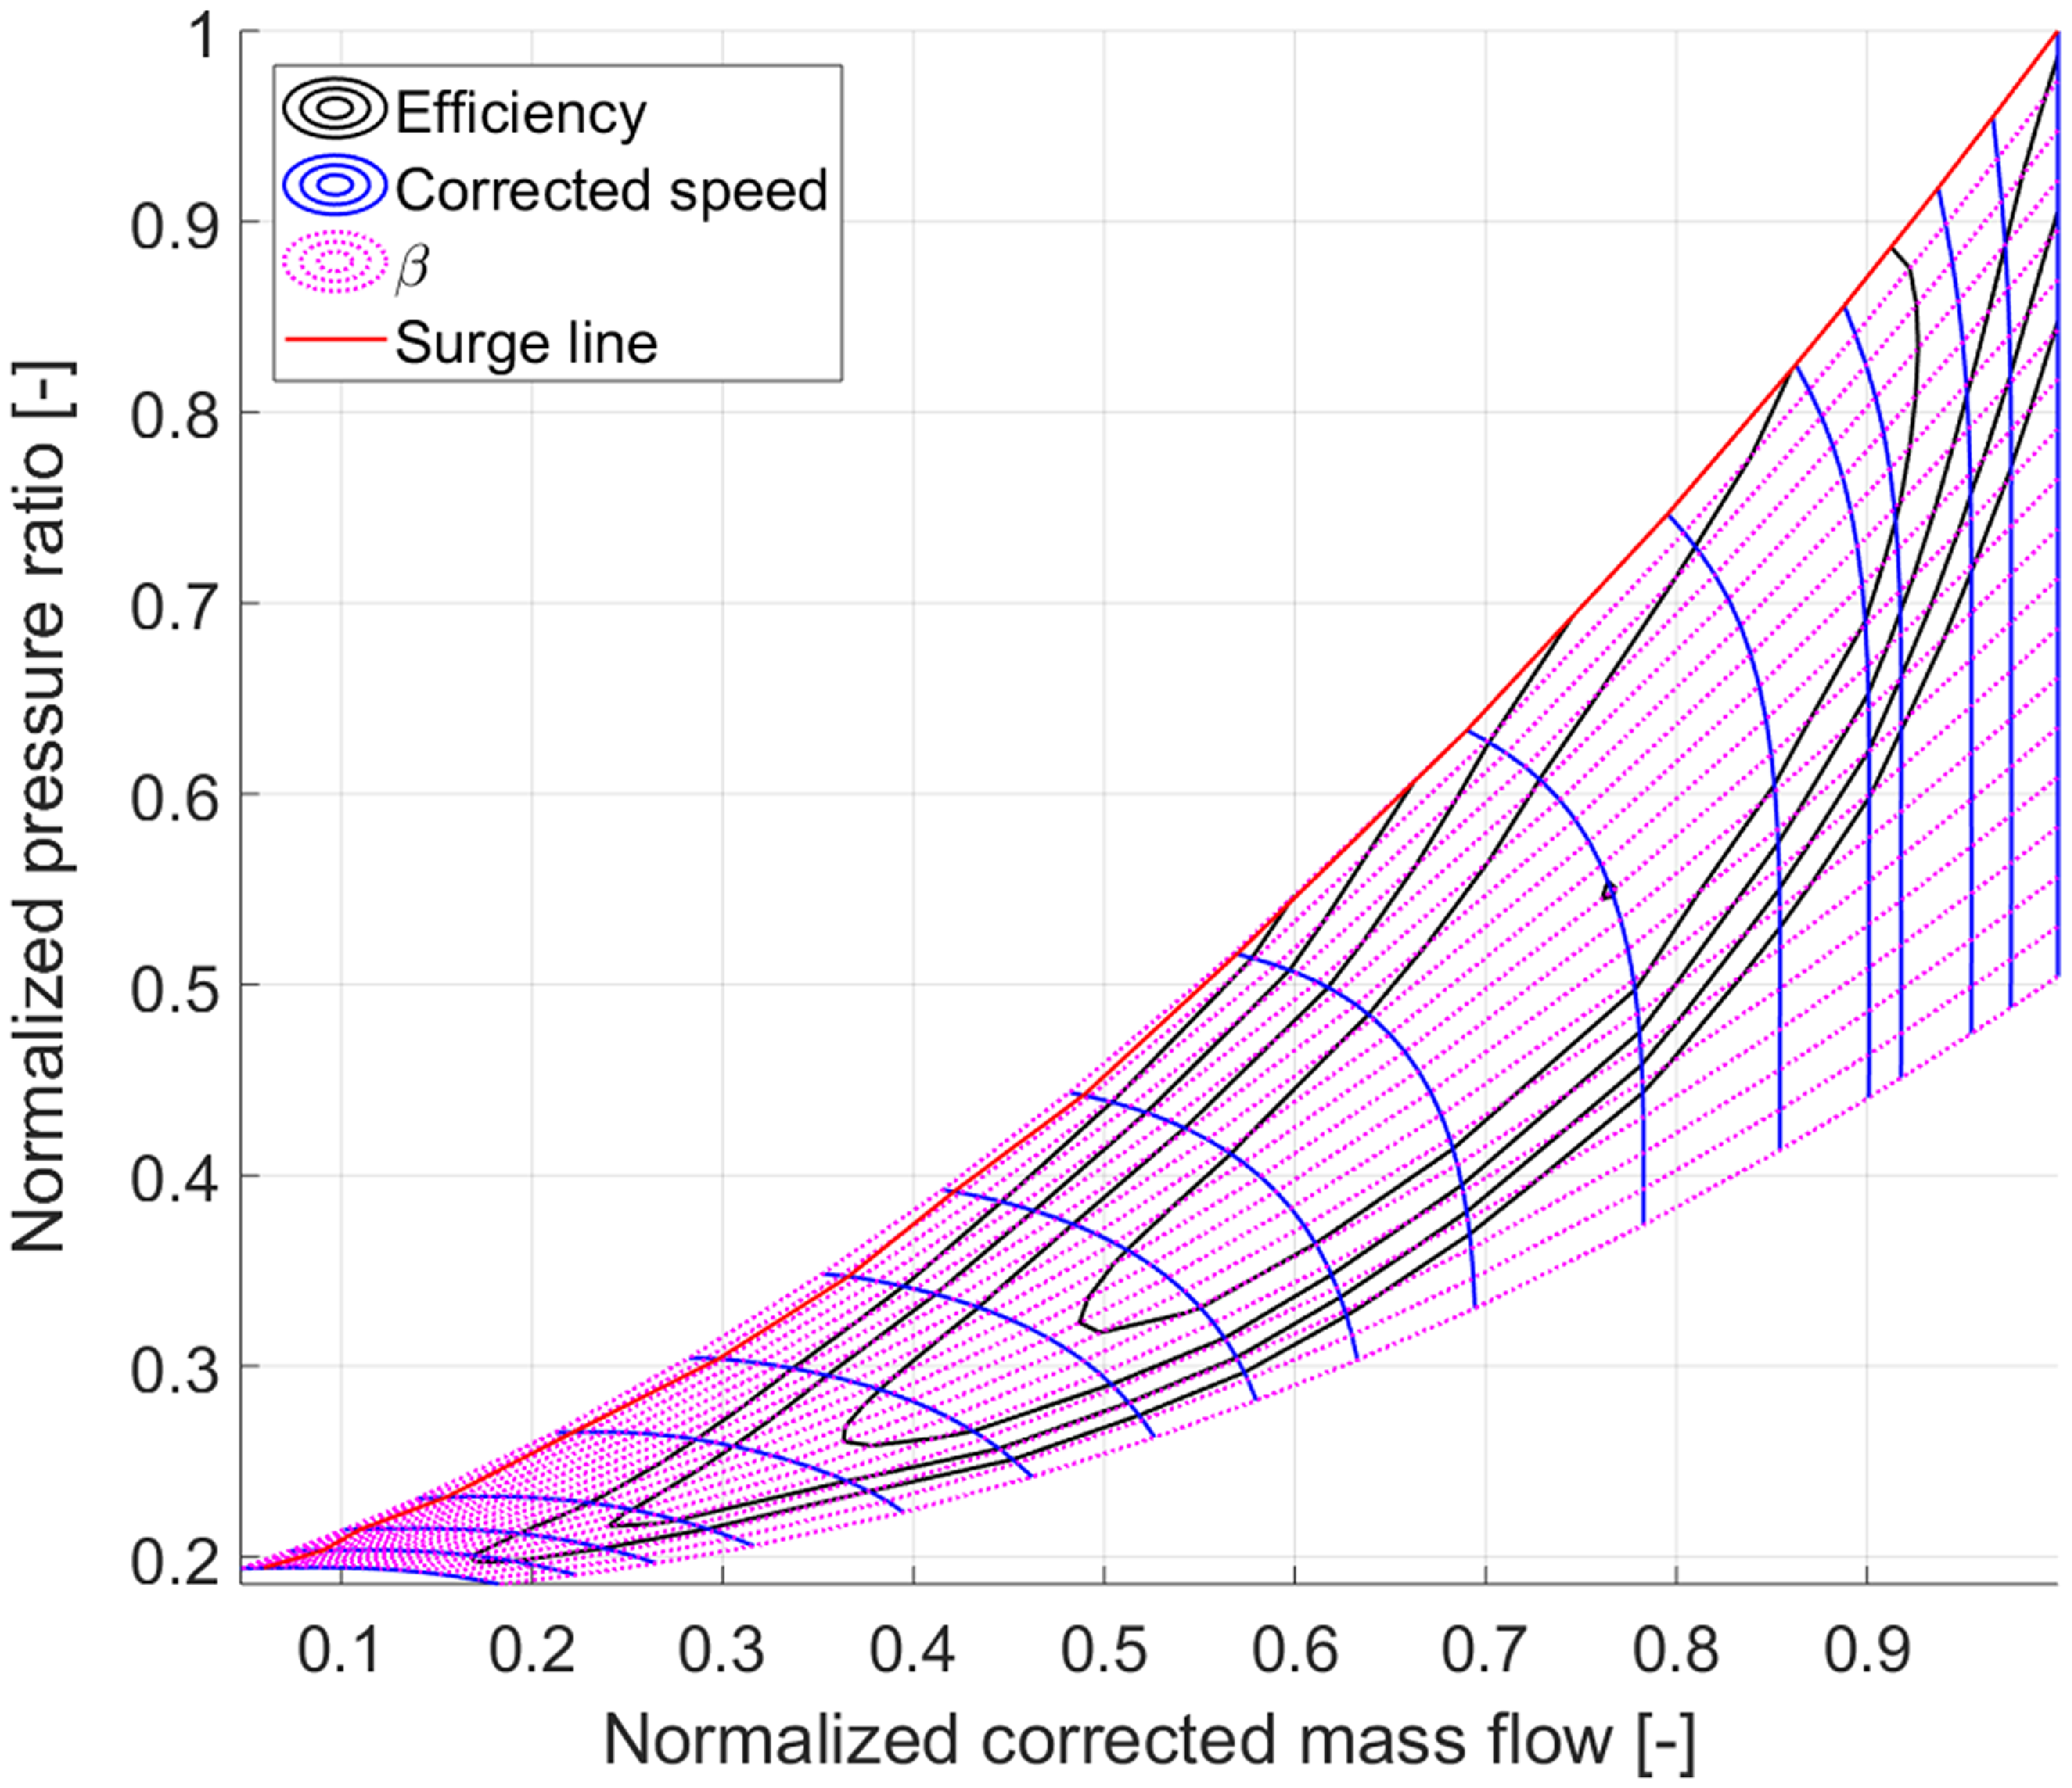
When performing non-linear GPA, the result is obtained by feeding measurements to a simulation model of the system to be diagnosed, which in turn calculates the corresponding level of degradation for the rotating components. The diagnostic result is therefore affected by uncertainties in measurements acting as boundary conditions ( ${\delta _x}$) and uncertainties in the simulation model ( ${\delta _{model}}$) used for diagnostics. When modelling a gas turbine, common practise is to first model the DP, which dictates the sizing of the gas turbine. The most simple variant of DP modelling is to match the data in a single operating condition [Reference Chapman, Lavelle and Litt35]. The DP may, however, be derived from a combination of operating conditions, each driving different requirements [Reference Hendricks36]. Once the DP is obtained, the OD behaviour can be modelled. The OD behaviour is therefore both a function of the DP, operating conditions and component maps, representing the component characteristics of a component for a range of operating conditions. For a gas turbine, the component characteristics of the rotating components is often proprietary information owned by the original equipment manufacturer (OEM). As a consequence, it may be difficult for third parties to fully recreate the OD behaviour of a gas turbine [Reference Kurzke37]. The model uncertainties are here applied to the component maps and assumed to be epistemic, since they relate to a lack of knowledge of the system to be modelled. In Fig. 4, an example of a normalised compressor map is shown. When extracting data from such a map, the input variables are the corrected speed and a $\beta $-value. The map outputs are the pressure ratio, corrected mass flow and isentropic efficiency. It is these outputs that are subject to the model uncertainties ${\delta _{model}}$ within the study presented.
Normalised compressor map [Reference Converse and Giffin38].
For this study, it is assumed that the DP is correctly modelled and the only source of OD uncertainty comes from the component maps. To implement a controllable level of uncertainty into the maps, a technique for skewing the maps is proposed. For this, two skewness parameters are specified for each map output, where the two parameters relate to high and low corrected speed. The skewness for each corrected speed is then calculated according to Equation (8)
 \begin{align}S\,{f_{act}} = \frac{{S\,{f_{max}} - S\,{f_{min}}}}{{{N_{{c_{max}}}} - {N_{{c_{min}}}}}} \cdot \left( {{N_{{c_{act}}}} - {N_{{c_{min}}}}} \right) + S\,{f_{min}}\end{align}
where variables  $S\,f$ and ${N_c}$ denotes scaling factor and corrected rotational speed. The subscript $act$ is for the actual operating condition while $min$ and $max$ relates to the values at the minimum and maximum corrected speeds. To obtain the skewed variables, the skewness factor $S\,f$ for each corrected speed is multiplied with the corresponding map output. As can be derived from Equation (8), a skewness factor of $1$ does not cause any skewness. Do also note that while the subscripts $min$ and $max$ may intuitively be interpreted as the minimum and maximum speed of a map, it must not necessarily be so. In the study performed, the $min$ and $max$ speeds have been selected as $0{\rm{\% }}$ and $100{\rm{\% }}$ corrected speed. While this may be inconvenient in the sense that no ordinary map goes down to $0{\rm{\% }}$ speed, it brings the advantage of making the skewness parameters independent to the map. If the lowest speed in the map were to be selected instead, the same skewness parameters will lead to different skewness for maps with different minimum speed. Therefore, all values specified regarding skewness within this paper relates to $0{\rm{\% }}$ and $100{\rm{\% }}$ corrected speed.
Once the scaling factors are specified, the process of skewing the map can begin. Important to note is that the skewness is applied before the DP is calculated. Common practice when calculating the DP performance is to scale the maps to user specified map output values. Due to this, even if skewness is applied to the DP conditions of the map, the scaling will ensure correct DP values, leading to the applied skewness only affecting the OD operating conditions. An example of this is shown in Fig. 5 where efficiency for the fan map is shown. The black solid lines represent the original map values and the numbers indicate the corresponding corrected speed. The red dashed lines show an example of a skewed map before the DP scaling is applied. As is seen, the map values at the DP are skewed in this stage. The blue dash-dotted lines show the map, with the same skewness parameters as the red dashed lines, after the DP scaling. It can be seen that through this process, the applied skewness at the DP conditions vanishes and are instead pushed to the OD conditions.
Example of the effect of skewness before and after DP scaling.

While the proposed method of skewing map outputs works well on fan and compressor maps, there is a feature of the turbine maps that must be considered. The turbines are generally operating at choked conditions where the corrected mass flow is essentially constant for a range of corrected speeds [Reference Saravanamuttoo, Rogers, Cohen, Straznicky and Nix39]. Due to this, if skewness is applied to the turbine mass flow it will lead to a component characteristic where the corrected mass flow is no longer constant, effectively introducing a non-physical behaviour of the turbine characteristics. Therefore, the proposed method of skewing shall be avoided when it comes to the turbine mass flow. Another thing worth noticing is the connection to the UQ in Section 2.1. Since the values of the component maps, once scaled from the DP, does not change during the OD simulation, the values within the maps could be considered to be parameters. In Equation (5), parameter errors are captured in the term  ${\delta _{\rm{\Theta }}}$. However, for this study the errors in the maps are considered as uncertainties in physical modelling and is therefore accommodated for in ${\delta _{model}}$ in Equation (4).
3.3 Sensors and health parameters
As mentioned in Section 2.3, the number of sensors available for diagnostics must be the same as the number of health parameters to obtain a unique solution. In Tables 1 and 2, the gas turbine sensors and health parameters used in the study is listed. Table 3 shows the sensors for determining the ambient and free-stream conditions. The gas turbine sensor locations are according to the instrumentation of a GE-F414-400 aircraft engine [Reference Eustace, Leylek, Fakhry and Anderson40], as well as an additional sensor for the HPC discharge temperature. The health parameters relate to changes in isentropic efficiency and mass flow for each rotating component. Since the health parameters are not possible to measure directly, they are derived through GPA as described in Section 2.3.
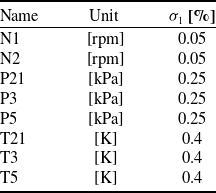
Gas turbine sensors
Health parameters

Ambient sensors

As mentioned in Section 2.1, measurement uncertainties may be divided into two main categories, sensor placement and noise. Since all gas turbine models used in this study are identical when it comes to the measurement locations, there is no placement error. The uncertainties shown in Tables 1 and 3 is considered as aleatory uncertainties caused by Gaussian measurement noise. The noise levels are meant to representative typical magnitudes found in gas turbine measurements, where  ${\sigma _1}$ represent the standard deviation.
Note that even though the number of sensors and health parameters are equal in Tables 1 and 2, one of the sensors is dedicated to control the fuel flow and it is therefore unaffected by changes in the health parameters. As a result, the system of equations is underdetermined and therefore lacks a unique mathematical solution. There are two main approaches to overcome this issue. The first is to balance the system of equations by either adding sensors or removing health parameters from the analysis. For this to work, the additional sensors must have a low enough correlation relative to the already existing sensor suite [Reference Stenfelt, Zaccaria and Kyprianidis30]. The second approach relies on the identification of interrelationships between the health parameters, effectively acting as an additional equation in the GPA formulation shown in Equation (7). This can be either an assumed interrelationship or, as in this study, a multi-point optimisation, as will be further described in Section 3.4.
3.4 Multi-point diagnostics
The idea of a multi-point diagnostic approach is to fuse information from several different sources, in this case operating conditions, to obtain a single output. In Fig. 6, a flowchart of the diagnostic process proposed herein can be seen. The blocks labelled ‘Gas turbine measurements’ and ‘Health parameters’ in Fig. 6 relate to the variables in Tables 1 and 2 while the ‘Ambient measurements’ are from Table 3. A single block represents either a single set of data or a process. Whenever multiple blocks are layered, it represents the various operating conditions, as specified in Section 3.5, used in the multi-point analysis.
Principal flowchart of the multi-point diagnostic framework.
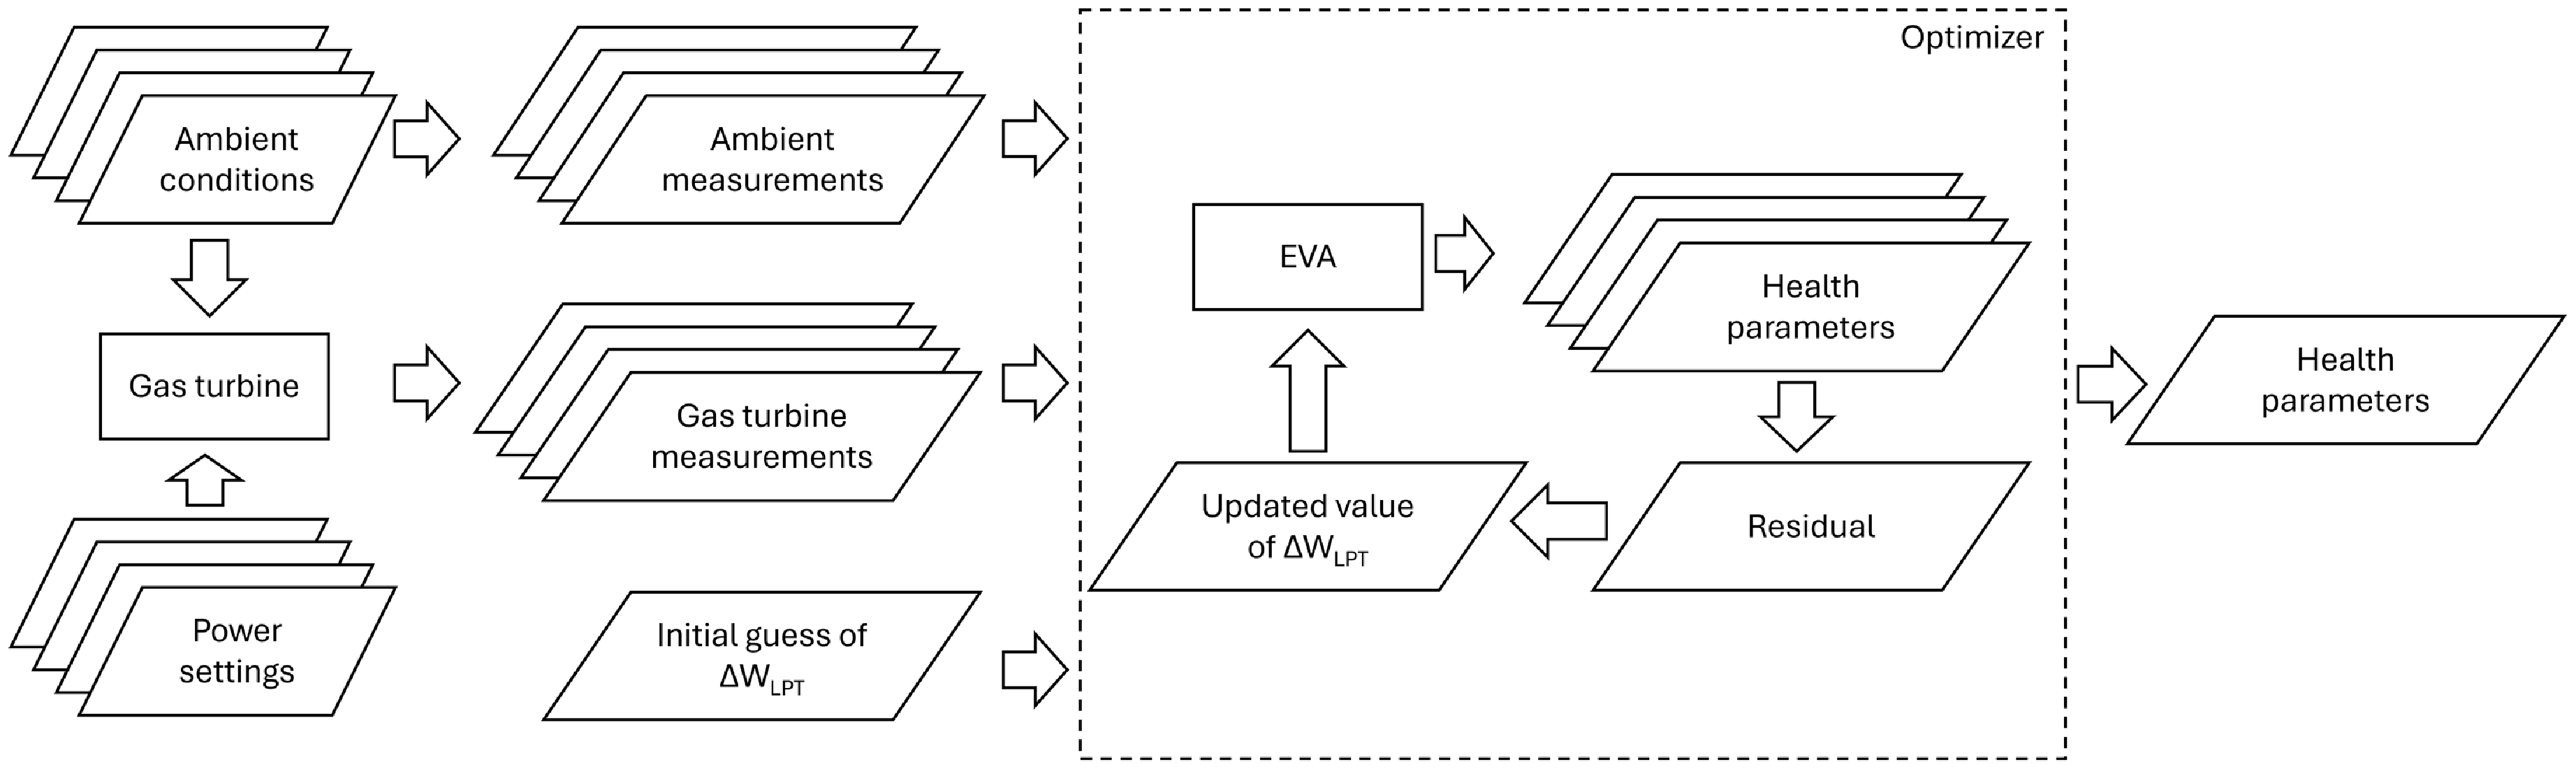
When running the multi-point analysis, the first step is to obtain the ambient conditions and measurements for all points to be analysed. For all these points, GPA is performed, as described in Section 2.2, using the EVA performance programme. As mentioned in Section 2.3, the number of sensors and health parameters must be equal to obtain a unique solution. Since this is not the case with the available measurements, the system of equations for a single operating condition is underdetermined. This is handled by the multi-point diagnostic method, which is initiated by assuming an initial value of a selected health parameter. For this study, the low-pressure turbine (LPT) flow capacity  ${\rm{\Delta }}{W_{LPT}}$ is selected as the variable to be optimised. The non-linear GPA problem, which has a unique solution for each operating condition when ${\rm{\Delta }}{W_{LPT}}$ is assigned a guessed value, is then solved. After the health state of all selected operating conditions has been solved, a residual,
 \begin{align}{R_{base}} = \sum {\sigma _i},\end{align}
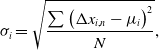
is calculated as the sum of the standard deviations,
 \begin{align}{\sigma _i} = \sqrt {\frac{{\sum {{\left( {{\rm{\Delta }}{x_{i,n}} - {\mu _i}} \right)}^2}}}{N}} ,\end{align}
of each health parameter. In Equation (10), the variable  ${\rm{\Delta }}{x_{i,n}}$ represents the value of the health parameter $i$ obtained at operating condition $n$. Furthermore, ${\mu _i}$ represents the average value across the operating conditions $n$ in the range of total number of operating conditions $N$. In Equation (9), ${\sigma _i}$ represents the standard deviation of the health parameter $i$, and ${R_{base}}$ is the combined residual value acting as an objective function in the multi-point analysis optimisation, according to
 \begin{align}\mathop{\rm{argmin}}\limits_{{\rm{\Delta W_{LPT}}}}{R_{base}}\end{align}
To obtain a unique solution to the diagnostic problem,  ${R_{base}}$ is minimised in order to find the optimal value of ${\rm{\Delta }}{W_{LPT}}$. This optimal value represents the health parameter selection, which minimises the deviation in health parameters between the evaluated operating conditions. In the study presented, the optimisation problem is not subjected to any constraints, and a gradient-based optimiser is used to solve the optimisation problem. Do note that the optimiser only calculates the optimal value of the health parameter ${\rm{\Delta }}{W_{LPT}}$, not the remaining health parameters from Table 2. To obtain a solution for each health parameter, GPA is applied to all operating conditions using the optimal value of ${\rm{\Delta }}{W_{LPT}}$. The final health parameter values are then obtained through an averaging of the health parameters according to
 \begin{align}{\rm{\Delta }}{x_i} = \frac{{\sum {\rm{\Delta }}{x_i},n}}{N}\end{align}
Note that the subscript  $base$ for the residual in Equation (9) stands for baseline. In the upcoming Section 3.6, an enhanced version of the residual designed to reduce the effect of model uncertainties will be presented. The subscript is there to separate these two residuals.
3.5 Operating conditions
For the multi-point diagnostic analysis to work, there must be data available for a range of operating conditions. For this study, a total of  $40$ different operating conditions at various ambient conditions and power settings are selected. In Table 4 the operating conditions can be seen, where the permutations of the tabled data add up to the 40 cases. For all operating conditions, no humidity is assumed. The fan speeds of $7000$ and $9000$ rpm relate to a relative corrected speed of approximately $64{\rm{\% }}$ and $82{\rm{\% }}$. The minimum altitude is set to $0.1$ km to avoid potential negative altitudes when measurement noise is applied to the static pressure. From a mathematical perspective this is not a problem, but it is done to avoid warning messages from the EVA performance code.
Operating conditions

3.6 Enhanced multi-point residual
The baseline residual, as shown in Equations (9) and (10), will in the ideal case without measurement noise ( ${\delta _x}$) and model uncertainty ( ${\delta _{model}}$) lead to the sought solution. However, as explained in Section 2.1, this is seldom the case in practice. The presence of uncertainties will influence the optimisation result and should therefore ideally be reflected in the residual calculation.
If measurement noise is considered, the effect may vary for each health parameter [Reference Stenfelt and Kyprianidis41], thus causing the health parameters more influenced by measurement noise to have a larger impact on the residual. When considering model uncertainties, the effect on the final result becomes a function of both the operating conditions within the operational domain [Reference Hällqvist, Braun, Eek and Krus42] as well as the uncertainty of the model ( ${\delta _S}$) at these specific operating conditions. Adding more operating conditions will decrease the uncertainty by damping the effect of the measurement noise. However, if the model uncertainty ( ${\delta _{model}}$) is high at a specific operating condition, this will instead have a negative effect on the final result.
In this study, the model uncertainties manifest as skewed component maps, as discussed in Section 3.2. Under these assumptions, the gas turbine model will perform well close to the DP whereas the model will be more uncertain further away from the DP. When extracting performance parameters from a component map, the map inputs are corrected speed and  $\beta $ [Reference Kurzke43]. Through these inputs, a non-dimensional distance from the DP can be established, which in turn correlates to the model uncertainty. Metrics relying on distance computations are by no means new to the model UQ and verification validation (V&V) communities. Atamturktur et al. present a metric for deducing model coverage under uncertainty [Reference Atamturktur, Egeberg, Hemez and Stevens44]. Furthermore, similar approaches to estimating model predictive capability, i.e. a model’s capability to make predictions at untested operating conditions [Reference Beisbart and Saam45], was proposed by Hällqvist et al. in Ref. [Reference Hällqvist, Eek, Braun and Krus46]. In this study, inspired by the related available literature, a normalised Euclidean distance
 \begin{align}{d_m} = \frac{1}{{\sqrt 2 }}\sqrt {{{\left( {\frac{{{\rm{\Delta }}{N_c}}}{{{N_{c100}}}}} \right)}^2} + {{\left( {\frac{{{\rm{\Delta }}\beta }}{{{\rm{max}}\beta }}} \right)}^2}} \end{align}
is used as a distance metric of predictive capability, where  ${d_m}$ is the distance from an OD point to the DP in component map $m$. Note that Equation (13) does not account for the typical metric requirements specified by, for example, Ferson et al. [Reference Ferson, Oberkampf and Ginzburg47]; it is, however, deemed sufficient for the purposes of the presented research.
In Equation (13),  ${\rm{\Delta }}{N_c}$ and ${\rm{\Delta }}\beta $ represent changes in corrected speed and beta values from the DP operating conditions. Additionally, ${N_{c100}}$ and ${\rm{max}}\beta $ represent $100{\rm{\% }}$ corrected speed and maximum map $\beta $-value, respectively. They are used to normalise the inputs to non-dimensional values with a maximum value of one. The rationale for using the 100% instead of the maximum corrected speed for normalisation is that some component maps may be extrapolated to higher speeds, which would affect the corresponding distance ${d_m}$ without changing the most relevant parts of the map if the extrapolation part were to be omitted. The division by the square root of two ensures that the maximum obtainable distance is limited to a value of one.
Since the distance is calculated for each component map, four different values will be obtained. To get a single measurement relating to the distance to the DP, the maximum of these distances is calculated according to
 \begin{align}{d_{map}} = \mathop {{\rm{max}}}\limits_m {d_m}\end{align}
where  ${d_{map}}$ is the maximum distance obtained by any of the component maps $m$. The distance ${d_{map}}$ give a non-dimensional distance in the component maps, where the value zero corresponds to the DP. The further away from the DP, the higher value of ${d_{map}}$. To translate this distance to a weight for model uncertainty, a calculation is performed according to
 \begin{align}{w_{map}} = {\left( {1 - {d_{map}}} \right)^\alpha }\end{align}
where  ${w_{map}}$ is the model uncertainty weight and $\alpha $ a parameter to adjust the weight to a non-linear behaviour. The weight ${w_{map}}$ is calculated for every operating condition $n$ going into the multi-point diagnostic method. The weights are then introduced into an enhanced residual according to
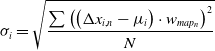 \begin{align}{\sigma _i} = \sqrt {\frac{{\sum {{\left( {\left( {{\rm{\Delta }}{x_{i,n}} - {\mu _i}} \right) \cdot {w_{ma{p_n}}}} \right)}^2}}}{N}} \end{align}
which allows for a weighted residual  ${R_{enhanced}}$ to be summed up by applying Equation (9). The effect of introducing the weight factor ${w_{map}}$ is to give operating conditions close to the DP, where the uncertainty is a lower, larger weight in the optimisation while penalising operating conditions far from the DP.
Once an optimal value of  ${\rm{\Delta }}{W_{LPT}}$, selected as the health parameter to be optimised in Section 3.4, is obtained with the enhanced residual, each operating condition will have a unique corresponding set of remaining health parameters. To extract a unified unique solution, a weighted average of each health parameter is obtained by applying the weight factors from Equation (15) according to
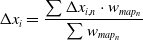 \begin{align}{\rm{\Delta }}{x_i} = \frac{{\sum {\rm{\Delta }}{x_{i,n}} \cdot {w_{ma{p_n}}}}}{{\sum {w_{ma{p_n}}}}}\end{align}
4.0 Results
In this section, results from a noise uncertainty propagation analysis are presented where the effect of measurement noise is shown for the multi-point diagnostic method. The following subsection then presents results for how the baseline and enhanced residual cope in the presence of model uncertainties.
4.1 Noise uncertainty propagation
In accordance with the UQ shown in Section 2.1 in general and Equation (4) in particular, a noise uncertainty propagation analysis was performed. The steps undertaken for this are to characterise the uncertainties, as done in Section 3.3, and propagate them through the diagnostic framework. Apart from the input uncertainties, here manifested as measurement noise introduced through  ${\delta _{input}}$, there may be other uncertainties of interest for this type of noise uncertainty propagation analysis. In Equation (4) there is an additional term ${\delta _{num}}$ dealing with numerical uncertainties. Solver tolerances and machine precision are typical examples of quantities falling within this category. These contributions are, however, deemed to be magnitudes smaller than the measurement noise and are therefore discarded from the analysis. The remaining term ${\delta _{model}}$ relates to the model uncertainties. While this may have a major impact on the uncertainties, the noise uncertainty propagation analysis evaluated in this subsection aims to only show the effect of measurement noise. Therefore, no map skewness is applied for this analysis. Additionally, the noise uncertainty propagation analysis is performed using the baseline residual ${R_{base}}$ as described in Section 3.4.
In Fig. 7, results from a Monte-Carlo simulation where the effect on the diagnostic accuracy due to propagation of Gaussian noise according to Tables 1 and 3 is shown. The values on the x-axis represent the difference between the estimated and actual health parameter values. For this study, no degradations were implanted. A convergence study was performed to determine the number of instances required to obtain a representative outcome. From this analysis,  $1000$ instances were selected to be used in the Monte Carlo simulation. Note that the noise for each of the $40$ different operating conditions, used to derive a unique set of health parameters, come from different random seeds. The implanted noise is also assumed to be independent relative each other. In the figure, the probability distributions for each health parameter, after going through the multi-point diagnostic method, can be seen. A few conclusions can be drawn from the figure, one being the effect of available instrumentation. With the current setup, the compressing components are well instrumented. Due to this, the potential values of the health parameters are limited to a narrow range close to the target values, leading to small estimation errors. The uncertainties are therefore pushed toward the relatively seen, poorly instrumented turbines. One exception is the high-pressure turbine (HPT) flow capacity ${\rm{\Delta }}{W_{HPT}}$ which experiences uncertainty levels similar to the compressing components. The reason for this is that the HPT flow capacity dictates the total core mass flow, thus having a strong coupling to the fan and compressor mass flows.
Noise uncertainty propagation result with noisy input signals.
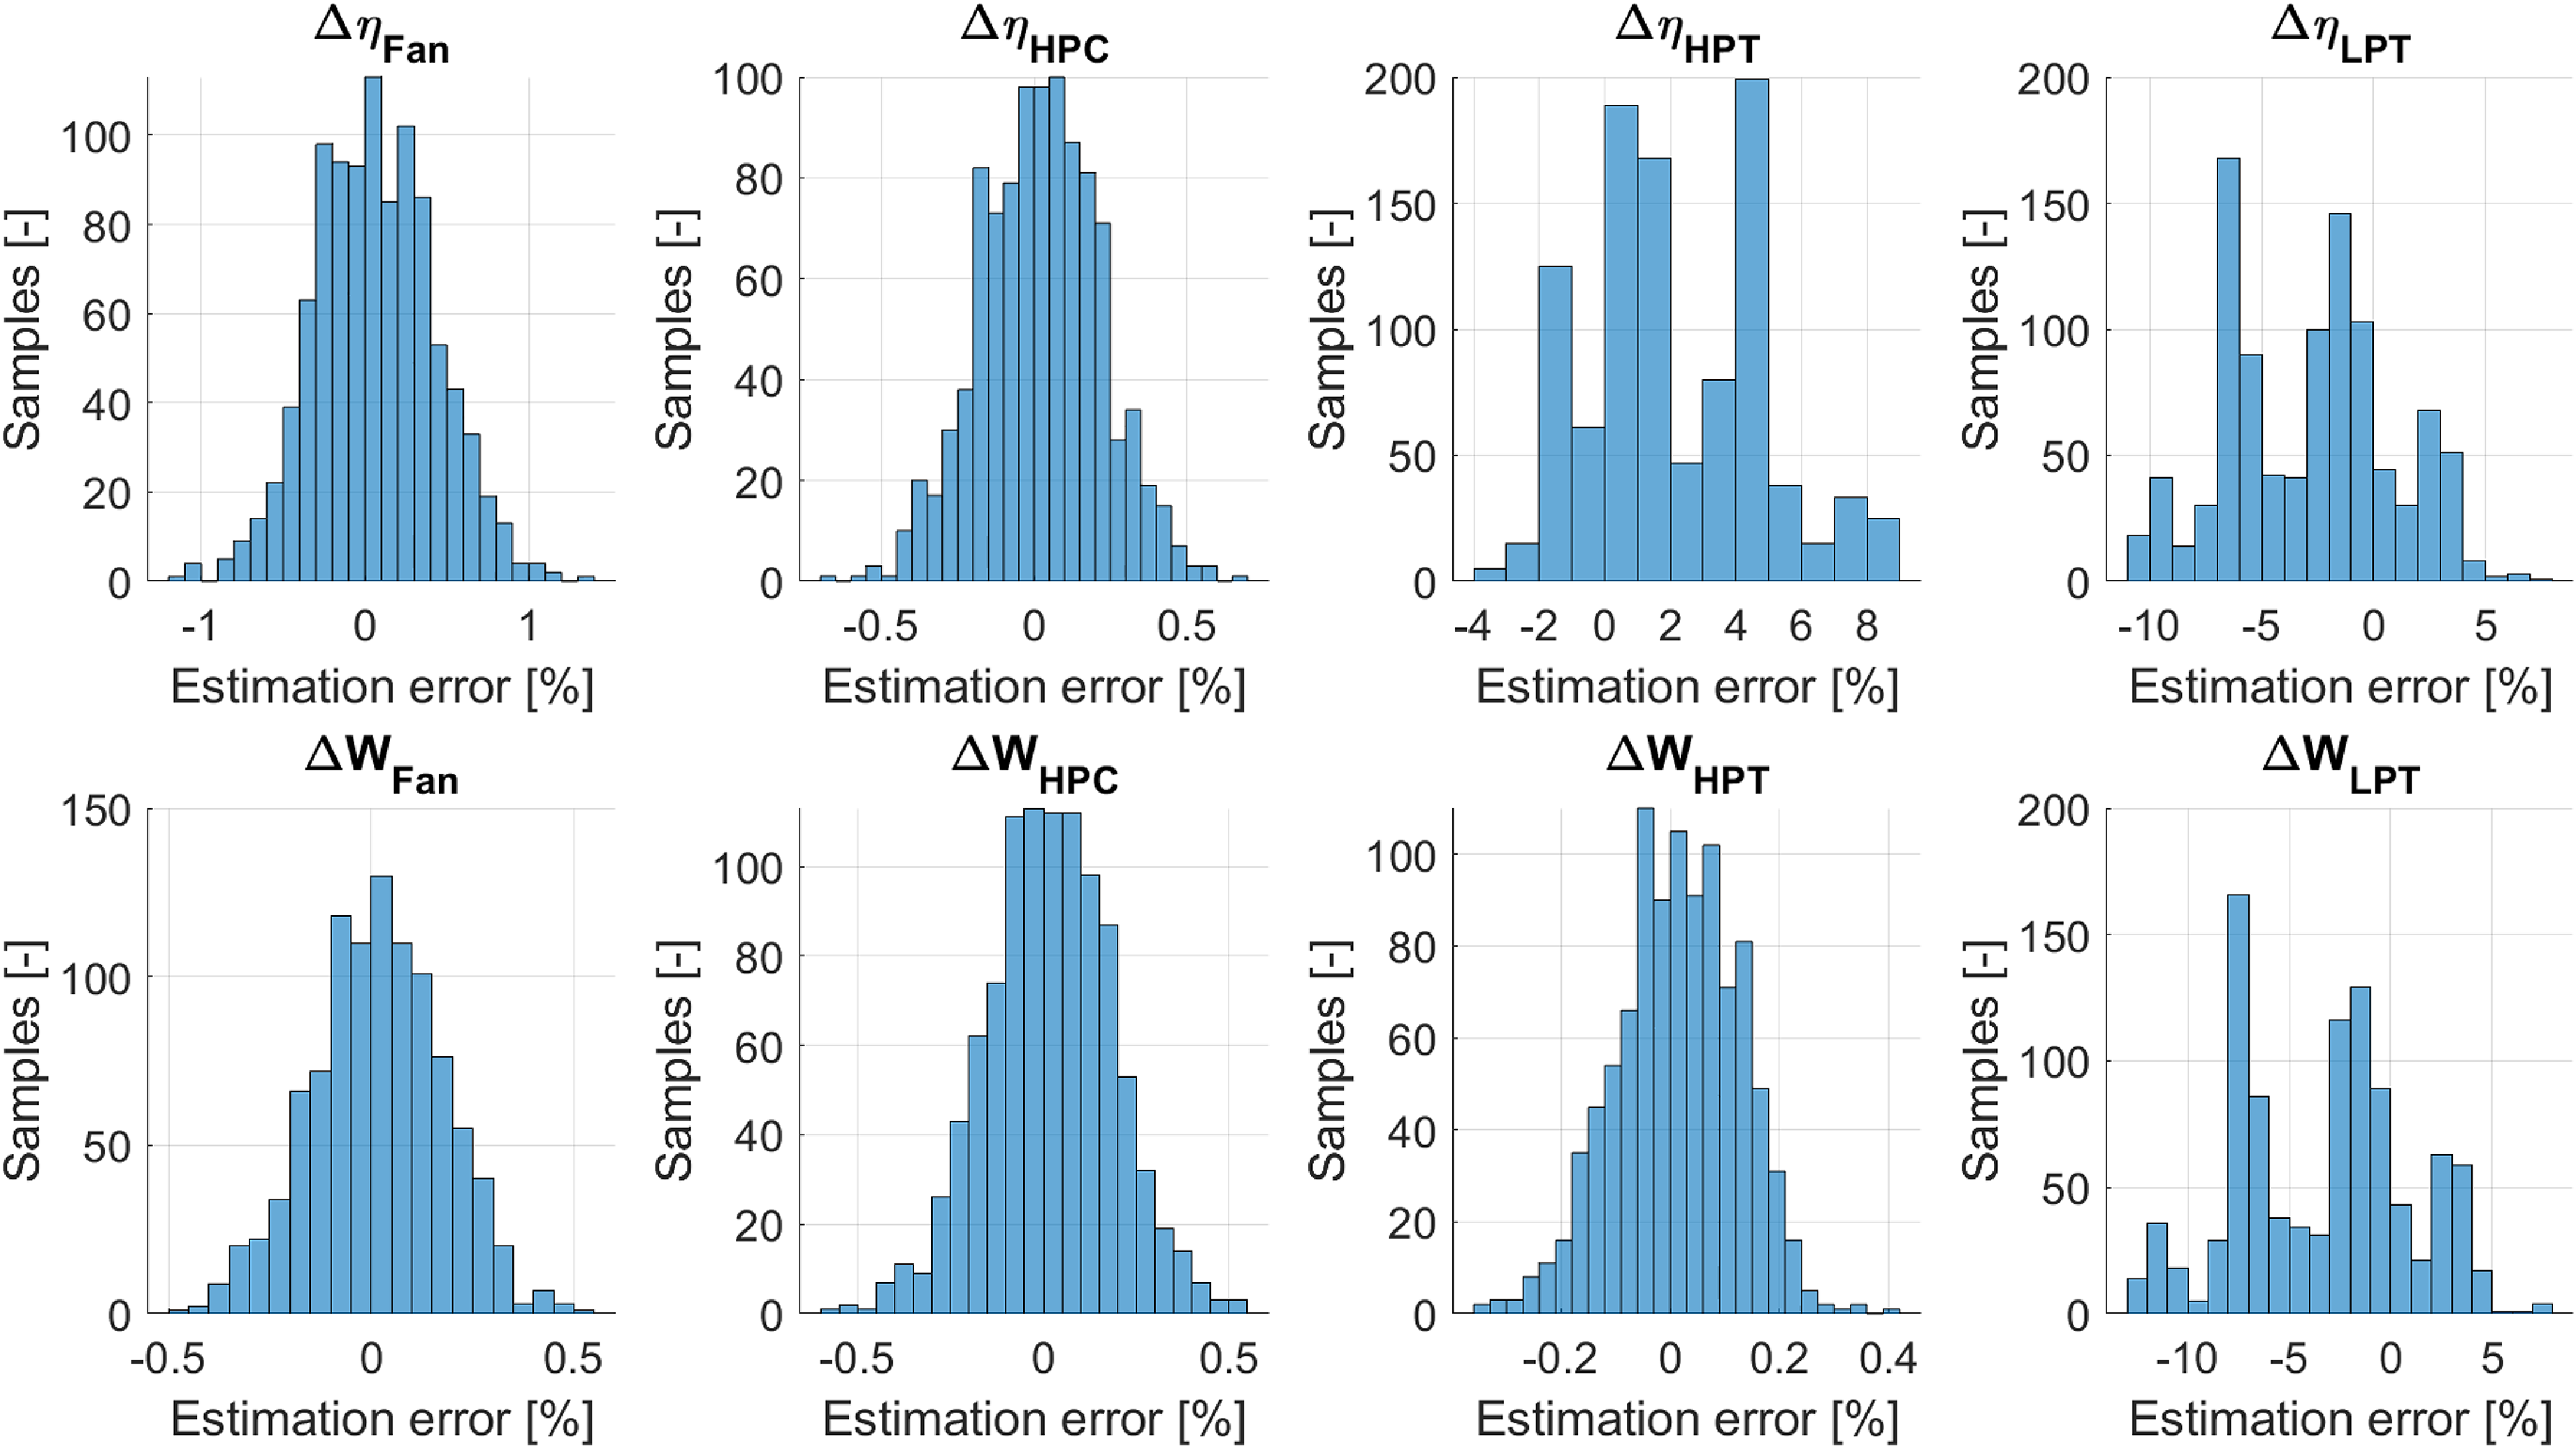
Relative to the components having low uncertainties, the HPT efficiency and LPT health parameters are in the range of  $10$ to $20$ times higher. Worth noticing is that the distribution of the turbine uncertainties does not seem to be centred on zero, even though no bias is introduced in the measurement uncertainties. This indicates that the bias is introduced by the optimiser when minimising the scatter in health parameters. The reason for this is not completely worked out, but a theory is that it is connected to the non-linearity of the turbine component characteristics. Since the gradients of the pressure ratio and efficiency, relative to the map $\beta $, vary in the map, it is possible that the solution tends to drift toward areas with lower gradients, since this could potentially reduce the residual value in Equation (9). This could also be a contributing factor for the probability distribution not being Gaussian. As mentioned, it is not entirely clarified if this is the case; further studies are required to get a definitive answer.
4.2 Multi-point diagnostics
To perform an evaluation of the multi-point diagnostic method in the presence of model uncertainties, a selection of what map to skew and to what extent must be made. As a first choice, it is selected to only skew a single map instead of multiple maps simultaneously. In a realistic case, one would expect that there is some degree of uncertainty in all maps, but to make the result more interpretative when it comes to mapping the observed effect to specific map features, a selection to skew only a single map at a time is taken. The next step is to select what map to skew and evaluate. Experience has shown that skewing the fan or HPC map will, in essence, only affect the component with the skewed map. This is due to the high level of instrumentation for these components, which effectively dictates both the input and output gas path state of the components. There is, however, a minor effect on the turbines since the power balance may change slightly, but these effects are generally very small. Due to the low levels of fault interaction, if the fan or HPC map is evaluated, these are discarded from the analysis. This leaves the turbine maps, where a similar argument as for the compressing components can be made regarding the HPT flow capacity. This leaves the LPT map, which is expected to have the most effect on the remaining health parameters.
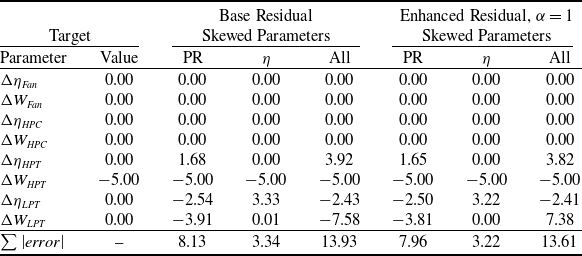
In Table 5, results for the multi-point diagnostics with a skewed LPT map and no measurement noise is shown. The bottom row displays the summed absolute total error compared to the target data in column  $2$. The base and enhanced residual columns refer to results obtained with the method formulated in Sections 3.4 and 3.6, respectively. For the enhanced residual, the weight factor $\alpha $ is set to a value of $1$, which implies a linear correlation between the weights and distance to the DP. Map skewness factors are shown in Table 6, and the target degradation data is a $5{\rm{\% }}$ decrease in HPT flow capacity. There are two rationales for the selected skewness levels in Table 6. First is to have a highly skewed map to introduce large errors. Through this, it is easier to highlight the effect of the skewness since it will have a major impact on the diagnostic result. The second rationale is that the skewed map shall not cause any numerical issues, such as non-converged operating conditions. The values in Table 6 were selected through the user experience of the diagnostic process while having these requirements in mind.
Multi-point diagnostic result rounded to two decimals. LPT map skewed according to magnitudes in Table 6. No measurement noise. All values given in [%]
LPT map skewness factors

From Table 5, the same trend as seen in the noise uncertainty propagation analysis is observed, where the compressing components and the HPT flow capacity show very good agreement with the target data. With a resolution of two decimals, the deviation is not even visible. This is, as previously mentioned, due to the high level of instrumentation for these components. They are only affected by secondary effects from slight variations in shaft power. Another noticeable feature in the table is that the effect of skewed efficiency is local to the corresponding health parameter. This may seem odd, since an erroneous efficiency will affect the temperature ratio over the component and, since there are no inter-turbine measurements, this type of fault usually smears out over both turbines. The target of the multi-point algorithm is, however, to minimise the scatter in overall results for all health parameters. If the error were to spread to the HPT efficiency as well it would cause an increased overall scatter, which is the reason for the isolated effect.
When the map pressure ratio is skewed, the effect will spread to the HPT efficiency as well. An erroneous pressure ratio will lead to an incorrect change in enthalpy, which in turn affects the power transferred from the turbine to the shaft driving the fan. Since the change in enthalpy is strongly connected to the temperature ratio, the interstage temperature will be wrong, leading to an error in isentropic efficiency for both the HPT and LPT. To balance the power from the LPT, the mass flow is also affected.
When all map parameters are skewed simultaneously, it is more difficult to track the root cause of the various health parameter deviations. It is, however, clear that the compressing components and the HPT flow capacity are still mainly unaffected. When looking at the overall total error, this is larger than the sum of the individual skewness from the pressure ratio and efficiency. At the same time, the estimation error in LPT efficiency is about the same as for the scenario with only a skewed pressure ratio. This means that in the presence of errors in pressure ratio, errors in efficiency tend to be pushed toward the remaining health parameters. While doing so, there is an increase in the total error. It should, however, be noted that the observed tendencies are highly related to the skewness levels implanted. While the evaluated levels lead to an increase in absolute total error, certain combinations of skewness levels may lead to scenarios where the effects from erroneous pressure ratio and efficiency are canceled out, thereby reducing the total absolute error.
A comparison of the base and enhanced residual results in Table 5 shows that the health parameter estimation errors are reduced for all health parameters and combinations of skewness. The reason for this is, as explained in Section 3.6, that the points further away from the DP are given less weight in the optimised solution. In Table 5, a value of  $1$ for $\alpha $ is used, which corresponds to a linear trend between the weight factors and distance from the DP. By varying the value of $\alpha $, a non-linear trend can be obtained. In Fig. 8, the total absolute error is shown as a function of various levels of $\alpha $ both with and without measurement noise. For the data with noise in Fig. 8, an average of $10$ samples for each measurement has been used as filtering. The dashed line shows the result without measurement noise, and the triangle marker indicates the optimal value of $\alpha $ as $2.8$. The solid line is a curve fit with a third-order polynomial to the filled red markers, which is with measurement noise filtered as previously mentioned. ${\rm{One\;hundred}}$ simulations with noise, at different random seeds, have been performed, and the red dots show the average of these while the error bars show the standard deviation. Optimal value of $\alpha $ is taken at the minimum value of the fitted curve, giving an optimal value of about $2.5$. The fact that the optimal value of $\alpha $ change when measurement noise is introduced is a clear indication that adding operating conditions to the analysis, even if they are of high model uncertainty, can reduce the effect of measurement uncertainty if the weight factor is set accordingly. It should also be noted that the result in Fig. 8 is explicitly related to the operating conditions in Section 3.5. If the operating conditions going into the analysis change, so will the curves. The optimal value of $\alpha $ shown here is therefore only valid under these circumstances.
Total diagnostic errors for various levels of weight factor  ${\rm{\alpha }}$ with and without measurement noise.

Another interesting feature in Fig. 8 is the magnitudes of the total error. When noise is added to the analysis, the average total error is systematically higher than the corresponding noise-free result. As previously mentioned, this is an effect also noted in the noise uncertainty propagation analysis. Since the measurement uncertainties separating the solutions are of Gaussian distribution without bias, the expected outcome was that the two curves should have been much closer to each other. What is seen here is an effect of the optimiser, where the estimation error due to measurement noise is smeared over several health parameters. By doing so, a bias in total error is introduced, highlighting the importance of filtering the measurements going into the analysis.
When comparing the baseline residual, as proposed in Section 3.4, to the enhanced residual in Section 3.6, an improvement in the health parameter estimations can be seen. In Table 5, this has already been shown when using a value of  $1$ for $\alpha $. In the case without measurement noise, using the optimum value of $\alpha $ will give a total estimation error of about $13.42{\rm{\% }}$, compared to $13.93{\rm{\% }}$ with the baseline residual. This corresponds to a relative reduction of about $3.7{\rm{\% }}$ of the error introduced by the model uncertainties.
5.0 Discussion
In the presented study, several assumptions have been undertaken. One of these assumptions relates to the skewness of the component maps. As seen in the result in Section 4.2, the errors in the estimated health parameters are much larger than what would be considered to be acceptable in a practical context. The main source of these errors is the level of map skewness, which is more than  $10{\rm{\% }}$ off at lower part power settings. In real-world applications, it is highly unlikely that such poor performance of the model would be acceptable for this type of model-based diagnostics. The error magnitudes are simply selected to more clearly show the effect of the enhanced multi-point residual.
Another feature worth noticing relates to the non-linear distance calculation presented in Equation (13). For this study, the formulation only takes corrected speed  $Nc$ and $\beta $ into account. While this is a suitable formulation for the map skewness applied in this study, this may not always be the case. During operation, various flow properties such as the Reynolds number and flow incidence angle may also give rise to OD uncertainties. If not considered in the distance calculation, such factors may reduce the effect of the uncertainty mitigation. In general, it can be said that all knowledge available about the uncertainties should go into the distance calculation to maximise the effect of the proposed method.
When it comes to the health parameter estimations, this may also be tuned to the specific needs and behaviour. In this study, it is assumed that the degradations have the same absolute magnitudes, regardless of operating conditions. In practice, though, it may be that certain faults and degradations experience different magnitudes depending on the operating conditions. If such information is known, it is advantageous to include it in the residual calculation to further tune the method to a specific behaviour.
The final observation relates to the residual calculation. While the implementation is fairly straightforward, other options could be preferred depending on the intended outcome. One such example would be to base the residual calculation on an information-theoretic metric [Reference Beisbart and Saam45] or metrics based on the concept proposed by Shannon in [Reference Shannon48], such as the Kullback-Leibler divergence [Reference Kullback and Leibler49]. Such an approach could enable a digital thread from uncertainty characterisation all the way to health parameter estimation and subsequent condition-based maintenance.
6.0 Conclusions
A study of a multi-point model-based diagnostic method for an underdetermined system of equations in the presence of model uncertainties has been presented while highlighting the importance of UQ, both in terms of knowing the sources of uncertainties as well as handling them in a suitable manner. It has been shown that the proposed diagnostic method performs well for the compressing components and HPT flow capacity, even in the presence of measurement noise and uncertainties to the LPT component characteristics. For the well-instrumented components, an erroneous component map will mainly affect their own health parameter estimation. The turbine health parameters, HPT flow capacity excluded, is, however, more prone to smearing effects due to the lack of inter-turbine measurements. Model uncertainties can, even if the exact source and magnitude is unknown, to some extent be mitigated by tuning the optimisation objective value, herein denoted as residual. For the operating conditions studied, a relative reduction of about  $3.7{\rm{\% }}$ in total estimation error was observed when tuning the residual. While this reduction may seem small in absolute numbers, it highlights the single most important aspect of the paper, which is to show that the effect of uncertainties may be mitigated to various extents, even when detailed knowledge of the uncertainties, both in terms of magnitude and location, remains unknown.
Acknowledgements
The authors gratefully acknowledge the financial support through the THEMIS project.


 Open access

