

Introduction
With the appointment of Giorgia Meloni as prime minister in 2022 and the election of Elly Schlein as leader of the main opposition party in 2023, it would seem that the glass ceiling preventing women from reaching positions of power and prestige in society and politics has finally been broken in Italy. One swallow, however, does not a summer make; and not even two swallows can bring on a season of gender equality in politics. Despite this undeniable step forward, Italy appears rather behind compared to other Western countries in rankings of equal opportunities between women and men in politics. In 2023, Italy came 64th (out of 146) in the World Economic Forum's global ranking for the Political Empowerment Index (also moving down 16 places compared to 2022). The country is in 26th place in Europe, only ahead of Bosnia and Herzegovina, Romania, Greece, Hungary, Czechia and Cyprus (World Economic Forum 2022, 18).
This persistent, problematic marginality of women in Italian politics has solicited constant attention from political and social science scholars. Studies have especially focused on female representation at parliamentary (Guadagnini Reference Guadagnini, Lovenduski and Norris1993; Regalia Reference Regalia2021) and regional (Del Re Reference Del Re1999) levels. Some authors have also devoted attention to local politics (Del Re Reference Del Re2004; Carbone and Farina Reference Carbone and Farina2020); other research provides details on women in local Italian political institutions from a comparative perspective (Medir et al. Reference Medir, Navarro, Magnier and Cabria2022; Sundström and Stockemer Reference Sundström and Stockemer2015; Navarro and Medir Reference Navarro, Medir, Bertrana, Egner and Heinelt2015). Analysis particularly focuses on women mayors and city councillors (Carbone Reference Carbone2016), as well as women elected at a sub-municipal level (Massa Reference Massa2013). Overall, these studies on women in Italy have concerned elected women for the most part, disregarding women candidates, to whom relatively few studies have been dedicated (Regalia Reference Regalia2021; Del Re Reference Del Re1999; Sampugnaro and Montemagno Reference Sampugnaro and Montemagno2020). This lack of analysis on women candidates is pronounced when it comes to local politics, as observed more generally in international literature (Bird Reference Bird2003; Anzia and Bernhard Reference Anzia and Bernhard2022; Schwenk Reference Schwenk2022), so much so that UN Women has recently indicated that this line of research deserves more attention (Berevoescu and Ballington Reference Berevoescu and Ballington2022). As far as research sources and techniques are concerned, most studies on local political representation are based on official data that consider a short length of time or, when a longer period is considered, on information that solely concerns the presence of women. In other cases, however, survey techniques have been used to gather a wealth of information, but from a relatively restricted sample size or from individual case studies.
An analysis of the literature, here only briefly summarised, thus reveals that there is a lack of studies on women candidates and elected women mayors that consider both sociodemographic issues and electoral results and that look at a sufficient length of time. We are attempting to fill that gap with this article, which is based specifically on an analysis of an original database that contains sociodemographic, electoral and political data about all the men and women candidates running for mayor from 1993 to 2021. Having access, for the first time, to information about the entire population of men and women candidates allows us to shed light on the mechanisms for the selection of women and their advancement in political careers. At the same time, the data analysis allows us to compare the individual characteristics and career paths of women candidates with those of men, thus highlighting potential differences in the sociodemographic and political profile of the two groups. Furthermore, the characteristics of women candidates can be compared to those of elected women, to show which social, demographic and political traits facilitate the political success of women, keeping in mind institutional and social context.
This article thus questions several classic assumptions about the presence of women in politics. We ask whether these assumptions are still valid or whether there have been signs of change in Italy – and, if so, which ones – over the last 30 years. The first such assumption concerns the gender gap itself, which is known to be narrowing but only very slowly in almost all Western democracies. To this end, considering women candidates as well as elected women can help us better understand the exact location of the barrier that blocks the path to equality of gender representation. The relevant literature clearly establishes that the factors that impact the descriptive representation (Pitkin Reference Pitkin1967) of women are diverse and interlinked: socioeconomic, institutional, cultural and ideological (Mateo Diaz Reference Mateo Diaz2005; Stevens Reference Stevens2007). All these elements affect both the propensity of women to stand for office (supply) and the possibility that the parties and the electorate will effectively choose to nominate and elect women (demand) (Randall Reference Randall1982; Norris and Lovenduski Reference Norris and Lovenduski1995). Is it the election itself that is responsible for the underrepresentation of women? Or is electoral contest just another element that sharpens a disparity that is already very pronounced from the start, during candidacy?
In addition to answering this essential question, the analysis conducted in this article allows us to confront certain elements of women's relationship with politics that are highlighted by the literature. For example, by considering the population size of municipalities, we shall see whether and to what degree it is still true that the gender gap increases as political offices become more desirable and important. In small municipalities, running for mayoral office can be understood as a form of political participation, which becomes particularly intense if the candidate is successful and becomes mayor. In medium-sized and large municipalities, running for and especially becoming mayor fall fully into the realm of political professionalism.Footnote 1 In fact, a mayor of a medium to large city is no less relevant than a member of parliament in terms of prestige and political power. The selection process for candidates for such important posts is typically carried out by political parties, which largely remain homosocial networks (Bjarnegård Reference Bjarnegård2013, 21–29) and are one of the main obstacles that prevent the feminisation of politics (Lovenduski Reference Lovenduski2005, 56–58). Because of this, we expect more woman candidates and elected mayors in small municipalities than in large ones.
Many studies have shown that the gender gap in politics is nothing more than a reflection of a more generalised gender gap that is found in society. Consequently, in more egalitarian societies, where women are less disadvantaged in the workforce and less relegated to traditional family and caregiver roles, the participation in political life of men and women is less unbalanced (Inglehart and Norris Reference Inglehart and Norris2003). The Italian case is particularly suited to an investigation of this issue. Indeed, Italy has recorded the most marked regional differences of all European countries; in the rich north-central regions women participate more actively in the job market, while in the southern regions women are more marginalised. From this perspective, we expect to find fewer women candidates in territories where the condition of women is more disadvantaged, and that candidates have to work harder to establish themselves in the electoral sphere.
Despite persistent regional differences, in the last 30 years Italian society has seen a narrowing of social and economic differences between men and women, and political differences between the two genders also seem to be in gradual decline. Beyond the important successes of Meloni and Schlein recalled above, it is worth noting that the percentage of women in parliament has grown significantly since 1992 (although in the 2022 elections there was a standstill). This means, in terms of our research, that we expect to find that the number of local women candidates and elected women has increased over time.
Professionally working in politics is a task that requires the investment of significant energy and time. Governing a medium-sized or large municipality often involves sacrificing one's own professional and family life, hobbies, and even health. Even being mayor of a small municipality takes time and energy away from work (if the mayor does not ‘live off’ politics) and from private life. Being in politics requires, among other things, having sufficient time. This kind of availability varies greatly according to different variables: social background, type of employment, the candidate's stage of life, etc. One of these variables concerns the greater responsibility that women have in caregiver roles, with respect to their children and their own parents; this is particularly pronounced in Italy compared to other major Western European countries (Le Bihan, Knijn and Martin Reference Le Bihan, Knijn and Martin2013), both for cultural reasons and due to the shortcomings of the welfare system. Consequently, we expect lifecycle to impact the active participation in political life of women more than men. In more concrete terms, we expect the number of women candidates and elected women to be higher, relatively speaking, until the age of 30–35, and then to decline rapidly when the care of young children and elderly parents becomes, for many women, an obstacle to the start or continuation of a political career.
Certain material and symbolic resources are advantageous to candidates with political aspirations. For example, studies on political recruitment and political careers show that being part of a dominant ethnic group, being male, having a high education level, having a socially valued profession, having a higher income, and having a solid family network are all factors that increase the probabilities of success and progression in political careers (Putnam Reference Putnam1976). These same studies demonstrated that the higher the office an individual intends to hold, the more necessary a substantial combination of these resources. Given that being a woman is a disadvantage in political competition, we would expect women candidates and elected women to compensate for this deficit with other kinds of resources. Of those, our data allow us to evaluate the behaviour of the variable related to education level. Hence, just as is the case for women delegates to national party congresses (Bordandini and Mulè Reference Bordandini and Mulè2021, 87–88), we would expect women candidates and especially elected women to have higher educational qualifications overall than men competing for the same office.
Finally, with respect to the left–right spectrum, we expect women to be more present and valued in left and centre-left parties than in those aligning with the centre-right. As we know, feminist petitions and calls for the emancipation of women are loudest in the political culture of left-wing parties. In contrast, in many cases, including in Italy (Feo and Lavizzari Reference Feo and Lavizzari2021), right-wing parties understand the role of women in a ‘traditional’ manner, confined to the private family sphere (Farris Reference Farris2017).Footnote 2 In addition, it seems useful to explore the space reserved for women by parties that play their political game through protest and anti-establishment disputes. Given that these parties are often headed by leaders who assume the role of outsiders, and considering that being a woman in politics is considered an ‘outsider’ trait (Campus Reference Campus2013),Footnote 3 it is useful to look at whether women are better represented in protest parties.
This article is organised as follows. After this introductory presentation of the main theoretical and empirical issues that we aim to investigate, the next section provides several points on the introduction and operation of municipal electoral law, lingering in particular on the mechanisms that can facilitate or impede the participation of women in political life. The following section contains a detailed presentation of the sources that we used to build our dataset. We then analyse the dataset and discuss the role that social, demographic, regional and political issues play in influencing the presence and success of women in local politics. In the concluding section, we develop several considerations on the contribution that this study makes to our understanding of the role of women in politics, in particular with respect to the theoretical points identified in this introduction.
Genesis and main characteristics of the electoral system
Law no. 81 of 1993, which introduced the direct election of mayors, opened a season of reforms that aimed to reinvent the severely damaged relationship between voters, parties and the political class. The pursuit of this new relationship was mainly identified in the transition from a proportional approach to a majoritarian one, with respect to electoral laws. Unlike in the past, the new electoral law takes away the choice of mayor from municipal councillors and puts it directly in the hands of voters. Without going into detail about the electoral system, which over its 30 years of existence has been unanimously appreciated by commentators and scholars, it is necessary to examine the different ways of electing mayors and municipal councils in municipalities above and below 15,000 inhabitants. In municipalities with fewer than 15,000 inhabitants, the electoral system is a ‘first-past-the-post’ system. Therefore, each mayor is an expression of a single list of candidates for the municipal council and the list that gets most votes elects the mayor and, thanks to a majority bonus system, also the majority in the municipal council. This voting mechanism thus urges the parties and political forces to form coalitions under the banner of a single list. Consequently, the numbers of candidates for mayor and lists that compete with each other are typically low, usually ranging from two to four. In municipalities with more than 15,000 inhabitants, however, each candidate for mayor is usually associated with multiple lists. In this case, too, the electoral system is majoritarian, but it happens in two rounds: if no candidate gets an absolute majority of votes, another ballot is held two weeks later. In that event, the characteristics of the electoral system favour a proliferation of mayoral candidates and, especially in large cities, up to 20 lists.
Sources and method
The information presented in this article has been drawn from an extensive and original dataset built on the integration of two sources: the Historical Archives of the Elections, from which the data about electoral competitions were taken; and the Register of Local and Regional Councillors, from which information about the candidates for mayor were obtained (name and surname, date of birth, gender, educational qualifications).Footnote 4 The unit of analysis in the dataset is the individual candidate for mayor. There are 123,787 cases included in the dataset: 107,430 men and 16,357 women. These cases are in turn related to 45,441 electoral competitions that took place in 7,586 Italian municipalities between 1993 and 2021.Footnote 5 The information in the two ministerial archives contained some errors and several gaps, some of which have been filled while others have partially remained (such as date of birth and educational qualifications).Footnote 6
Findings: women and men compared
Women candidates and elected women: how many and who?
The starting point of our analysis concerns how many women ran and how many were elected during the application of the new electoral system introduced in 1993. Figure 1 shows the trend over time of the percentages of women candidates and elected women.
Percentage of women candidates and elected women (1993–2021) (N = 16,356)

As we can see, the percentage of women candidates and elected women was extremely limited at the start of the new electoral law. However, both values have grown over time, in some instances even surpassing 15 per cent. The percentage of candidates is systematically higher than that of elected women, which means that the election process does not favour women. To give an example, in 1993 only 8.6 out of 100 candidates were women, while only 6.4 per cent of those elected in that same session were women. In 2021, women made up 18.5 per cent of all candidates, but only 13.8 per cent of those elected were women.
We have clarified how many women ran as candidates and how many were elected, and how their presence has changed over time. It is now worth outlining their social and political characteristics and seeing how they differ from those of candidates and elected mayors who are men. A first element of particular interest is their stage of life. As can be seen in Figure 2, there are, relatively speaking, many young women among candidates and those elected. However, both percentages decrease as age increases. This is a sign that women encounter social, economic, cultural and political barriers that make it difficult for them to reconcile political engagement and private life.Footnote 7 Indeed, the participation of women in the Italian job market is characterised by a spike in the same age group, when there are not yet substantial care commitments, but this is then followed by a sharp decline.
Percentage of women candidates and elected women by age at the time of voting (N = 12,002)
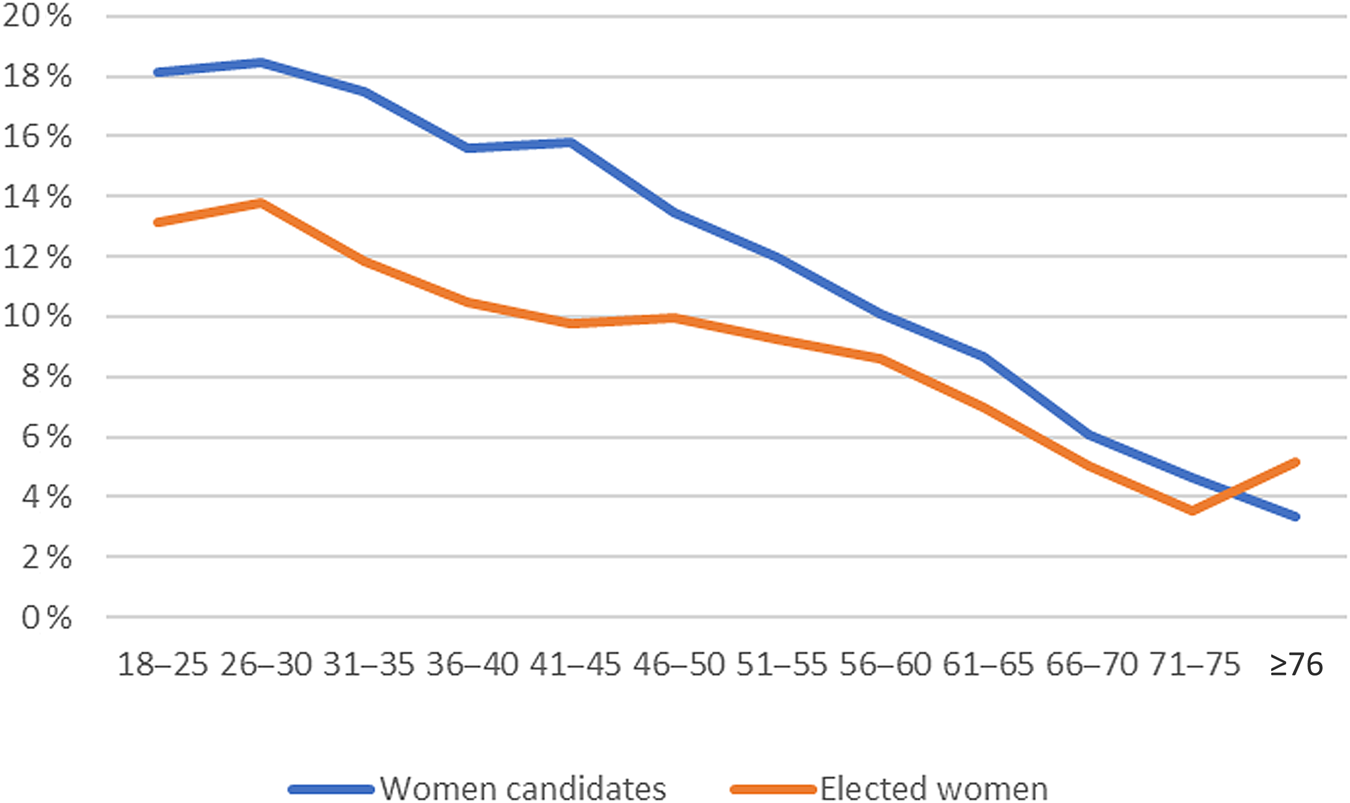
In short, space for women in local government gradually shrinks as they age: in the oldest age group, women candidates and elected women account for only 4 per cent. Partial consolation with respect to this uninspiring picture is found in the higher competitiveness of older women compared to younger women. Indeed, the data presented in Figure 2 show that the gap between the percentage of women candidates and that of elected women gradually narrows, until the latter category overtakes the former in the oldest age group.
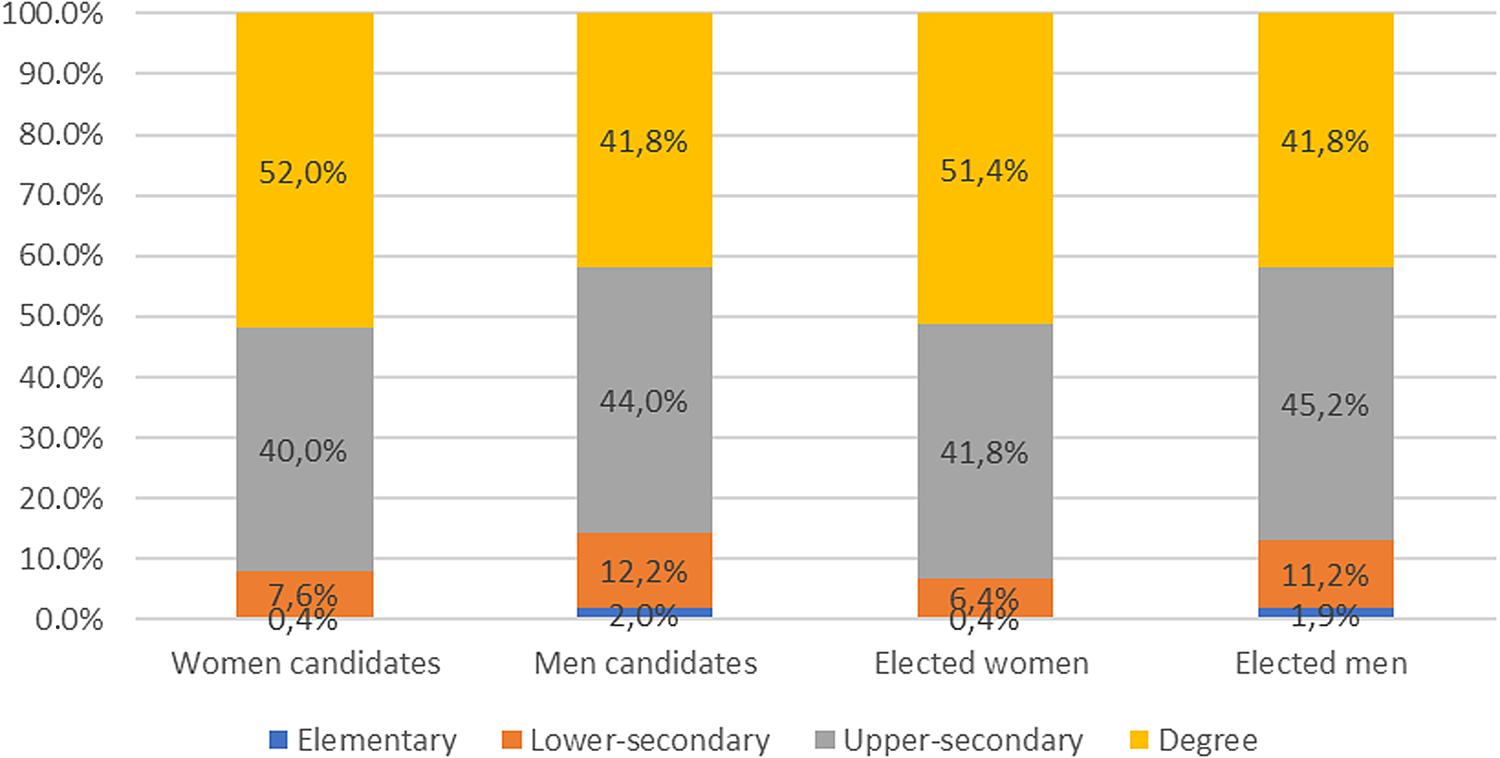
Although in the youngest groups the candidates have a relatively higher political weight, the overall average age of women candidates is only moderately lower than that of men. For the first group it is 46 years; for the second 48.8. Similar values are true for elected women (46.6) and men (48.6). A more detailed analysis (not shown here), which compares the age pyramid of women candidates with that of men, shows that women are systematically overrepresented in age groups up to 45–50 years. The different age composition of the two groups thus only partially explains the marked imbalance between the educational qualifications of the women candidates and elected mayors compared to those of the men (Figure 3).Footnote 8 It is true that the youngest age groups are characterised by higher average levels of education, just as it is true that in Italy women on average acquire higher educational qualifications than their male peers,Footnote 9 but these two facts do not account for the pronounced differences between the educational qualifications of the two groups of candidates. To explain such differences it is therefore more appropriate to consider the fact that women have access to fewer political resources in Italy. Consequently, to achieve the same level as men and have the same opportunities for success and a political career, women must compensate with other resources. Education seems to be one of the most important of these.
Education levels of candidates, both men and women (N = 95,933)
Socioeconomic differences and political inequalities: the role of geographical areas
As we know, Italy is characterised by persistent regional differences, with a richer and culturally secular north-central area and a southern area with a weaker manufacturing base and high unemployment rates, especially among young people and women. Moreover, in Italy there have historically been two geographically based political subcultures that have had a significant impact on individual political behaviour and voting: the ‘white’ subculture, widespread in the north-east and tied to Christian Democracy and the Catholic church; and the ‘red’ subculture (also called the Red Belt), present in several central regions (Tuscany, Emilia-Romagna, Umbria), with socialist-communist leanings. The South, however, has always been characterised by a particularistic political culture dominated by clientelism and with weaker party formations. These relevant social, cultural and economic differences between regions are the basis of the different living conditions and opportunities for the populations residing in these areas. Although today they have lost much of their capacity to shape the relationship between citizens and politics, the different regional political traditions still have an effect on political participation, voting behaviour and opportunities for political careers.
It is clear that those who suffer especially from these geographical inequalities are the social categories considered most marginalised, such as young people, the less educated, and women. For the purposes of our analysis, we should note that in geographical areas where women must make more effort to establish themselves socially and economically, those who wish to become involved in politics must deal with higher barriers than elsewhere. The consequence is fewer women in top positions in local government. In these areas women are caught in a double vice of political supply and demand.Footnote 10 First, voters in regions where the role of women is socially and economically more marginalised might prefer male candidates, believing women to be less capable of taking on roles of political responsibility. Second, in light of these considerations, parties could facilitate nominations of men, who would be more competitive in the electoral market.
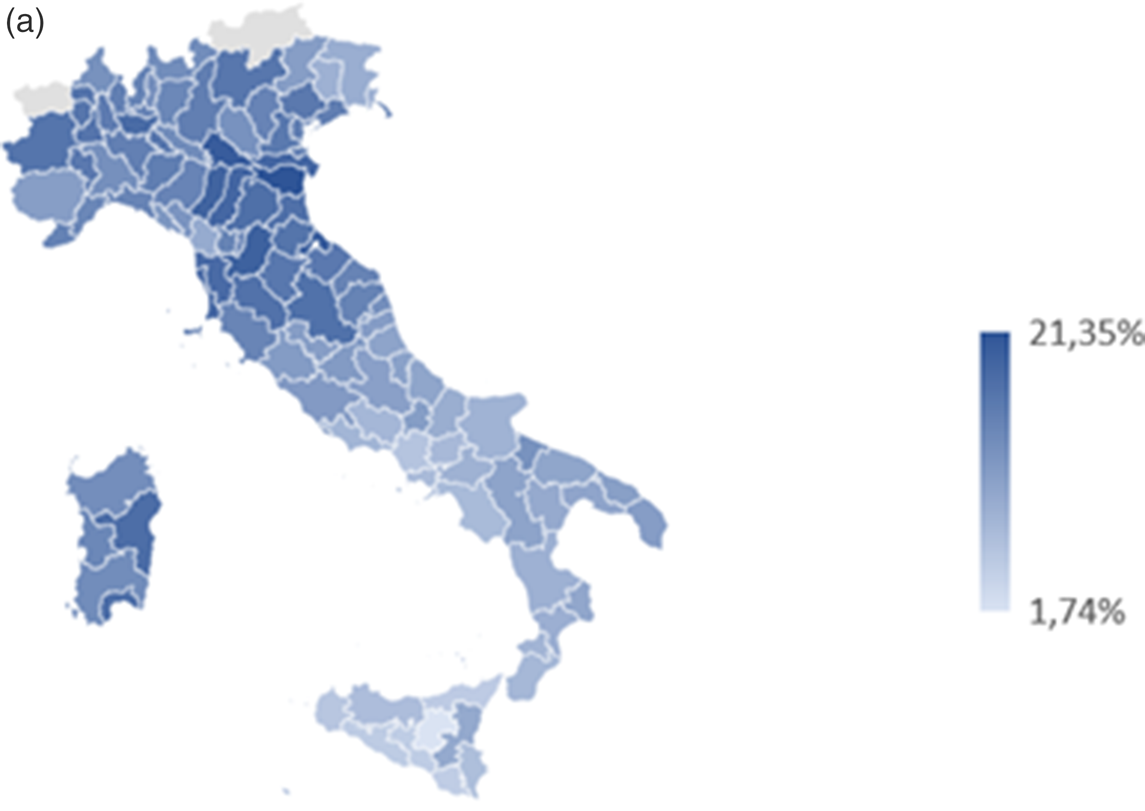
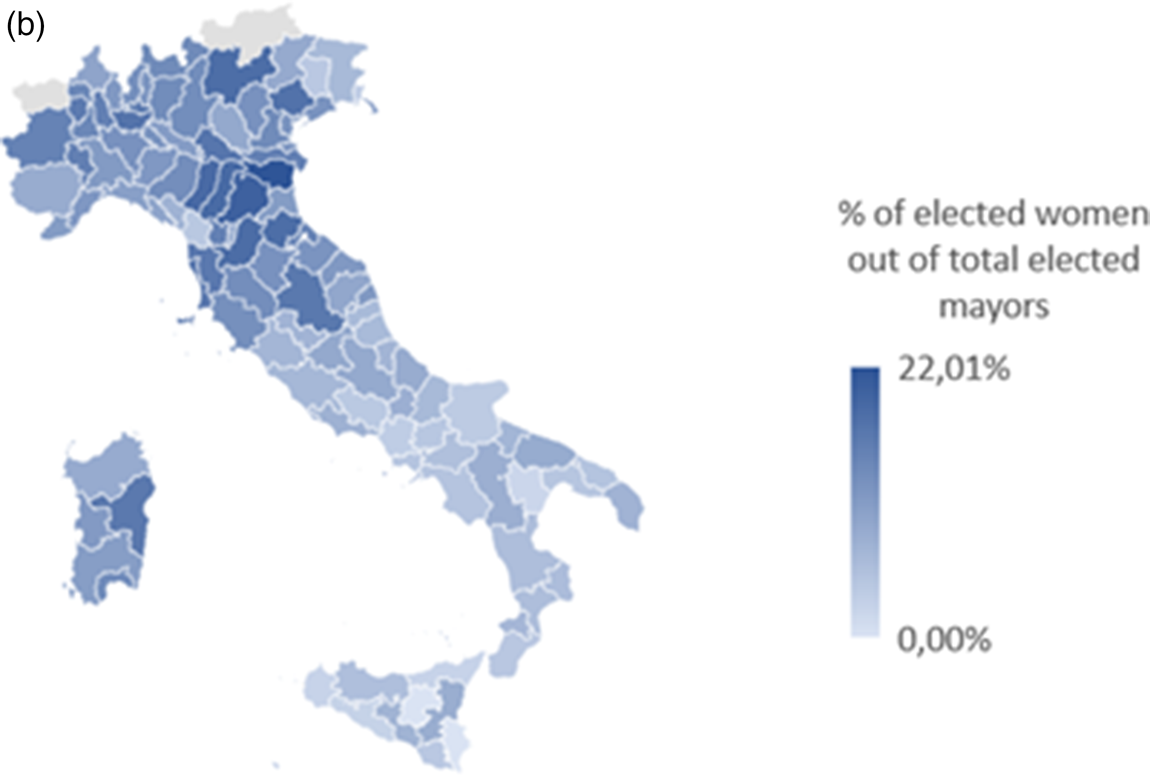
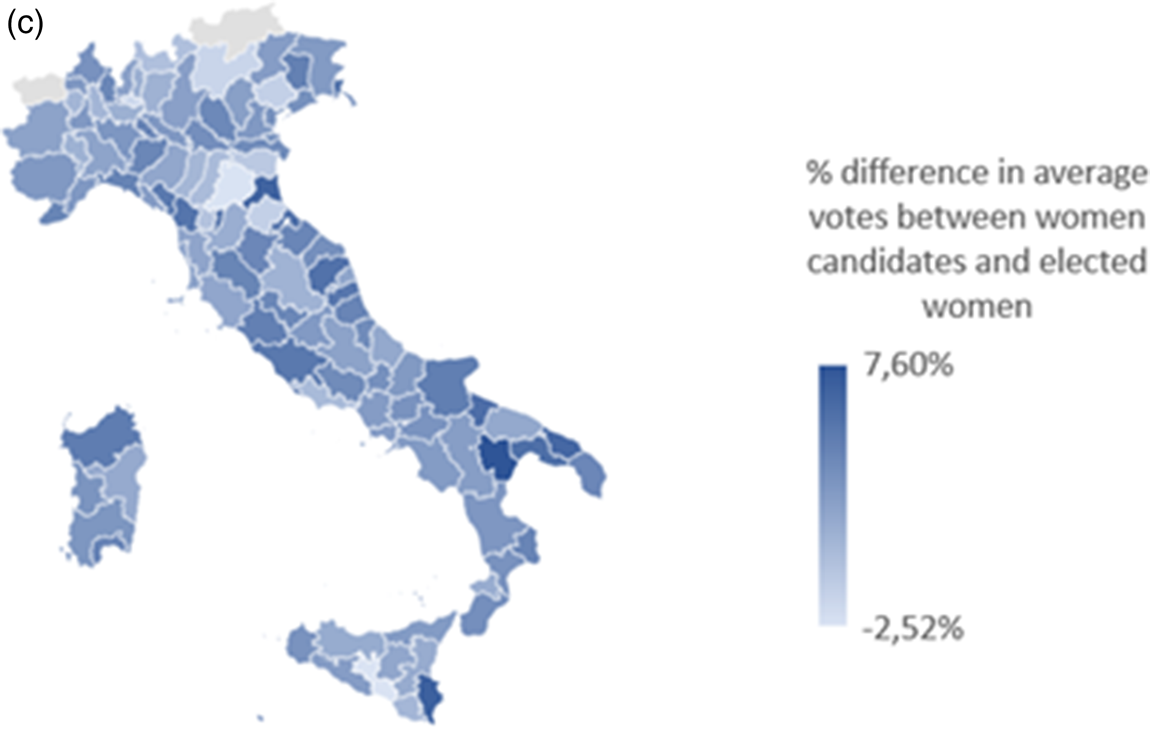
The analyses conducted, reported in four charts (Figures 4a, 4b, 4c and 4d),Footnote 11 seem to confirm this link between social and economic opportunities and political opportunities. As we can see, there are more women candidates in north-central regions (Figure 4a), with the exception of Sardinia. In the same north-central regions, perhaps even more markedly, women are more often elected (Figure 4b). In contrast, the ten provinces with the lowest rates of both women candidates and elected women are all concentrated in the southern regions, particularly Sicily. Although it is still more skewed towards the north-central regions, the rate of female success, given by the difference between the percentage of women candidates in the province and the percentage of elected women, seems more geographically balanced (Figure 4c). Finally, in south-central Italy, the differences between the average percentage of votes obtained by male candidates compared to those obtained by women candidates are very pronounced (Figure 4d).
Percentage of women candidates out of total candidates
Percentage of elected women out of total elected mayors
Percentage difference in average votes between women candidates and elected women
Percentage difference in average votes between men candidates and women candidates

We wished to further test the relationship between women's emancipation and political participation in local institutions (in the case of small municipalities) and political professionalism (in larger municipalities). To do so, we compared the differences, recorded on a province-by-province basis, between the rates of activityFootnote 12 between men and women and the differences of the average percentages gained by men candidates compared to women candidates. Figure 5 very clearly demonstrates the existing relationship (R = 0.42) between the two variables: in the provinces where differences in terms of participation in the workforce are more pronounced, women who ran for the office of mayor garnered much less support on average.
Rates of female activity and differences between the percentage of votes for men and women candidates (provincial averages; N = 123,787)

We have just seen that the North–South divide is a very important variable with respect to the political opportunities of women in local government. It also seems useful to consider the population size of municipalities.Footnote 13 As noted, the larger a municipality is (in demographic terms), the more important and desired its offices will be. Consequently, the political engagement required will also be more intense. The literature on political participation and political recruitment, partially cited above, agrees that women are increasingly disadvantaged as the political office at stake becomes more important. We should thus expect an inverse relationship between the presence of women and the population size of municipalities. Indeed, as Figure 6 shows, women manage to maintain a discrete presence, both as candidates and elected mayors, in municipalities of up to 15,000 inhabitants. In the intermediate category of municipalities, those with a population of between 15,000 and 100,000 inhabitants, women decidedly lose ground among candidates and elected mayors. In contrast to what we might expect, in municipalities with more than 100,000 inhabitants, women are more represented than in the average category of municipalities, so much so that the percentage of women candidates almost reaches its peak. One possible explanation for this is that large municipalities are also the ones that have national political and symbolic significance (as well as media clout). A further possible reason why the percentages of women candidates and elected mayors increase rather than decrease in the largest municipalities is that these are relatively cosmopolitan settings where, in contrast to the smaller municipalities, both party selectors and voters are less likely to be prejudiced against women. Since the choice of candidatures in large cities is more the prerogative of the central party apparatuses than of local civil society, parties may use female candidatures in large cities to give a newer, less conventional image of themselves.
Percentage of women candidates and elected women by municipal population size (N = 123,787)

Political factors
To complete the picture of women candidates and women elected for mayoral office, it makes sense to examine a more specifically political variable: the left–right orientation of the lists or coalitions that include women candidates and elected women. To do this, a political affiliation was assigned to each candidate by jointly considering the political orientation of individual party lists and the overall coalition profile.Footnote 14 Rather than using the usual five-step spectrum from left to right, due to the peculiarities of the Italian party system, the Lega Nord (now the Lega per Salvini Premier) and the Five Star Movement (5SM) have been kept as standalone categories. The first is a political force that emerged at the end of the 1980s and adopted a strong anti-establishment bent that it has maintained even after coming to power. It is a party that initially denied the saliency of the left–right spectrum, except to establish itself firmly to the right of the political spectrum as of the mid-1990s. The Lega is historically rooted in the North of the country and, at least until 2014, could be called an ethno-regionalist party. The rhetoric of the party's representatives, in particular of its leaders, has often been marked by machismo and crass slogans. Its political and policy line does not give particular consideration to the role of women in society and politics, relegating them to the traditional role of mother (Avanza Reference Avanza, Fillieule and Roux2008). In contrast, the 5SM is a movement party or protest party that asserted itself in a sensational and unexpected fashion in the political elections of 2013 and 2018. Until the 2022 elections, the 5SM did not have an exact location on the left–right axis (Mosca and Tronconi Reference Mosca and Tronconi2019) and its policy base ranged from environmentalism to protest against political professionalism and to policies for a basic income. The 5SM is also not known for paying special attention to the role of women in politics and society.
The classification of the political leanings of men and women candidates is therefore articulated in seven political or party positions (left, centre-left, centre, centre-right, right, Lega, 5SM), to which an eighth important category can be added that encompasses all the ‘civic’ lists or those that cannot be associated with party formations.Footnote 15 Having defined the political space in which candidates and elected mayors move, it is now possible to see if female presence varies between different political camps. To this end, Figure 7 shows the percentages of women candidates and elected women for every 100 candidates and elected mayors in each political or party area. As we can see, the 5SM is the party that puts forward most women (23.1 out of 100) and has what is comparatively the biggest group of women mayors (of every 100 5SM mayors, 16.3 are women). We find the left coalition in second place in terms of female candidates, which is consistent with their progressive nature. Nonetheless, although it is true that for every 100 left-wing candidates 15.3 are women, for every 100 elected mayors only 8.7 fall into this category. Unexpectedly, given our earlier observations, women have a significant presence in the Lega, a party that on multiple occasions has expressed chauvinistic, misogynistic and generally vulgar ideas (Corica Reference Corica2024). Despite this, in 1993 the Lega established an internal association of ‘Padanian women’, which represents a pool of female activism and which may explain the relatively large presence of Lega women in local politics (Avanza Reference Avanza, Fillieule and Roux2008).
Percentage of women candidates and elected women according to the political leanings of the list or coalitions to which they are linked (N = 123,736)

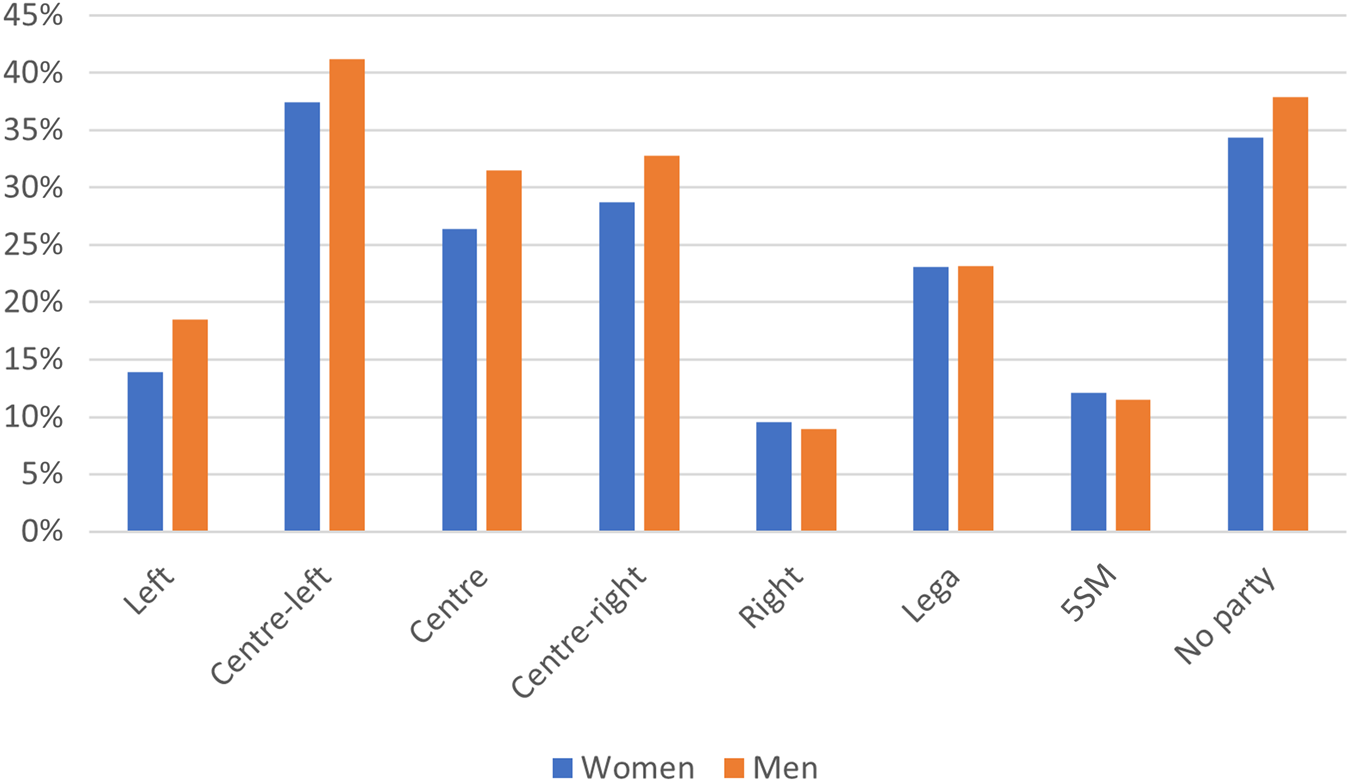
A confirmation of the varying importance and appeal of women candidates in different parties/groups was also obtained from Figure 8, which reports the average percentages obtained by women and men candidates by political group/party. The 5SM, which is famously uncompetitive in the local elections, has very low averages, but a slight prevalence for women over men. The Lega, which in the period considered had a very strong local presence in the northern regions, has higher election averages that are broadly the same for women (22.9 per cent) and men (23.1 per cent). Somewhat unexpectedly, the same is also true of candidates in the right-wing coalition, where both women and men obtain on average 8.4 per cent of the votes. In all other cases, the imbalance between men and women always favours the men, to a more or less pronounced degree.
Average percentage of votes for mayoral candidates by gender and political affiliation of the party, list or coalition to which they are linked (N = 123,736)
A final point touched on by this analysis concerns the re-election rates of incumbent mayors who run again for a new term. This matter can be considered an indicator of people's judgement about the mayor's conduct, and therefore it is interesting to explore whether women are more appreciated than men in the management of public affairs, and whether they are consequently re-elected more frequently than their male colleagues. However, there appear to be no major differences between incumbent women and men mayors: women incumbents who run again are re-elected in 71.6 per cent of cases, men in 72.9 per cent.
Characteristics of winning women candidates
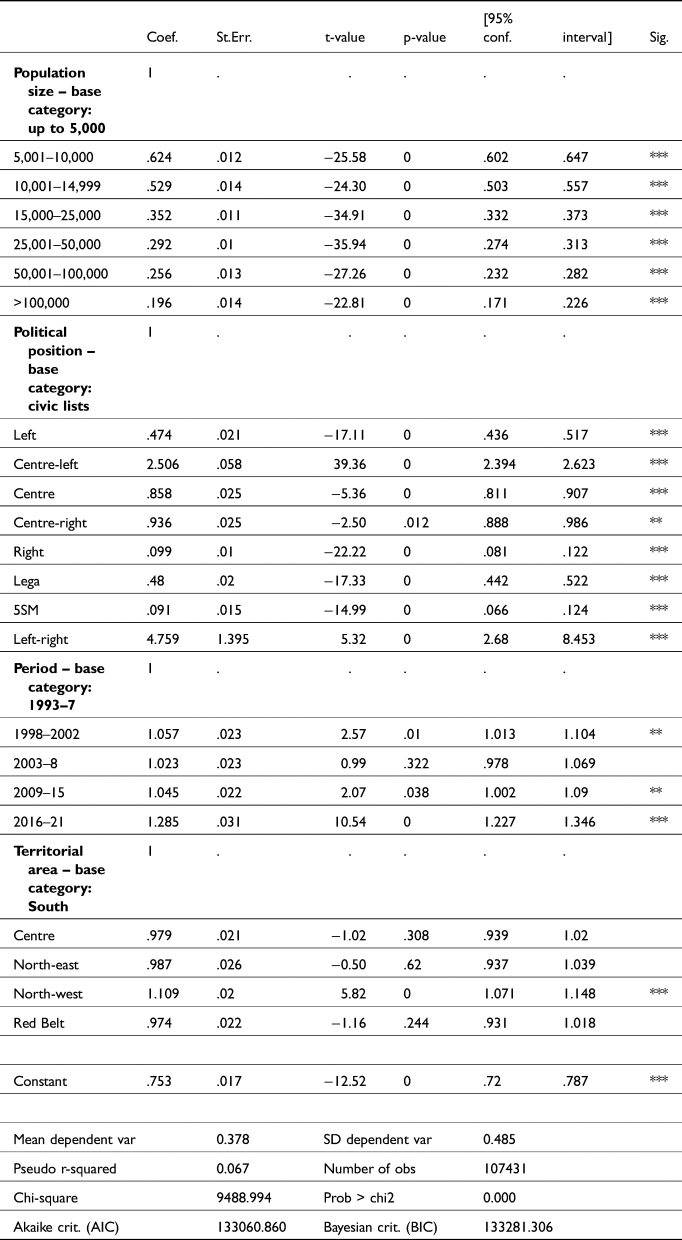
In the earlier sections we explored several specific aspects of the electoral success of women and men candidates for the office of mayor. To complete our review and better understand the territorial and political factors that explain the success of women in local government, we now proceed with a multivariate analysis that simultaneously considers the effect of such factors. More specifically, it consists of two logistic regression models – one for men, the other for women – whose dependent variable is the election (or lost election) of candidates. The independent variables considered are: population size of the municipality in which the electoral race takes place; the political orientation of the candidate's list or coalition; the period in which the election took place; and the geographical area where the municipality is located. Education level and age at the time of the election were excluded from the analysis due to missing data. To highlight the specific differences between women and men candidates, the results of the two logistic regressions are both presented in Figure 9 (the regression output tables are reported in the Appendix in their entirety).
Logistic regressions of election outcome with respect to territorial and political covariates (N = 123,736)

Looking at municipal population size, the logistic regression is in line with what we have already seen, showing that women find it harder than men to get elected in municipalities with over 50,000 inhabitants. With regard to the political affiliations of the lists or coalitions of the candidates, women of the centre-left seem to have more chance of being elected compared to men in the same political camp. Women seem to be more successful following the initial trials of the new electoral law, confirming the trend that they have become more present and prominent in local government over time. Finally, there are particularly marked differences when it comes to territory: the figure shows very clearly that women are politically much more penalised in the southern regions (i.e. in those regions where they are already socially and economically disadvantaged).
Discussion
The analysis conducted in the preceding section allows us to provide several responses to the questions posed in the introduction. The first of these questions concerned the relationship between the importance of the office and the presence and success of women in politics. In light of the literature, it was expected that the more important the desired office was, the fewer women we would find. In reality, this is only partially the case. As Figure 6 shows, the percentage of women candidates and elected women is virtually constant in smaller and small-to-medium municipalities (up to 25,000 inhabitants). In medium and medium-to-large municipalities (from 25,000 to 100,000), in line with our expectations, the percentage of women candidates and especially elected women decreases, until reaching a minimum of about 5 per cent in municipalities with 50,000 to 100,000 inhabitants. Contrary to expectations, however, in municipalities with more than 100,000 inhabitants, the presence of women did not continue its decline; instead, both the percentage of women candidates and that of elected women increased. This nonlinear relationship between the importance of the office and the presence of women may possibly be explained in part by the visibility and political importance of candidates and elected mayors in larger municipalities. Especially after the introduction of their direct election in 1993, mayors in big cities are part of a political game that is not only local, so much so that sometimes former ministers and former national party secretaries decide to ‘downgrade’ to the municipal level (Lo Russo and Verzichelli Reference Lo Russo, Verzichelli, Edinger and Jahr2015). They take part in the national political debate and contribute to building the public image of the party or coalition. Think, for example, of the contribution that the women mayors of Rome and Turin, both members of the 5SM, made between 2016 and 2021 to the image of a challenger party that was aiming to gain government positions. Having women run for office and get elected in highly visible roles can therefore be a conscious strategy that parties follow to improve their own public image, which has been destroyed by the antipolitical wind that has been blowing on Western democracies, and especially in Italy, for decades (Mete Reference Mete2022). This, however, is only possible in larger urban settings, where presumably the equal role of women is more culturally legitimised.
A second research question concerned the link between the role of women in society and the political posts that they manage to obtain. From this perspective, as a reflection of the reduction in gender differences in Italy over the last 30 years, we were expecting the presence of women and their importance in local politics to grow over time. Moreover, considering the great differences in economic vitality and cultural openness across Italian regions, we were expecting women to be better represented and more successful in the north-central area compared to southern Italy. Indeed, as Figure 1 shows, in the last 30 years the percentage of women candidates and elected women in the mayoral office has grown substantially, despite remaining far from equal to that of men. At the same time, as deduced from Figures 4a–4d and Figure 5, women in local government are more successful in the north-central area than in southern regions. The logistic regressions related to electoral success (Figure 9) confirm that women perform much worse in the southern regions than in the rest of the country.
Given that lifecycle has a different impact on women and men, a third research question concerned the potential different impact on political opportunities for young women. To that end, we expected more women to be candidates and elected mayors before the stage of life when they are usually more encumbered with caregiving duties for children and older parents. Consequently, we were expecting to see fewer middle-aged women, but more in the more advanced stage of life. In this case, too, the analysis only partly confirms our expectations.Footnote 16 It is true that, as Figure 2 shows, the percentages of women candidates and elected women are higher in the youngest groups of the population, and it is also true that both percentages clearly fall after the age of 30. However, contrary to expectations, women do not return to the political scene when their stage of life changes; their presence in the ranks of women candidates continues to decrease. We can therefore conclude this point by arguing that the lifecycle's negative impact on women's political involvement is significant and not at all temporary. It is as if, once they are out of the game, it is very difficult to return, especially at the top of the system.
Starting from social and political positions that on average are more disadvantaged, women who aspire to enter the political sphere must compensate for this deficit with other personal or family resources. A good level of education is one of the most important resources that more socially and economically marginalised candidates can deploy in this instance. Therefore, we expected women candidates and elected women to have higher education levels than men on average. Although the results for the candidates should be interpreted with caution, because information on educational qualifications is missing for more than one-fifth of the cases considered, Figure 3 clearly shows that female mayoral candidates and elected mayors are better educated than male candidates and elected mayors.
Our final research question concerned more specifically political factors. In this respect, our expectation was that we would find more women candidates and elected women in left-wing parties and coalitions, which are typically more aware of matters involving gender and equal opportunities. Indeed, Figure 7 shows that there are more women candidates on the left compared to the other political positions, except for the 5SM. The same cannot be said, however, for elected women on the left: there are fewer compared to those with centre-left and right political positions. On the whole, also considering the average percentage of votes collected by women and men in different political camps (see Figure 8) and the logistic regressions (Figure 9), it does not look as if the left manages to truly promote women.
Conclusions
With this article, we have tried to fill a gap in sociopolitical studies on the space occupied by women in local government in Italy after the introduction of the direct election of mayors, established in 1993. By examining a wide and original dataset, which contains information on all the women and men candidates for mayor for the period 1993–2021, we have developed an analysis that enriches our understanding of women's presence in the role of mayor in Italian municipalities, an understanding that until now has been based on official data that were more limited or gathered through surveys. This research strategy has allowed us to paint a more exhaustive and clearer portrait of the role of women in local government. This portrait confirms several issues already highlighted by the literature, but it also presents new, less obvious evidence that is worth mentioning briefly before our conclusion.
As a consequence of the social and political emancipation of women, also observable in other Western democracies, we generally found that women have gained a significant amount of political space over the period considered. Equality is still far off, given that in Italy women still make up only approximately 20 per cent of all candidates for mayor and approximately 15 per cent of those elected, but the situation has clearly improved compared to the early 1990s. These data show how the path to equality is not only blocked by the reluctance of women to run and by the close-mindedness of parties, but also by the electorate's reluctance to reward women who choose to engage politically and run for mayor. Over the three decades considered, the percentage of elected women has never exceeded that of women candidates. On the contrary, this difference has grown even more in recent years. We can thus conclude that election is a filter that further reduces the already limited number of women in politics.
Going beyond merely quantitative matters and looking more carefully at the role of women in local politics in Italy, we find confirmation of several regularities already highlighted by the literature. For example, it emerges that women candidates and elected women are on average more educated than their male colleagues. This higher endowment with cultural capital allows women to compensate, at least in part, for their deficit of political capital compared to men. It also seems that lifecycle has a significant, and lasting, impact on the chances that women engage in politics. Moreover, there is a confirmation of the hypothesis according to which the political condition of women is largely a reflection of the social, cultural and economic conditions in which they live. Consequently, it is in the areas where the condition of women is more disadvantaged that fewer women are found in local government.
The analysis carried out in this article has also allowed us to point out several less expected points. It is not, in fact, the left-wing parties, historically more sensitive to the condition of women in society, who put forward and elect more women. Rather, looking at the percentages of female candidates and elected women and the percentages of votes cast for female candidates (Figures 7 and 8), it is the protest parties, such as the 5SM and even the Lega, which has always been characterised by chauvinistic behaviour, that rely more on women to play the local government game. In what is still a very male-oriented political system, women are considered outsiders, and it is perhaps to highlight this ‘outsiderness’ and distance from mainstream politics that parties such as the Lega and the 5SM tend to give more space to women.Footnote 17 A setting such as Italy, which is characterised by a pronounced hostility when it comes to politics and politicians, thus seems to offer more opportunities to all kinds of outsiders, including women. Focusing on women – as the selection of Giorgia Meloni for prime minister and the election of Elly Schlein at the head of the main opposition party show – is a way of ‘punishing’ a male, mainstream politics that is considered hateful and ineffective. It is not a big step forward on the long march towards equality of gender in politics, but there are always bumpy stretches on even the most rewarding roads.
Acknowledgements
We would like to thank the review's three anonymous referees for their helpful comments, Vittorio Alvino and Ettore Di Cesare (Fondazione Openpolis) for their help with the construction of the dataset, and Carlo Cosentino, Lapo Filistrucchi, Aldo Paparo, Dario Tuorto, Francesco Vespignani and Daniele Vignoli for their suggestions regarding the analysis conducted.
Financial support
We are grateful for the financial support from the Department of Social, Political and Cognitive Sciences (DISPOC) at the University of Siena.
Appendix
Logistic regression of election outcome with respect to territorial and political covariates (N = 123,736): women

Logistic regression of election outcome with respect to territorial and political covariates (N = 123,736): men
Anna Carola Freschi is Associate Professor of Economic Sociology in the Department of Social, Political and Cognitive Sciences (DISPOC), University of Siena, where she teaches ‘Public Policies and Communication’, ‘Economic Sociology’ and ‘Sociology of Consumption’. Her recent publications include: ‘La rappresentanza parlamentare delle donne in Italia. Un puzzle finalmente ricomposto’, in Meridiana: Rivista di storia e scienze sociali 108 (2023); and, with V. Mete, ‘The Electoral Personalization of Italian Mayors. A Study of 25 Years of Direct Election’, in Italian Political Science Review 50 (2) (2020).
Vittorio Mete is Professor in Political Sociology in the Department of Political and Social Sciences at the University of Florence, where he teaches ‘Sociology of Leadership’, ‘Political Sociology’ and ‘Organised Crime’. His recent publications include: Antipolitics in Contemporary Italy (Routledge, 2022); Antipolitica. Protagonisti e forme di un'ostilità diffusa (Il Mulino, 2022); and, with C. Barbieri, ‘Kidnappings by the ’Ndrangheta: Characteristics, Institutional Countermeasures and Turning Points’, in Modern Italy 26 (4) (2021).


 Open access