


Introduction
A country’s welfare system can have a profound impact upon the housing security of its citizens, as adequate welfare support towards housing costs generally prevents an automatic link between job loss, or persistent low-income, and eviction (Stephens et al., Reference Stephens and Fitzpatrick2010). In the UK, housing allowances are targeted at low-income households, and this can play a significant role in preventing eviction for financial reasons (Pleace and Hunter, Reference Pleace, Hunter, Kenna, Nasarre-Aznar, Sparkes and Schmid2018, p. 336). However, this is threatened by the flagship Universal Credit (UC) welfare reform, which has been rolling out gradually since 2013 to replace six working-age means-tested benefits. With respect to housing costs, UC initially aimed to “simplify provision for rent support […], whilst protecting potentially vulnerable people from unintended consequences, such as getting into arrears or being made homeless” (Department for Work and Pensions [DWP], 2010, p. 19). Yet, on the contrary, several UC design features have potentially negative implications for housing security.
Firstly, UC involves long wait periods (currently a minimum of five weeks) between initially making a claim and receiving the first payment. This can leave claimants with no income for rent during this period (Shelter, 2017). Secondly, UC involves “ubiquitous conditionality”, intensifying the use of sanctions and extending conditionality to those in work (Dwyer and Wright, Reference Dwyer and Wright2014). This may lead to claimants struggling to afford rent whilst their income is reduced by sanctions (Beatty et al., Reference Beatty and Foden2015, p. 35). Thirdly, UC involves monthly direct payments, i.e. claimants are by default paid once per month, directly into their own bank account. This is a novel design – previously benefits tended to be paid fortnightly with Housing Benefit paid to a claimant’s landlord (UK Government, 2018) – and has implications for housing security as those who lack budgeting skills, or who ‘borrow’ from UC’s housing element for other essential costs, will struggle to meet rent payments (Britain Thinks, 2018, p. 12, Homeless Link, 2018, p. 30).
These design issues have led to criticism of UC, with widespread concerns that its rollout may increase rent arrears, evictions and homelessness (Citizens Advice, 2017, Homeless Link, 2018). This has culminated in the United Nations Rapporteur on extreme poverty and human rights stating that “many aspects of the design and rollout of the [UC] programme have suggested that the DWP is more concerned with making economic savings and sending messages about lifestyles than responding to the multiple needs of those living with […] housing insecurity” (Alston, Reference Alston2018, p. 5). However, the DWP “completely disagree” with the Rapporteur’s analysis (BBC, 2018), and state that “the best way to help people pay their rent is to help them into work” (The Independent, 2018), pointing to their research (DWP, 2017) that suggests UC improves employment outcomes.
As noted by the National Audit Office (NAO) (2018, p. 44), there is currently a lack of national, representative analysis on UC’s housing security impact. This article addresses the research question: has UC rollout led to an increase in landlord repossession rates (i.e. rates of legal actions by landlords to evict tenants) within 323 English local authorities? Quarterly data on landlord repossessions, used as an indicator of housing insecurity, is taken from Ministry of Justice statistics. This is linked with quarterly data on UC rollout from its official rollout schedule. The analysis tracks each local authority over time between 2012 Q1 and 2019 Q1, exploiting cross-area variation in the timing of UC rollout to assess its impact on repossession rates, controlling for unemployment rates, wages and rents.
Background
Determinants of eviction and the wider context of housing (in)security
Housing is one of the key social and economic conditions that shapes people’s health and wellbeing (Bentley et al., Reference Bentley and Pevalin2016, p. 209). As well as providing a physical place to dwell, housing can give a sense of identity, belonging, security and constancy (Preece and Bimpson, Reference Preece and Bimpson2019, p. 16). However, when a household faces personal and economic difficulties, their housing may become threatened (Rollins et al., Reference Rollins and Glass2012, p. 625). This situation is often termed ‘housing insecurity’, which is made up of three interdependent dimensions: (a) financial insecurity, relating to housing affordability, (b) spatial insecurity, relating to the ability of households to remain in a given dwelling or neighbourhood, and (c) relational insecurity, relating to how an individual’s housing and sense of home is bound to their relationship with other household members (Preece and Bimpson, Reference Preece and Bimpson2019). While there is no standard instrument to measure housing insecurity, legal threat of eviction is a good indicator, as it highlights an immediate threat to a household’s residence (Kushel et al., Reference Kushel and Gupta2006).
In the UK, eviction is often triggered by a loss of income, whereby households experience a financial crisis (e.g. a job loss) that leads to unpaid rent and ultimately eviction (Chamberlain and Johnson, Reference Chamberlain and Johnson2013). However, eviction, and tenancy breakdown more broadly, are also determined by various individual and structural factors, as well as landlord behaviour and long-term trends in housing policy. Individual factors can make certain groups more vulnerable to ‘tenancy non-sustainment’ (i.e. premature tenancy termination for reasons such as eviction or abandonment). For example, groups with high support needs, e.g. former homeless people (Randall and Brown, Reference Randall and Brown2002) and ex-service personnel (Johnsen et al., Reference Johnsen and Jones2008), have previously been identified as particularly vulnerable to tenancy non-sustainment. More generally, research suggests that young single people (particularly men) and childless couples are disproportionately at risk of non-sustainment, e.g. due to a lack of independent living skills and lack of ties to the local area that may arise from having children in a local school (Pawson et al., Reference Pawson and Donohoe2006, Pawson and Munro, Reference Pawson and Munro2010).
In terms of structural factors, eviction is linked to both poverty and the housing market. Pleace and Hunter (Reference Pleace, Hunter, Kenna, Nasarre-Aznar, Sparkes and Schmid2018, p. 335) suggest that UK evictions are related to a chronic shortage of affordable housing, with a growing gap between incomes and housing costs in many areas. Furthermore, high rates of tenancy non-sustainment are linked to a systemic issue of poor housing conditions in some areas, as tenants may be less committed to sustaining a tenancy if the living conditions are inadequate (Pawson and Munro, Reference Pawson and Munro2010). In England, evictions in the 21st century have also been driven by falling home ownership and the growth of the private rented sector (Bailey, Reference Bailey2018), alongside increased use of section 21 evictions (Clarke et al., Reference Clarke and Hamilton2017), which are widely viewed as “unfair” to tenants and are now due to be abolished (UK Government, 2019).
Welfare as a provider of housing security and barrier to eviction
Whilst eviction is often triggered by an income loss (or persistent low-income), strong welfare protection can protect against this. Adequate housing allowances within a welfare system have been shown to have a clear demonstrable impact on reducing the link between job loss and loss of housing in European countries (Stephens et al., Reference Stephens and Fitzpatrick2010).
In the UK specifically, welfare support to help low-income households meet rent payments have been in place since the 1970 s. This began with the 1972 Housing Finance Act, which introduced ‘consumer subsidies’ via national rent rebates for council tenants and rent allowances for other tenants, replacing the previous system of ‘producer subsidies’ via rent controls (Lund, Reference Lund2011 pp. 131–132). These have subsequently been replaced by Housing Benefit (HB) from 1983 and, for private tenants, Local Housing Allowance (LHA) from 2008. The basic principle of HB and LHA is that housing costs should not reduce income below set ‘Income Support levels’ (Lund, Reference Lund2017, p. 137). ‘Requirements’ are set based on these levels, with HB paying 100 percent of rent if ‘requirements’ match income, tapering off at 65p (pre 2016) or 63p (post 2016) for each additional £1 of income above ‘requirements’ until the full ‘eligible rent’ is reached (ibid., p. 138). This system, alongside other welfare measures and the supply of social housing, is said to have had a major impact on protecting against evictions in the UK (Pleace and Hunter, Reference Pleace, Hunter, Kenna, Nasarre-Aznar, Sparkes and Schmid2018).
Whilst welfare still provides a barrier to eviction in the UK today, this has been weakened somewhat in recent years. Even prior to UC rollout, housing security was reduced by various post 2010 welfare reforms, largely motivated by a desire to reduce public spending and tackle a perceived ‘culture of benefit dependency’ (Hamnett, Reference Hamnett2014). From 2011, LHA was cut from the 50th to 30th percentile of local rents, and capped nationally to limit the amount households could receive. This, alongside subsequent freezes to LHA rates, has made privately renting less affordable for many low-income households (Reeves et al., Reference Reeves and Clair2016, Fitzpatrick et al., Reference Fitzpatrick and Pawson2018, p. 34). Moreover, the 2016 reform to lower the benefit cap for out-of-work claimants has tripled the number of households affected by the cap, potentially ‘triggering’ evictions (Fitzpatrick et al., Reference Fitzpatrick and Pawson2018, pp. 36–38). Meanwhile, welfare provision for housing costs support has been further limited by the “bedroom tax”, which cuts HB for households deemed to have surplus bedrooms, and the 1 percent limit to the annual uprating of benefit value (Beatty and Fothergill, Reference Beatty and Fothergill2016, Reference Beatty and Fothergill2018).
The rollout of Universal Credit
UC’s introduction was first announced via the DWP (2010) white paper ‘Universal Credit: welfare that works’, which set out how UC would “radically simplify the [welfare] system to make work pay and combat worklessness and poverty” (p. 2). UC payments are made up of: (a) a standard monthly amount, determined by household circumstances, (b) additional monthly amounts, e.g. for entitlement for housing costs, disability, children etc., and (c) deductions based on income/capital or application of sanctions or the benefit cap (DWP, 2018a). In the short-medium term, the amount for housing costs in rented accomodation is still based on the existing HB and LHA systems (Webb, Reference Webb2012, p. 9), meaning that cuts to HB and LHA since 2011 are carried over to UC (Wilson, Reference Wilson2019a, p. 7).
UC has been rolling out since 2013, using a “twin track” approach (Kennedy and Keen, Reference Kennedy and Keen2018, p. 8). This has consisted of the gradual rollout of: (a) UC ‘Live Service’, which was only available to new claims that were most simple to manage (mainly single, childless, unemployed adults without housing costs), and (b) UC ‘Full Service’, which uses an updated IT system and is available to all new claimants (NAO, 2018, pp. 14–15). Figure 1 details the key dates, and pace, of UC rollout so far in England. It shows that the number of claimants increased slowly over time throughout ‘Live Service’ rollout, but began to quicken during ‘Full Service’ rollout. By 2018 Q4, there were 1.2 million people on UC and 635,000 households on UC with housing costs support in England. UC ‘Full Service’ has now reached all Jobcentres, meaning that all new claimants go onto UC rather than the old ‘legacy’ system. However, we are still relatively early in the overall rollout process. The ‘managed migration’ phase of transferring existing ‘legacy’ benefit claimants onto UC is not due be complete until 2023.
Quarterly pace, and key dates, of UC rollout in England (2013–2018). Notes: ‘People on UC (total)’ and ‘Households on UC with Housing Costs Support’ are a snapshot of these statistics on the second Thursday of the quarter’s middle month. ‘People on UC (new starts in the given quarter)’ is the cumulative number of individuals who have completed the UC claims process and accepted their claimant commitment in the given quarter. Data Source: Stat-Xplore.

The link between Universal Credit rollout and housing security
UC’s housing security impacts have been widely debated throughout its rollout, with much criticism of the policy’s design. Perhaps the most widely criticised design issue has been UC’s long wait period between initially making a claim and receiving the first payment. The wait period is currently designed to be five weeks but in some cases can take longer, and qualitative research suggests claimants can be left with no income, resulting in rent arrears (Britain Thinks, 2018, Cheetham et al., Reference Cheetham and Moffatt2018). In response to this, the DWP now give those with existing HB claims a two-week HB extension during the UC wait period, and provide advance payments to those requiring immediate financial support. DWP ministers insist these safeguards are successful in reducing rent arrears (HC Debate 29 October 2018 cW). However, advance payments are effectively loans that are paid back via deductions on future UC payments, which according to Crisis (2018, p. 256) are set at “unsustainable levels” for low-income households.
Another important UC design issue is its conditionality. Welfare conditionality has been extended and intensified under UC (Dwyer and Wright, Reference Dwyer and Wright2014), and analysis of sanction statistics suggest UC has much higher sanction rates than ‘legacy’ benefits (Webster, Reference Webster2019). However, it is difficult to make accurate comparisons given that Jobseekers Allowance sanction statistics do not pick up payments being stopped for missed interviews (Keen, Reference Keen2018). Nonetheless, if sanction rates are higher under UC, this is likely to reduce housing security as claimants may have difficulty affording rent whilst sanctionedFootnote 1 (Beatty et al., Reference Beatty and Foden2015, p. 35), and qualitative research suggests UC’s conditionality regime has indeed led to rent arrears and repossession actions for some claimants (Batty, Reference Batty2018, Wright et al., Reference Wright and Dwyer2018).
UC’s design of monthly direct payments also has implications for housing security. This is designed to encourage greater budgeting responsibility, preparing claimants for managing monthly wages in work (DWP, 2012, p. 38). Yet, it has been criticised for failing to fit with the pattern of how many low-income families manage their money (Bennett, Reference Bennett2012), and qualitative research/local authority surveys suggest that those lacking budgeting skills or who prioritise other essential costs over rent will end up in arrears (Britain Thinks, 2018, p. 12, Homeless Link, 2018, p. 30). This can have knock-on impacts on the finances of housing associations (Hickman et al., Reference Hickman and Pattison2018), and on the willingness of private landlords to let to UC claimants (Simcock, Reference Simcock2018). In response to these issues, ‘Alternative Payment Arrangements’ (APAs) and ‘Scottish Choices’ (Scotland only) are now available to provide: (a) more frequent payments, and (b) managed payment of housing costs to landlords. However, there is currently a lack of awareness of APAs amongst claimants (Hobson et al., Reference Hobson and Spoor2019), and they are not widely used (see DWP, 2018b, p. 8).
Overall, the combination of long wait periods, increased conditionality and monthly direct payments have provided considerable concern over UC’s housing security impact. Yet, there is currently a lack of robust, national-level quantitative analysis studying this, with no known studies assessing the link between UC rollout and landlord repossession actions. Quantitative studies that have been conducted have focussed on UC’s impact on rent arrears. Citizen’s Advice research suggests UC claimants are more likely to be in rent arrears than ‘legacy’ benefit claimants (Drake, Reference Drake2017). Moreover, the DWP’s own research on a single housing association found an increase in average rent arrears as tenants went onto UC, consisting of a sharp rise during initial wait periods followed by a plateau around 10–12 weeks after a claim (NAO, 2018, pp. 44–45). Similarly, a rent account analysis in two London boroughs found increased arrears amongst UC claimants compared to ‘legacy’ claimants, particularly during the long wait periods (Smith Institute, 2017). Finally, analysis of a pilot programme studying the impact of UC’s direct payment system amongst social housing tenants suggests that it triggered tenants into debt, with only a small number managing to avoid rent arrears (Hickman et al., Reference Hickman and Kemp2017). Whilst these existing studies have been limited to specific localities or cross-sectional data, this article explores UC’s impact at a more national level (covering 323 English local authorities), and employs a fixed-effects panel design.
Data, Variables and Methods
Setting
A quarterly, local authority level dataset was compiled, covering the period 2012 Q1 – 2019 Q1. The final sample included 323 of England’s 326 lower tier local authorities. City of London, Isles of Scilly and West Somerset were excluded due to small population sizes.
Outcome variables
In England, the legal landlord repossession process is carried out through the county courts, and most commonly arises due to rent arrears (Ministry of Justice, 2015, p. 3). It occurs in four stages. First, the landlord makes a repossession claim to the court to establish their right to repossess the property. Next, if the court agrees the landlord has the right, a repossession order will be granted. The landlord can then apply for a repossession warrant which, if issued, can lead to formal bailiff repossession (i.e. actual eviction). However, it is important to note that courts are not involved in all evictions, as tenants often leave before legal proceedings are required (Wilson, Reference Wilson2019b, p. 7). Moreover, even when legal proceedings begin, the latter stages are often not reached, e.g. if the tenant leaves voluntarily, pays off their arrears, or if the judge decides not to make a repossession order (Ministry of Justice, 2019a, p. 3). According to Clarke et al. (Reference Clarke and Hamilton2017, p. 12), around 72 percent of landlord repossession claims lead to repossession orders, 40 percent to repossession warrants and 21 percent to bailiff repossessions.
Four outcome variables are used in this analysis, reflecting the four stages of the repossession process. These are: (1) ‘landlord repossession claim rate’, (2) ‘landlord repossession order rate’, (3) ‘landlord repossession warrant rate’, and (4) ‘landlord bailiff repossession rate’. These indicate, for each local authority, the quarterly number of landlord repossession claims, orders, warrants and bailiff repossessions. This includes actions by both social and private landlords, and comes from the Ministry of Justice’s ‘Mortgage and Landlord Possession Statistics’. All data was coded into rates per 10,000 rented dwellings in the local authority using the Office for National Statistics’ annual ‘Subnational Dwelling Stock by Tenure Estimates’, and Ministry of Housing, Communities and Local Government’s ‘live tables on dwelling stock’.
Explanatory variables
Quarterly data on the timing of UC rollout within local authorities was gathered from its official rollout schedule. This was used to create three explanatory variables tracking UC rollout over time. ‘UC Live Service’ is a binary variable giving a quarterly indication of whether ‘Live Service’ has rolled out yet in each local authorityFootnote 2 . ‘UC Full Service’ is a binary variable indicating whether ‘Full Service’ has rolled out yet in each local authorityFootnote 3 . Finally, ‘UC Full Service (by length of rollout)’ is a categorical variable indicating whether ‘Full Service’ has rolled out yet, and if so, for how longFootnote 4 .
Control variables
Repossession rates are likely impacted by local labour and housing market factors. To account for this, three control variables were used in the analysis. First, the ‘model based unemployment rate’ comes from NOMIS labour market statistics and provides a quarterly estimate of local authority unemployment rates, based on the previous twelve months of ‘Annual Population Survey’ data. Second, ‘median weekly wages’ comes from the Office for National Statistics’ ‘Annual Survey of Hours and Earnings’. This provides an annual estimate of median part and full-time weekly wages, and is linear interpolated to provide quarterly estimates for each local authority. Third, the analysis controls for ‘mean weekly rents’. This is the mean of private rentsFootnote 5 , housing association rents and, where applicable, local authority rentsFootnote 6 .
Analysis
Fixed-effects regression models were used to formally measure the relationship between UC rollout and landlord repossession rates. UC rollout varied across time and space: both ‘Live Service’ and ‘Full Service’ UC were introduced in different areas at different times between 2013 and 2018. This makes it a form of ‘natural experiment’, i.e. a policy intervention that is not under the control of the researcher, but that is amenable to research which uses the variation in exposure to the policy to evaluate its impact (Craig et al., Reference Craig and Cooper2010, p. 4). The ideal scenario to make causal claims on UC’s impact would be if its variation across time and space was completely random. This was not exactly the case. The DWP have not formally stated the basis for which the order of rollout was determined, but their research has noted that rollout was not random, but rather was “designed, in part, to be deliverable” (DWP, 2014). This can threaten the validity of making causal claims on UC’s impact if there are confounding variables linked to both the timing of UC rollout and landlord repossession rates in local authorities. One way to explore potential cause for concern here is by looking at differences in labour and housing market characteristics between areas that became ‘Full Service’ earlier and areas that became ‘Full Service’ later. Doing this shows that there are minor differences – areas where ‘Full Service’ rolled out earlier tended to, on average, have slightly higher unemployment rates and slightly lower wages and housing affordability (see online supplementary material: Appendix 1).
However, the fixed-effects panel design, and inclusion of the control variables outlined above, was used to account for this. Fixed-effects regression measures change over time within local authorities (Gayle and Lambert, Reference Gayle and Lambert2018). The key advantage here is that local authority fixed-effects effectively control for any baseline differences between local authorities, whilst time fixed-effects control for unobserved variables that vary over time but not between local authorities (Stock and Watson, Reference Stock and Watson2015). Time fixed-effects were important to include here to control for the secular downward trend in landlord repossession rates ongoing since 2014 (see Figure 2). In addition, potential confounders that were observed (i.e. the control variables outlined above) were also added as further controls.
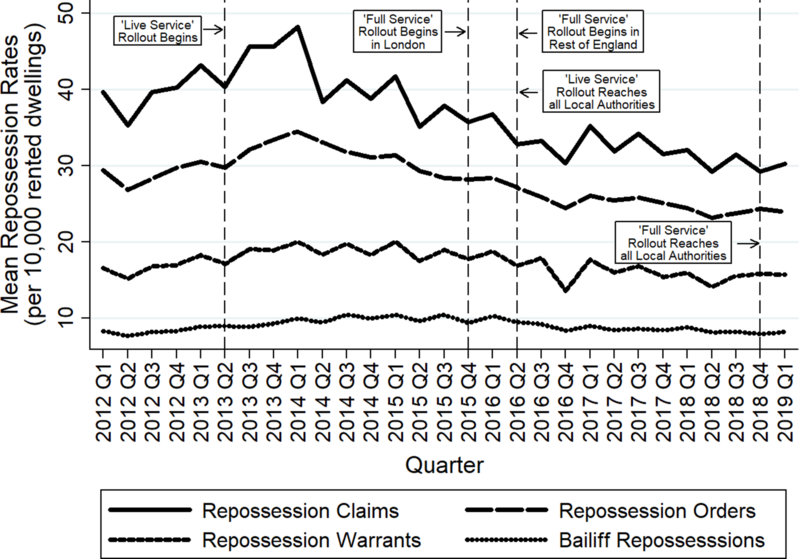
Quarterly trends in mean landlord repossession rates across local authorities over time, 2012 Q1 – 2019 Q1. Notes: Data includes both private and social landlord repossession actions.
The main analysis was conducted in two parts. Firstly, the binary ‘UC Live Service’ and ‘UC Full Service’ variables were used to measure the overall impact of UC rollout, on average, within local authorities up to 2019 Q1, as follows:
 $$LR\;Rat{e_{it}} = {\beta _0} + {\beta _1}UCL{S_{it}} + {\beta _2}UCF{S_{it}} + {\beta _3}Unemploymen{t_{it}} + {\beta _4}Wage{s_{it}} + {\beta _5}Rent{s_{it}} + {\beta _6}Quarte{r_t} + {\alpha _i} + {u_{it}}\;$$
Here, $i$
is the local authority and
$i$
is the local authority and $t$
is the quarterly time point.
$t$
is the quarterly time point. $LR\;Rate$
denotes the landlord repossession rate, with separate models being run for claim rates, order rates, warrant rates and bailiff repossession rates.
$LR\;Rate$
denotes the landlord repossession rate, with separate models being run for claim rates, order rates, warrant rates and bailiff repossession rates. $UCLS$
is the ‘UC Live Service’ variable,
$UCLS$
is the ‘UC Live Service’ variable, $UCFS$
is the ‘UC Full Service’ variable,
$UCFS$
is the ‘UC Full Service’ variable, $Unemployment$
is the ‘model based unemployment rate’ variable,
$Unemployment$
is the ‘model based unemployment rate’ variable, $Wages$
is the ‘median weekly wages’ variable, and
$Wages$
is the ‘median weekly wages’ variable, and $Rents$
is the ‘mean weekly rents’ variable. Finally,
$Rents$
is the ‘mean weekly rents’ variable. Finally, $Quarter$
is the time fixed-effects,
$Quarter$
is the time fixed-effects, ${\alpha _i}$
is the local authority fixed-effects and
${\alpha _i}$
is the local authority fixed-effects and ${u_{it}}$
is the error term.
${u_{it}}$
is the error term.
In the second part of the analysis, the ‘UC Full Service (by length of rollout)’ variable was used to measure whether the impact of ‘Full Service’ rollout was greater when it had rolled out for longer and thus reached more claimants, as follows:
 $$LR\;Rat{e_{it}} = \;{\beta _0} + {\beta _1}UCFS\;Lengt{h_{it}} + {\beta _2}Unemploymen{t_{it}} + {\beta _3}Wage{s_{it}} + {\beta _4}Rent{s_{it}} + {\beta _5}Quarte{r_t} + {\alpha _i} + {u_{it}}\;$$
Where $UCFS\;Length$
is the ‘UC Full Service (by length of rollout)’ variable and all other variables are the same as those in Equation 1.
$UCFS\;Length$
is the ‘UC Full Service (by length of rollout)’ variable and all other variables are the same as those in Equation 1.
Results
Overall, there was, on average, a downward trend in landlord repossession rates between 2014 Q1 and 2019 Q1, as shown by Figure 2. This has largely been driven by declining use of section 21 eviction actions since 2014 (Wilson, Reference Wilson2019b, p. 8). Prior to UC ‘Live Service’ rollout beginning in 2013 Q2, the mean rates were 40.4 claims, 29.7 orders, 17.2 warrants and 9 bailiff repossessions (all per 10,000 rented dwellings). By the beginning of UC ‘Full Service’ rollout in 2015 Q4, this had decreased to 35.7 claims and 28.2 orders, whilst the rates of warrants and bailiff repossession rates had remained steady at 17.7 and 9.3 respectively (all per 10,000 rented dwellings).
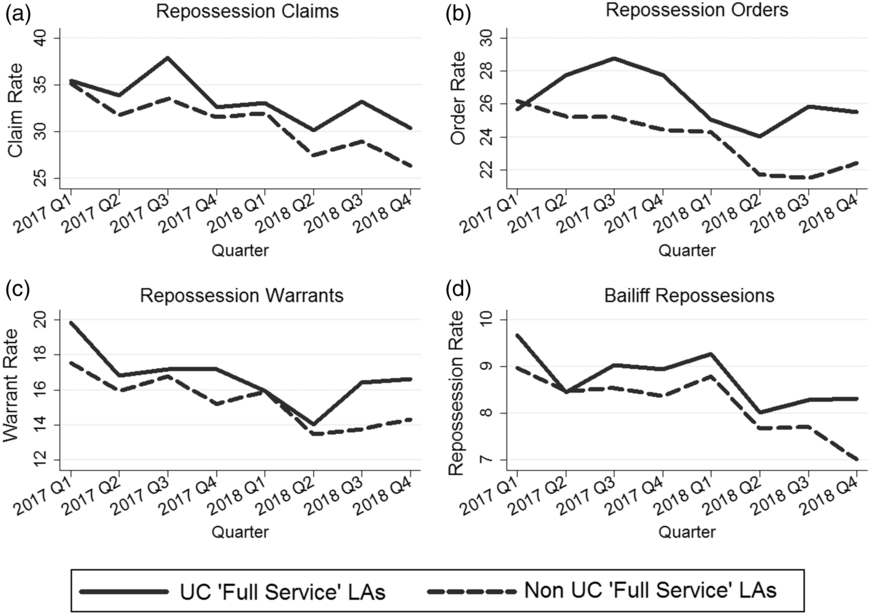
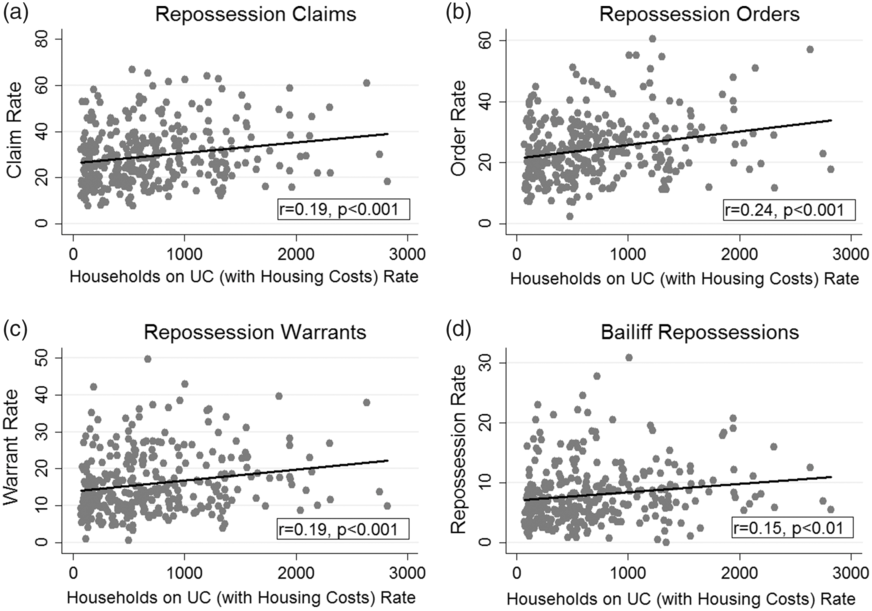
In terms of trends during ‘Full Service’ rollout, Figure 3 shows mean rates in 2017–2018, with local authorities separated into UC ‘Full Service’ (UCFS) and non-UC ‘Full Service’ (non-UCFS) areas, i.e. local authorities where ‘Full Service’ had rolled out and local authorities where it hadn’t fully rolled out by that quarter. It shows a clear pattern that UCFS areas tended to, on average, have slightly higher repossession rates than non-UCFS areas. Similarly, Figure 4 shows that, in 2018 Q4, local authorities with a higher rate of households on UC with housing costs support tended to also have higher landlord repossession rates. Some of this trend may be due to UC’s impact. However, it may also be linked to the way ‘Full Service’ was rolled out, and arise due to differences between areas that became UCFS earlier compared to those that became UCFS later (see online supplementary material: Appendix 1).
Quarterly trends in mean landlord repossession rates in UC ‘Full Service’ versus non UC ‘Full Service’ local authorities, 2017–2018. Notes: The number of local authorities that were UCFS areas gradually increased over time as rollout progressed - 10 percent of local authorities were UCFS areas by 2017 Q1, increasing to 17 percent by 2017 Q3, 37 percent by 2018 Q1, 65 percent by 2018 Q3 and 85 percent by 2018 Q4. Data includes both private and social landlords. Y axes rates are the mean repossession rates across local authorities per 10,000 rented dwellings.
2018 Q4 snapshot of the relationship between the rate of households on UC with support for housing costs, and landlord repossession rates. Notes: All rates are per 10,000 rented dwellings in the local authority. Source of UC data: Stat-Xplore.
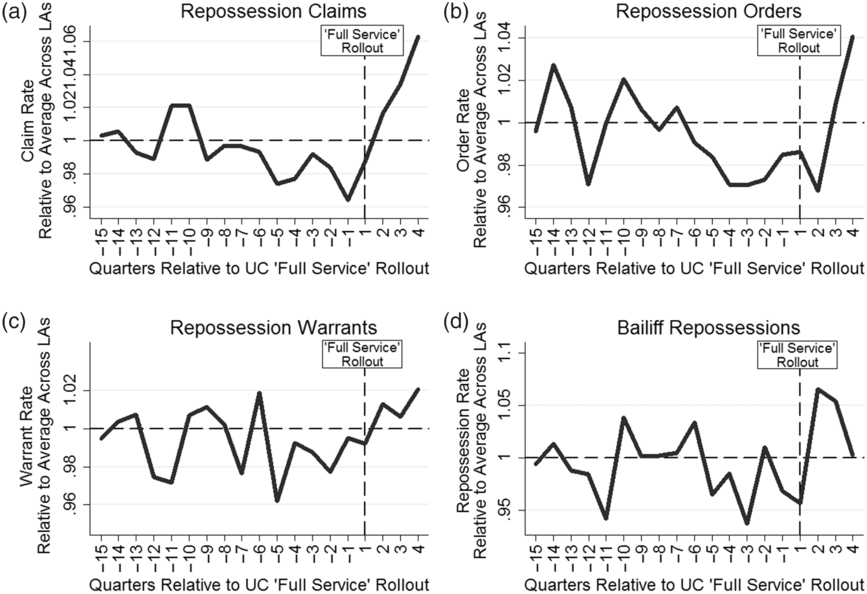
Given these differences in the characteristics of local authorities that became UCFS areas earlier compared to local authorities that became UCFS areas later, it is more telling to analyse repossession trends within (rather than between) local authorities. Figure 5 shows trends in mean landlord repossession rates in the quarters before and after ‘Full Service’ rollout within local authorities, i.e. time is adjusted to be relative to rollout within each local authority. To remove the effect of the secular downward trend in repossessions since 2014, rates are also shown as a ratio to the average across local authorities for the given quarter. There is a clear spike following UC ‘Full Service’ rollout, which is particularly visible for the first stages of the legal repossession process. This is, most likely, because more of UC’s impact is picked up in their data as they occur faster than the latter stages (Ministry of Justice, 2019b, p. 8), which are often not even reached at all due to cases being resolved privately.
Quarterly trends in mean landlord repossession rates (relative to the average across local authorities) in English local authorities, before and after UC ‘Full Service’ rollout. Notes: only includes data on the 136 local authorities with repossessions data available to the fourth quarter or more post ‘Full Service’ rollout. ‘Full Service’ rollout is the first quarter in which UC ‘Full Service’ was available in most Jobcentres in the local authority for most of the quarter. Y axes give the mean of the ratio between landlord repossession rates and the average across the 136 local authorities in the given quarter.
The relationship between UC rollout and landlord repossession rates within local authorities is measured more formally via the regression models in Table 1. These models examine the overall impact of UC rollout on repossession rates, on average, up to 2019 Q1, accounting for local authority and time fixed-effects, unemployment rates, wages and rents. No significant relationship was found between UC ‘Live Service’ rollout and repossession rates, which is most likely because it only affected a relatively small number of claims that were the most simple to manage, so tended not to include those requiring support towards housing costs. However, UC ‘Full Service’ rollout was associated with an increase of 1.74 landlord repossession claims, 1.42 landlord repossession orders and 0.70 landlord repossession warrants (all per 10,000 rented dwellings). To put these figures into context, the mean landlord repossession rates in the 2015 Q1 – 2015 Q4 period immediately prior to the beginning of UC ‘Full Service’ rollout was 37.6 claims, 29.4 orders and 18.5 warrants (all per 10,000 rented dwellings – see Figure 2). Therefore, UC ‘Full Service’ rollout corresponds to approximately a 4.6 percent increase in claims, 4.8 percent increase in orders and a 3.8 percent increase in warrants up to 2019 Q1. However, Figure 2 suggests that this increase associated with UC rollout to date has been offset by other factors, as repossession rates have continued to fall overall.
Relationship between UC rollout and landlord repossession rates within 323 English local authorities, 2012 Q1 – 2019 Q1

Notes: Driscoll-Kraay standard errors shown in brackets under coefficients. All models include local authority and (quarterly) time fixed effects. N refers to the number of local authority quarters. Landlord repossession rates are per 10,000 rented dwellings in the local authority. +p < 0.10, *p < 0.05, **p < 0.01, ***p < 0.001.
One limitation of the modelling in Table 1 is that, as a binary measure, it treats all local authority quarters post ‘Full Service’ rollout as being the same. In reality, UC’s impact is likely to increase over time post rollout, as it takes time for new claims to be made and for effects to become apparent via repossession actions. This is examined by the regression models in Table 2, which split local authority quarters post ‘Full Service’ introduction based on rollout length. The results confirm that the impact tends to increase when ‘Full Service’ has been rolled out longer. Specifically, in the first quarter post UC ‘Full Service’ rollout, it is associated with an increase of 1.03 landlord repossession claims, rising to 1.66 in the second quarter post and 2.31 in the third quarter post (all per 10,000 rented dwellings). Similarly, ‘Full Service’ is associated with an increase of 0.72 landlord repossession orders in the first quarter post rollout (although this was not statistically significant), rising to 0.99 in the second quarter post and 1.54 in the third quarter post (again not statistically significant) (all per 10,000 rented dwellings). Overall, in the fourth+ quarters (i.e. 12+ months) post rollout, ‘Full Service’ was associated with an increase of 2.60 landlord repossession claims, 2.89 landlord repossession orders and 1.09 landlord repossession warrants (all per 10,000 rented dwellings). This corresponds to a 6.9 percent increase in claims, 9.8 percent increase in orders and a 5.9 percent increase in warrants when compared to pre rollout rates.
Relationship between UC ‘Full Service’ rollout and landlord repossession rates within 323 English local authorities, by length of rollout, 2012 Q1 – 2019 Q1
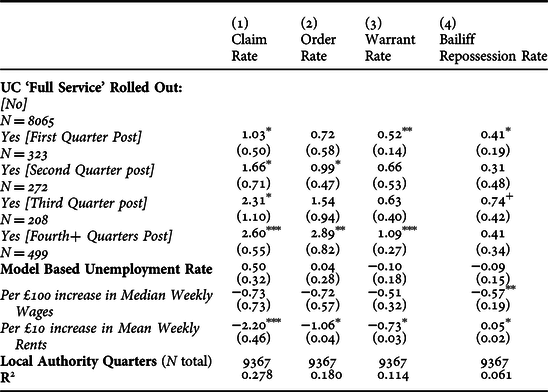
Notes: Driscoll-Kraay standard errors shown in brackets under coefficients. All models include local authority and (quarterly) time fixed effects. ‘First Quarter Post’ is defined as the first quarter in which UC ‘Full Service’ was available in most Jobcentres in the local authority for most of the quarter. N refers to the number of local authority quarters. Landlord repossession rates are per 10,000 rented dwellings. +p < 0.10, *p < 0.05, **p < 0.01, ***p < 0.001.
Falsification Test
To test whether the results were spurious, and somehow related to the structure of the UC rollout schedule (i.e. any non-randomness in rollout), a ‘falsification test’ was conducted. This involved repeating the analysis using mortgage repossession rates as ‘non-equivalent dependent variables’, i.e. dependent variables that are “predicted not to change because of the treatment but […] expected to respond to some or all of the contextually important internal validity threats in the same way as the target outcome” (Shadish et al., Reference Shadish and Cook2002, p. 509). Mortgage repossessions can be used here as their data is collected in exactly the same way as landlord repossessions, whilst any confounding factors that may impact landlord repossession (e.g. economic, housing and labour market factors), are also likely to impact mortgage repossessions. Yet, UC rollout should not affect mortgage repossessions as 99 percent of UC claimants with entitlement to housing costs support live in the rented sector (DWP, 2018b, p. 8). No significant association was found between UC rollout and mortgage repossessions (see online supplementary material: Appendix 2). This boosts the internal validity of the analysis, and suggests that the results are unlikely to be due to confounding related to the rollout structure.
Discussion
The findings outlined in this article suggest that UC ‘Full Service’ rollout has led to an increase in landlord repossession rates within English local authorities. Accounting for local authority and time fixed-effects, unemployment rates, wages and rents, ‘Full Service’ rollout was associated with, on average, an increase of 1.74 landlord repossession claims, 1.42 landlord repossession orders and 0.70 landlord repossession warrants within local authorities (per 10,000 rented dwellings) up to 2019 Q1. The magnitude of this impact is fairly small relative to the overall number of households on UC, as on average there were 903.6 households on UC (with housing costs support) within local authorities by 2019 Q1Footnote 7 . However, landlord repossession statistics by no means capture all households at risk of eviction. Many households may be in rent arrears or may have been evicted without legal repossession proceedings taking place (Wilson, Reference Wilson2019b, p. 7). Therefore, it is more telling to assess the magnitude of UC’s impact in the context of its increase relative to repossession rates in the period pre ‘Full Service’ rollout (i.e. 2015 Q1 – 2015 Q4). By this metric, ‘Full Service’ rollout corresponds to a 4.6 percent increase in claims, 4.8 percent increase in orders and 3.8 percent increase in warrants up to 2019 Q1 (as set out in the results section).
This article’s findings also suggest that the impact of UC ‘Full Service’ tends to increase when it has been rolled out for longer and thus reached more claimants. Specifically, where it had been rolled out for 12+ months, ‘Full Service’ was associated with an increase of 2.60 landlord repossession claims, 2.89 landlord repossession orders and 1.09 landlord repossession warrants within local authorities (per 10,000 rented dwellings). This corresponds to a 6.9 percent increase in claims, 9.8 percent increase in orders and 5.9 percent increase in warrants when compared to rates in the pre-rollout period. This suggests that in the absence of any changes in policy or landlord behaviour, UC’s impact may continue to increase, with the number of claimants (UK wide) expected to rise from 1.5 million in 2019 Q1 to 7 million by 2023 following ‘managed migration’ rollout (Barnard, Reference Barnard2019).
The key strength of this analysis is that it was able to exploit cross-area variation in the timing of UC rollout (arising from its gradual area-by-area introduction) in order to examine its impact – a form of ‘natural experiment’. The results are clear and statistically significant, although the data was less able to pick up impacts on the latter stages of the repossession process, as these take longer to occur and often are not reached at all due to cases being resolved privately. One threat to the validity of making causal claims based on this analysis is that UC rollout was not completely random, as areas where ‘Full Service’ rolled out earlier tended to, on average, have slightly higher unemployment rates and lower wages and housing affordability than areas where it rolled out later. However, the fixed-effects panel design and additional control variables were used to account for this, whilst the results of the falsification test suggest it is unlikely the results are spurious and linked to any non-randomness in the structure of UC rollout. This suggests it is unlikely that the relationship observed between UC rollout and landlord repossession rates is not causal.
Nonetheless, there are some important limitations to note. Firstly, as this analysis was conducted at the local authority rather than individual level, there is potential for ecological fallacy. Secondly, whilst the explanatory/outcome variables used in this analysis are quarterly estimates, the control variables are annual estimates that were converted into quarterly estimates using linear interpolation (or in case of unemployment rates, by taking the previous 12 months average). Therefore, compared to the UC explanatory variables, the control variables are less accurate in capturing quarter-to-quarter variation and seasonal fluctuations. Thirdly, as the repossessions data used included ‘accelerated’ repossession actions (made up of social and private landlord actions), it was not possible to disaggregate accurately between the social and private rented sectors. UC’s impact may differ between sectors as the monthly direct payment system is novel for social rents but not private rents (where direct payments have been in place since 2008), and social tenants are more likely to be vulnerable, and have difficulty managing rent payments (Hickman et al., Reference Hickman and Kemp2017). Therefore, the lack of disaggregation between sectors is an important limitation, and suggests one direction for future research.
Despite these limitations, this article addresses some critical gaps in the literature. Importantly, it is the only known quantitative study assessing the impact of UC rollout on landlord repossession actions. Quantitative research that does exist into UC’s housing security impact has tended to focus on rent arrears, and has been limited to specific localities (Smith Institute, 2017, NAO, 2018, pp. 44–45), or based on cross-sectional data comparing UC claimants to legacy claimants (Drake, Reference Drake2017). This article’s findings are consistent with the results of these existing studies, but addresses their limitations by using more national-level data (covering 323 English local authorities) and employing a more robust fixed-effects panel design.
From an international perspective, the merging together of multiple working-age means-tested benefits is a radical approach previously untried in any OECD country (OECD, 2010, pp. 17–18). Consequently, the UC reform is of interest to policymakers within other developed welfare systems. There has been particular interest in developing a UC-type reform in Finland, in attempt to incentivise work whilst also offering strong and affordable social protection (see Pareliussen et al., Reference Pareliussen and Hwang2018). This article’s findings support previous research highlighting the importance of welfare as a barrier to eviction (Stephens et al., Reference Stephens and Fitzpatrick2010), and suggest that potential housing security impacts should be considered by any government considering a UC-type reform.
This article also contributes to ongoing debates in the UK over UC’s housing impacts. Despite widespread criticism of the policy, government officials have tended to insist that safeguards – e.g. advance payments, APAs etc. – are in place to prevent housing insecurity under UC (e.g. see HC Debate 29 October 2018 cW), and that “the best way to help people pay their rent is to help them into work” (The Independent, 2018). It is difficult to disentangle the impact that safeguards added to UC over time have had, but in general this article has provided evidence of a clear link between UC rollout and increased landlord repossession actions. This has wide-ranging implications, not just for tenants but also for landlords and local service providers. Firstly, tenants facing repossession actions may be forced to cut back spending on essentials like food/heating in order to avoid actual eviction. Furthermore, there may be knock-on health/wellbeing impacts, as housing security is an important determinant of mental ill-health (Reeves et al., Reference Reeves and Clair2016). For landlords, increased repossession actions may reduce their income streams, and require Housing Associations to find additional resources for rent collection and personalised tenant support (Hickman et al., Reference Hickman and Pattison2018). Importantly, any UC claiming tenants who face actual eviction may have difficulties securing new accommodation given there is increasing evidence of: (a) social landlords using pre-tenancy assessments to exclude those with poor financial histories (Preece et al., Reference Preece and Hickman2019), and (b) an unwillingness of private landlords to let to UC claimants (Simcock, Reference Simcock2018). This situation is likely to increase pressure on local homeless services (Kleynhans and Weekes, Reference Kleynhans and Weekes2019).
This article’s analysis examined the overall impact of UC rollout, meaning it isn’t possible to ascertain which particular UC features have had the biggest negative impact. However, previous qualitative studies suggest three key design issues have likely contributed. Firstly, UC’s long wait periods have likely contributed by leaving claimants without income for rent payments (Britain Thinks, 2018, Cheetham et al., Reference Cheetham and Moffatt2018). Secondly, it is likely that the length and severity of UC sanctions have contributed, as sanctioned claimants may not retain enough income to meet rent payments (Wright et al., Reference Wright and Dwyer2018). Thirdly, UC’s monthly direct payment system is also likely to have negatively impacted those lacking budgeting skills and those forced to ‘borrow’ from UC’s housing element for other essential costs (Britain Thinks, 2018, p. 12, Homeless Link, 2018, p. 30). The DWP have already been criticised by the NAO (2018) and the UN Rapporteur on extreme poverty and human rights (Alston, Reference Alston2018) for their single-minded focus on improving employment outcomes at all costs, and dismissing any evidence or suggestion of claimant hardship. This article highlights that UC rollout has weakened the UK welfare system’s ability to provide a safety net against eviction, and that UC’s success as a policy should not be judged on employment statistics alone but also on its ability to provide housing security to claimants.
Acknowledgements
I would like to thank Nick Bailey, Ken Gibb and Sharon Wright for their feedback and suggestions based on earlier drafts of this article. I would also like to thank the anonymous reviewers, and those who provided feedback when earlier drafts of this paper were presented at the WPEG and ESPAnet Conferences in 2019. This work was supported by the Economic and Social Research Council (ESRC) (grant number: ES/P000681/1).
Supplementary material
To view supplementary material for this article, please visit https://doi.org/10.1017/S0047279420000021


 Open access