

Introduction
Clinical trials are continually regarded as the “gold standard” of evidence for the efficacy and safety of new treatments and interventions. In the past 10 years, trials have increasingly incorporated real-world data sources – data not generated originally for research purposes, but rather, generated in the “wild,” through activities such as filling a pharmaceutical prescription, documenting a clinical encounter, or tracking a patient’s physical activity through a wrist-worn accelerometer. Such real-world data often play a key role in modern trials [Reference Simon, Platt and Watanabe1]. We refer to such trials that incorporate real-world data as “real-world trials.” This is not in contrast to trials that are called pragmatic, digital, or decentralized. Indeed, we consider such trials under the umbrella of real-world trials when key data sources are generated in the wild.
While there are potential benefits to utilizing real-world data sources, simple inclusion of real-world data does not guarantee advantages over a trial that does not include real-world data sources. An intentional and strong study design that leverages real-world data sources can well position a trial to realize the potential benefits, which may be vast. For example, the use of real-world data (or devices collecting and generating the data) may increase ability to generalize findings if eligibility criteria or the type of treatment delivery are broadened beyond the typically strict specifications of traditional trials [Reference Loudon, Treweek, Sullivan, Donnan, Thorpe and Zwarenstein2]. Consider the use of an app that allows participants to participate in a trial and that delivers an app-based educational intervention. The app may reach individuals beyond brick-and-mortar sites by collecting data on and assessing eligibility through the app, and an educational intervention delivered through the app could have more uptake than an intervention that requires participants to take off from work or travel to receive the intervention in a clinic or classroom. Physical activity data generated by a wrist-worn accelerometer or heart rate data obtained through an optical heart sensor may better reflect a participant’s movement or heart rate as they go about their lives than discrete assessments of heart rate obtained in a clinic. On the other hand, the data may be noisier than data collected in the more controlled setting of a typical trial. While a smartphone app can enable participants to enroll in a study without having to come into the clinic, software glitches may present issues with enrollment or lead to selection biases related to technology access. There are challenges, however. Consider a particular pragmatic trial that relies on data from a healthcare system’s electronic health records to ascertain adverse events. In this case, access to data may be delayed relative to a traditional trial, where adverse events are collected at protocol-specific study visits [Reference Simon, Shortreed, Rossom, Penfold and Sperl-Hillen3,Reference Prahalad, Ding and Zaharieva10]. Thus, while real-world data sources offer flexibility and benefits such as greater efficiency and larger scale, they also bring their own challenges that present in the design, implementation, and analysis phases of the trial. More specifically, real-world trials have implications on data management – such as data flow and data integrity – that may threaten the overall integrity of the trial and consequently the safety of the participants. This evolution in the clinical trial landscape to the real-world setting necessitates rethinking conduct of data and safety monitoring [Reference Simon, Platt and Watanabe1,Reference Simon, Shortreed, Rossom, Penfold and Sperl-Hillen3,Reference Garcia, Balasubramanian and Lee11].
There is a wealth of literature on data and safety monitoring for clinical trials including detailed guidance from the Food and Drug Administration on how and when to incorporate an independent body of experts – known as a Data & Safety Monitoring Board (DSMB) or Data Monitoring Committee or, for observational studies, an Observational Study Monitoring Board – into trials [4–Reference Calis, Archdeacon and Bain6]. For example, it is well-established that a DSMB should oversee high-risk or high-impact trials [Reference Evans5,7]. Concrete guidance is needed, however, for DSMBs charged with monitoring real-world trials. In this paper, we expand upon an excellent body of prior work to detail novel guidelines for the DSMB, including a newly envisioned charge, composition, and emphasis. We illustrate principles using three studies as motivating examples.
Three Illustrative Examples of Trials Utilizing Real-world Sources of Data
We illustrate ideas through three examples of real-world trials that leverage different types of data sources – wearables, medical devices, and electronic health records. In each trial, the need for monitoring through a DSMB was determined. Our experience has demonstrated how the role of the DSMB could be re-envisioned. These ideas are discussed in detail below.
The first is the Apple Heart Study designed and conducted in 2018–2019 to evaluate a wearable device app’s ability to detect irregular heart rhythms [Reference Turakhia, Desai and Hedlin8,Reference Perez, Mahaffey and Hedlin9]. The second is an ongoing study for the management of type I diabetes in children utilizing a continuous glucose monitor [Reference Prahalad, Ding and Zaharieva10], and the third is a study to assess the efficacy of a statin medication therapy among elderly adults leveraging electronic health record data. While each trial possesses unique pragmatic qualities, they share compelling arguments for modifications to the charge, function, and composition of the modern DSMB.
Example 1 – Wearables: The Apple Heart Study: Using a Digital App to Recruit, Enroll, Intervene, and Capture Data
The Apple Heart Study was a prospective, single-arm, pragmatic, decentralized, digital trial that enrolled 419,297 participants over eight months (ClinicalTrials.gov number, NCT03335800). Participants were enrolled and virtually consented through a smartphone app. The study had few exclusion criteria, and participants self-reported whether they met the criteria. The exposure – an app to detect irregular heart rhythms – was considered to pose minimal risk to participants. The primary goal of the study was to estimate the proportion of participants with atrial fibrillation confirmed by subsequent ambulatory electrocardiogram patch (ePatch) monitoring among participants in whom the app detected an irregular pulse. Participants were intermittently monitored for irregular heart rhythms while wearing their watches. In most participants (>99%), the app never detected an irregular rhythm during the observation period. Participants notified of an irregular rhythm were sent an ePatch to wear for up to seven days and then return by mail. Aspects that made the trial both pragmatic and challenging are that: the digital study app was used for enrollment , as an intervention , and as one of several means to collect data . In a typical trial setting, these activities would often be facilitated by study coordination staff, interacting directly with the participant. Whether the trial required a DSMB was debated within the study team, as participation in the study was deemed to pose minimal risk to participants. The original charge to the DSMB – comprised of one statistician and two experts in cardiovascular disease – was to monitor enrollment, safety events such as rash from the ePatch or anxiety about the intervention, scientific validity, and data integrity [Reference Garcia, Balasubramanian and Lee11].
Example 2 – Medical Devices: The 4T Study: Using a Continuous Glucose Monitor for Both Pediatric Patient and Physician to Manage Disease and Provide Data on Relevant Outcomes
The Teamwork, Targets, Technology, and Tight Control (4T) Study of pediatric patients with type I diabetes evaluates early adoption of continuous glucose monitors after diagnosis in managing the trajectory of glucose levels (ClinicalTrials.gov number, NCT04336969) [Reference Prahalad, Ding and Zaharieva10,Reference Zaharieva, Bishop and Maahs12,Reference Prahalad, Zaharieva and Addala13]. This ongoing single-arm study with historical controls – which currently has approximately 230 participants enrolled – is pragmatic in that participants are observed as they receive care in the real-world setting. For example, data on hemoglobin A1c are collected at their in-clinic visits for standard follow-up care. Importantly, participants rely on continuous glucose monitor data to inform day-to-day behavioral decisions on how and when to eat, exercise, and seek additional care. The experimental intervention deviates from standard-of-care in that clinicians participating in the 4T study are prompted weekly, based on algorithmic analysis of continuous glucose monitor data, to review patients’ data to inform whether additional care should be provided [Reference Scheinker, Prahalad, Johari, Maahs and Majzun14]. Additional care may be in the form of text-based messaging and may prompt a live-connect with the patient or a request that the patient come into clinic. The role of the DSMB – comprised of one statistician and two experts in diabetes management – is to ensure patient safety, assess protocol compliance, and monitor efficacy.
Example 3 – Electronic Health Record Integration: The Statin Therapy and Global Outcomes in Older Persons Pragmatic Clinical Trial (STAGE PCT Study): Leveraging Real-world Data from 12 Healthcare Delivery Systems to Evaluate the Benefit of Statin Use on Atherosclerotic Cardiovascular Disease
The STAGE PCT study was designed as a large-scale, multi-site, pragmatic, double-blinded placebo-controlled randomized clinical trial of statin therapy on cardiovascular and other outcomes for over 20,000 individuals 75 years or older without known atherosclerotic cardiovascular disease on cardiovascular and other relevant outcomes. The study proposed to screen the electronic health records from a dozen healthcare systems for eligible patients, randomize individuals to a treatment arm (the statin of interest or placebo), and collect key data on cardiovascular outcomes obtained through quarterly extracts of relevant electronic health records using standardized definitions. A DSMB was proposed to respond to interim analyses with a proposed composition of two senior clinical trialists, a statistician with expertise in clinical trials and pragmatic research, and a participant advocate. Review of safety-related data was a key DSMB responsibility. This study was not funded, and thus, the study was not executed.
Guidelines on Data & Safety Monitoring for the Pragmatic Trial
We focus discussion on four topic areas for real-world trials: A. Charge of the DSMB; B. Composition of the DSMB; C. Pre-launch Activities; and D. Post-launch Activities.
Charge
To achieve its goals, the DSMB is typically charged with: ( i) assuring that the study protocol and study team minimize risk to participants; ( ii) monitoring recruitment to ensure adequate enrollment (rate and adherence to eligibility criteria); ( iii) monitoring safe and effective conduct of the treatment or intervention delivered; ( iv) assuring the integrity of the data, including timeliness and quality; and (v) evaluating whether the trial should conclude early due to significant benefit or risk or inability to achieve study goals [Reference Simon, Shortreed, Rossom, Penfold and Sperl-Hillen3]. We assert that, for real-world trials, attention and focus need reprioritization to achieve the goals described above. More specifically, real-world trials require a stronger and additional emphasis on evaluating integrity of the data (priority item iv ), as the integration of real-world data – that may be key for understanding delivery and uptake of the intervention (particularly if the intervention is real-world data-driven), the treatment effect, and safety – can jeopardize ability to accomplish tasks described in items i-iii and v [15].
Monitoring data integrity, even in studies that pose low risk, takes on new importance in the context of real-world trials because the data pipeline is more complex than in more typical trial settings. Real-world data are much more complicated, variable, and subject to biases. For example, the Apple Heart Study had data flows from numerous sources: the Apple Watch that generated heart rate rhythms continuously, the “gold standard” heart rate monitor or ePatch that generated heart rate rhythms continuously over a fixed period of time with accompanying summarized reports, intermittent patient-reported surveys generated by the app, and clinical data from telehealth visits. The integration of enormous amounts of data was further complicated by the devices. For example, duplicated records (e.g., due to downloading a new version of the app) led to challenges in knowing how many individuals were enrolled in the study and in longitudinally linking pieces of data back to the right participants [Reference Garcia, Lee and Balasubramanian16]. These issues with data integrity affect key pieces of trial conduct, such as monitoring enrollment and follow-up, which fall under the purview of the DSMB [Reference Garcia, Balasubramanian and Lee11].
In another example from the Apple Heart Study, battery life from the devices increased noise in the data [Reference Garcia, Balasubramanian and Lee11]. The timestamp variable from both the ePatch and the Apple Watch was critical for addressing concordance of signal from the two devices. As battery life declines, there can be measurement error in the recorded timestamp from the ePatch, which can affect the team’s ability to address this main aim. As such, it is crucial for the DSMB to understand the study team’s comprehension of measurement error and other data nuances and their plans to address the challenge to prevent errors. Issues with real-world data flow can also compromise generalizability. For example, access to Wi-Fi may be a key mechanism for data collection. Initial pilot data from the 4T Study demonstrated that the passive data upload from the continuous glucose monitors was not as complete for those participants with limited Wi-Fi access, compromising generalizability of findings, where participants of a higher socioeconomic status (and thereby with easier access to Wi-Fi) may be contributing more data than those of a lower socioeconomic status. Consequently, the study team provided iPods to participants to improve data collection through local storage until returning online.
Like the Apple Heart Study and the 4T Study, many real-world trials include data-driven algorithms that play a major role in the intervention, underscoring the importance of the integrity of the underlying data. Further, the capacity and operational model of the care team and their use of algorithms to dictate care is an important issue to assess in an ongoing real-world trial [Reference Scheinker, Prahalad, Johari, Maahs and Majzun14,17]. The DSMB should be aware of how the data-driven algorithm is developed and deployed (i.e., how the algorithm may direct care provider attention to, and away from, patients). For example, if an app is part of the intervention, does the participant’s phone plan limit their ability to receive and upload data and therefore engage? More generally, the DSMB should have clarity on possible biases or inequities in the deployment and uptake to ensure a fair and equitable process as indicated by recent work on an algorithm used to predict illness in diverse populations [Reference Obermeyer, Powers, Vogeli and Mullainathan18].
For multicenter studies integrating electronic health records from their respective healthcare systems, such as in the STAGE PCT Study, screening and enrolling from each of the proposed learning health systems requires considerable tailoring to ensure the same target study population across health systems. Because of institution-specific practices regarding storage and maintenance of healthcare-related data, the algorithm for outreach, screening, and enrolling must consider how each system uniquely captures individuals in the target population. The study team may anticipate sociodemographic differences across healthcare systems, but the team should ensure that any observed variation in screening and enrollment can reasonably be attributed to such differences in that system’s catchment area and not driven by the algorithm for screening, enrolling, and collecting data. For example, suppose a multicenter trial leveraging multiple healthcare systems had a target population of participants at risk of a cardiovascular event in the following year. Each healthcare system will need to tailor and refine a general query designed to capture this target population; the query will not be a simple “plug-in” for the local system and needs to be vetted. Similarly, ascertainment of key outcomes in such studies requires tailored approaches for local institutional vetting to yield uniformity in outcome ascertainment.
While Ellenberg and others put weight on risk of safety posed to participants in determining need for a DSMB [Reference Ellenberg, Culbertson, Gillen, Goodman, Schrandt and Zirkle19], we additionally argue that when the integrity of the data threatens the integrity of the overall study, trial monitoring by an entity such as a DSMB must be in place, even in cases where the study poses minimal direct risk to participants. An alternative to an external DSMB may be an internal team that oversees the data monitoring plan and evaluates regular reports of integrity that describe data-driven aspects of the enrollment, the intervention delivery and uptake, data collection, and study data.
Composition
DSMBs are typically comprised of individuals with diverse expertise: one or more clinicians with specialization in the condition or intervention under study and a biostatistician. Occasionally ethicists, epidemiologists, patient advocates, and others may be included [Reference Calis, Archdeacon and Bain6,Reference Obermeyer, Powers, Vogeli and Mullainathan18]. Members with prior DSMB experience are desirable, and there has been work on how to train to serve on a DSMB [Reference Zuckerman, van der Schalie and Cahill20]. As the roles and responsibilities of a DSMB evolve, so should the composition.
We are not the first to encourage rethinking the composition of DSMBs that oversee real-world trials [Reference Simon, Shortreed, Rossom, Penfold and Sperl-Hillen3,Reference Ellenberg, Culbertson, Gillen, Goodman, Schrandt and Zirkle19,Reference Hess, Roe and Gibson21,Reference Huang, Rockhold and Jones22]. Simon and others state that members of the DSMB should hold expertise in health system data and operations for pragmatic trials [Reference Simon, Shortreed, Rossom, Penfold and Sperl-Hillen3]. Similarly, Ellenberg and others encourage including a member with informatics expertise [Reference Ellenberg, Culbertson, Gillen, Goodman, Schrandt and Zirkle19,Reference Hess, Roe and Gibson21,Reference Huang, Rockhold and Jones22].
Expertise around data generation. DSMBs for real-world trials should include members who are acquainted with the source of the study data critical for addressing study goals, potential issues with data flow that may arise from the source(s), and the potential downstream implications for study integrity. If the study involves data from multiple healthcare systems, a healthcare information technology expert would be a critical DSMB member. The individual should understand the underlying data characteristics and structure in the electronic health records, how those data are captured and stored, and how each institution’s healthcare system is uniquely dynamic. If data from a wearable device (e.g., continuous glucose monitor) are key, an expert on the device is critical. If apps are used, inclusion of a software engineer or information technology professional is prudent. More broadly, these roles are often referred to as data quality engineers. DSMB members unfamiliar with the data source may not know the right questions to ask that would alert the study team to critical issues such as missing or low-quality data that could indicate suboptimal protocol implementation or result in entirely missing certain safety events. Failure to understand and account for these issues in analyses can lead to large biases and misleading inferences.
Expertise to consider data from the participant perspective. In the typical trial setting, coordination staff or study team members are often tasked with interacting with the participant directly to consent, monitor engagement and safety, explain the intervention and use of the data, and serve as a go-to point of contact for the participant. In some real-world trial settings, there may be pragmatic aspects to the trial – for example, if enrollment and data collection are decentralized – that enable participants to have light to nointeraction with study staff. This level of pragmatism relies on automation and electronic processes to accomplish these goals [Reference Huang, Rockhold and Jones22]. In these contexts, real-world trials put some of the onus on the individual participants (e.g., to provide data, perhaps passively through wearable devices or actively through participant-reported outcomes). In such cases, it is critical to understand the burden on the participant. This is especially important when devices are a part of the intervention itself and inform or guide participant action, as in the Apple Heart Study. Trials that rely heavily on participant actions may face challenges with respect to engagement – particularly if the intervention is algorithm driven – that may not be distributed equally across clinical presentations or sociodemographic factors. Thus, depending on the trial’s generalizability goal, it may be important to include clinical experts who engage the community [Reference Woodcock, Araojo, Thompson and Puckrein23]. Along similar lines, providing consent for a real-world trial may require knowledge of not only the study itself, but also how the participant’s data will be leveraged for the participant, the study, and shared more generally. Although data privacy issues are not necessarily specific to trials that incorporate real-world data sources, inclusion of a board member who has expertise in data privacy may be particularly advantageous, as data privacy may pose unique issues. Consider for example data that describe screen activity (time series screenshots from an individual’s phone). Underlying data of screenshots may include photos of individuals (family members and friends of the participant) who have not provided consent, yet their data may become part of the research study. The handling of such data may require special expertise. Finally, depending on the study and not necessarily specific to real-world trials, expertise in medical ethics may be important.
We recommend DSMBs for real-world trials hold expertise in the following: the clinical aspects of the condition, the patient perspective, the intervention being evaluated (which may rely on artificial intelligence or machine learning methods), the data types generated, the source(s) generating the data, the fundamentals of statistical principles, and the monitoring of trials [17]. It is important to ensure diverse voices on the DSMB that can speak to multiple aspects of the trial conduct and that more voices can speak to key aspects of the data integrity.
Pre-launch
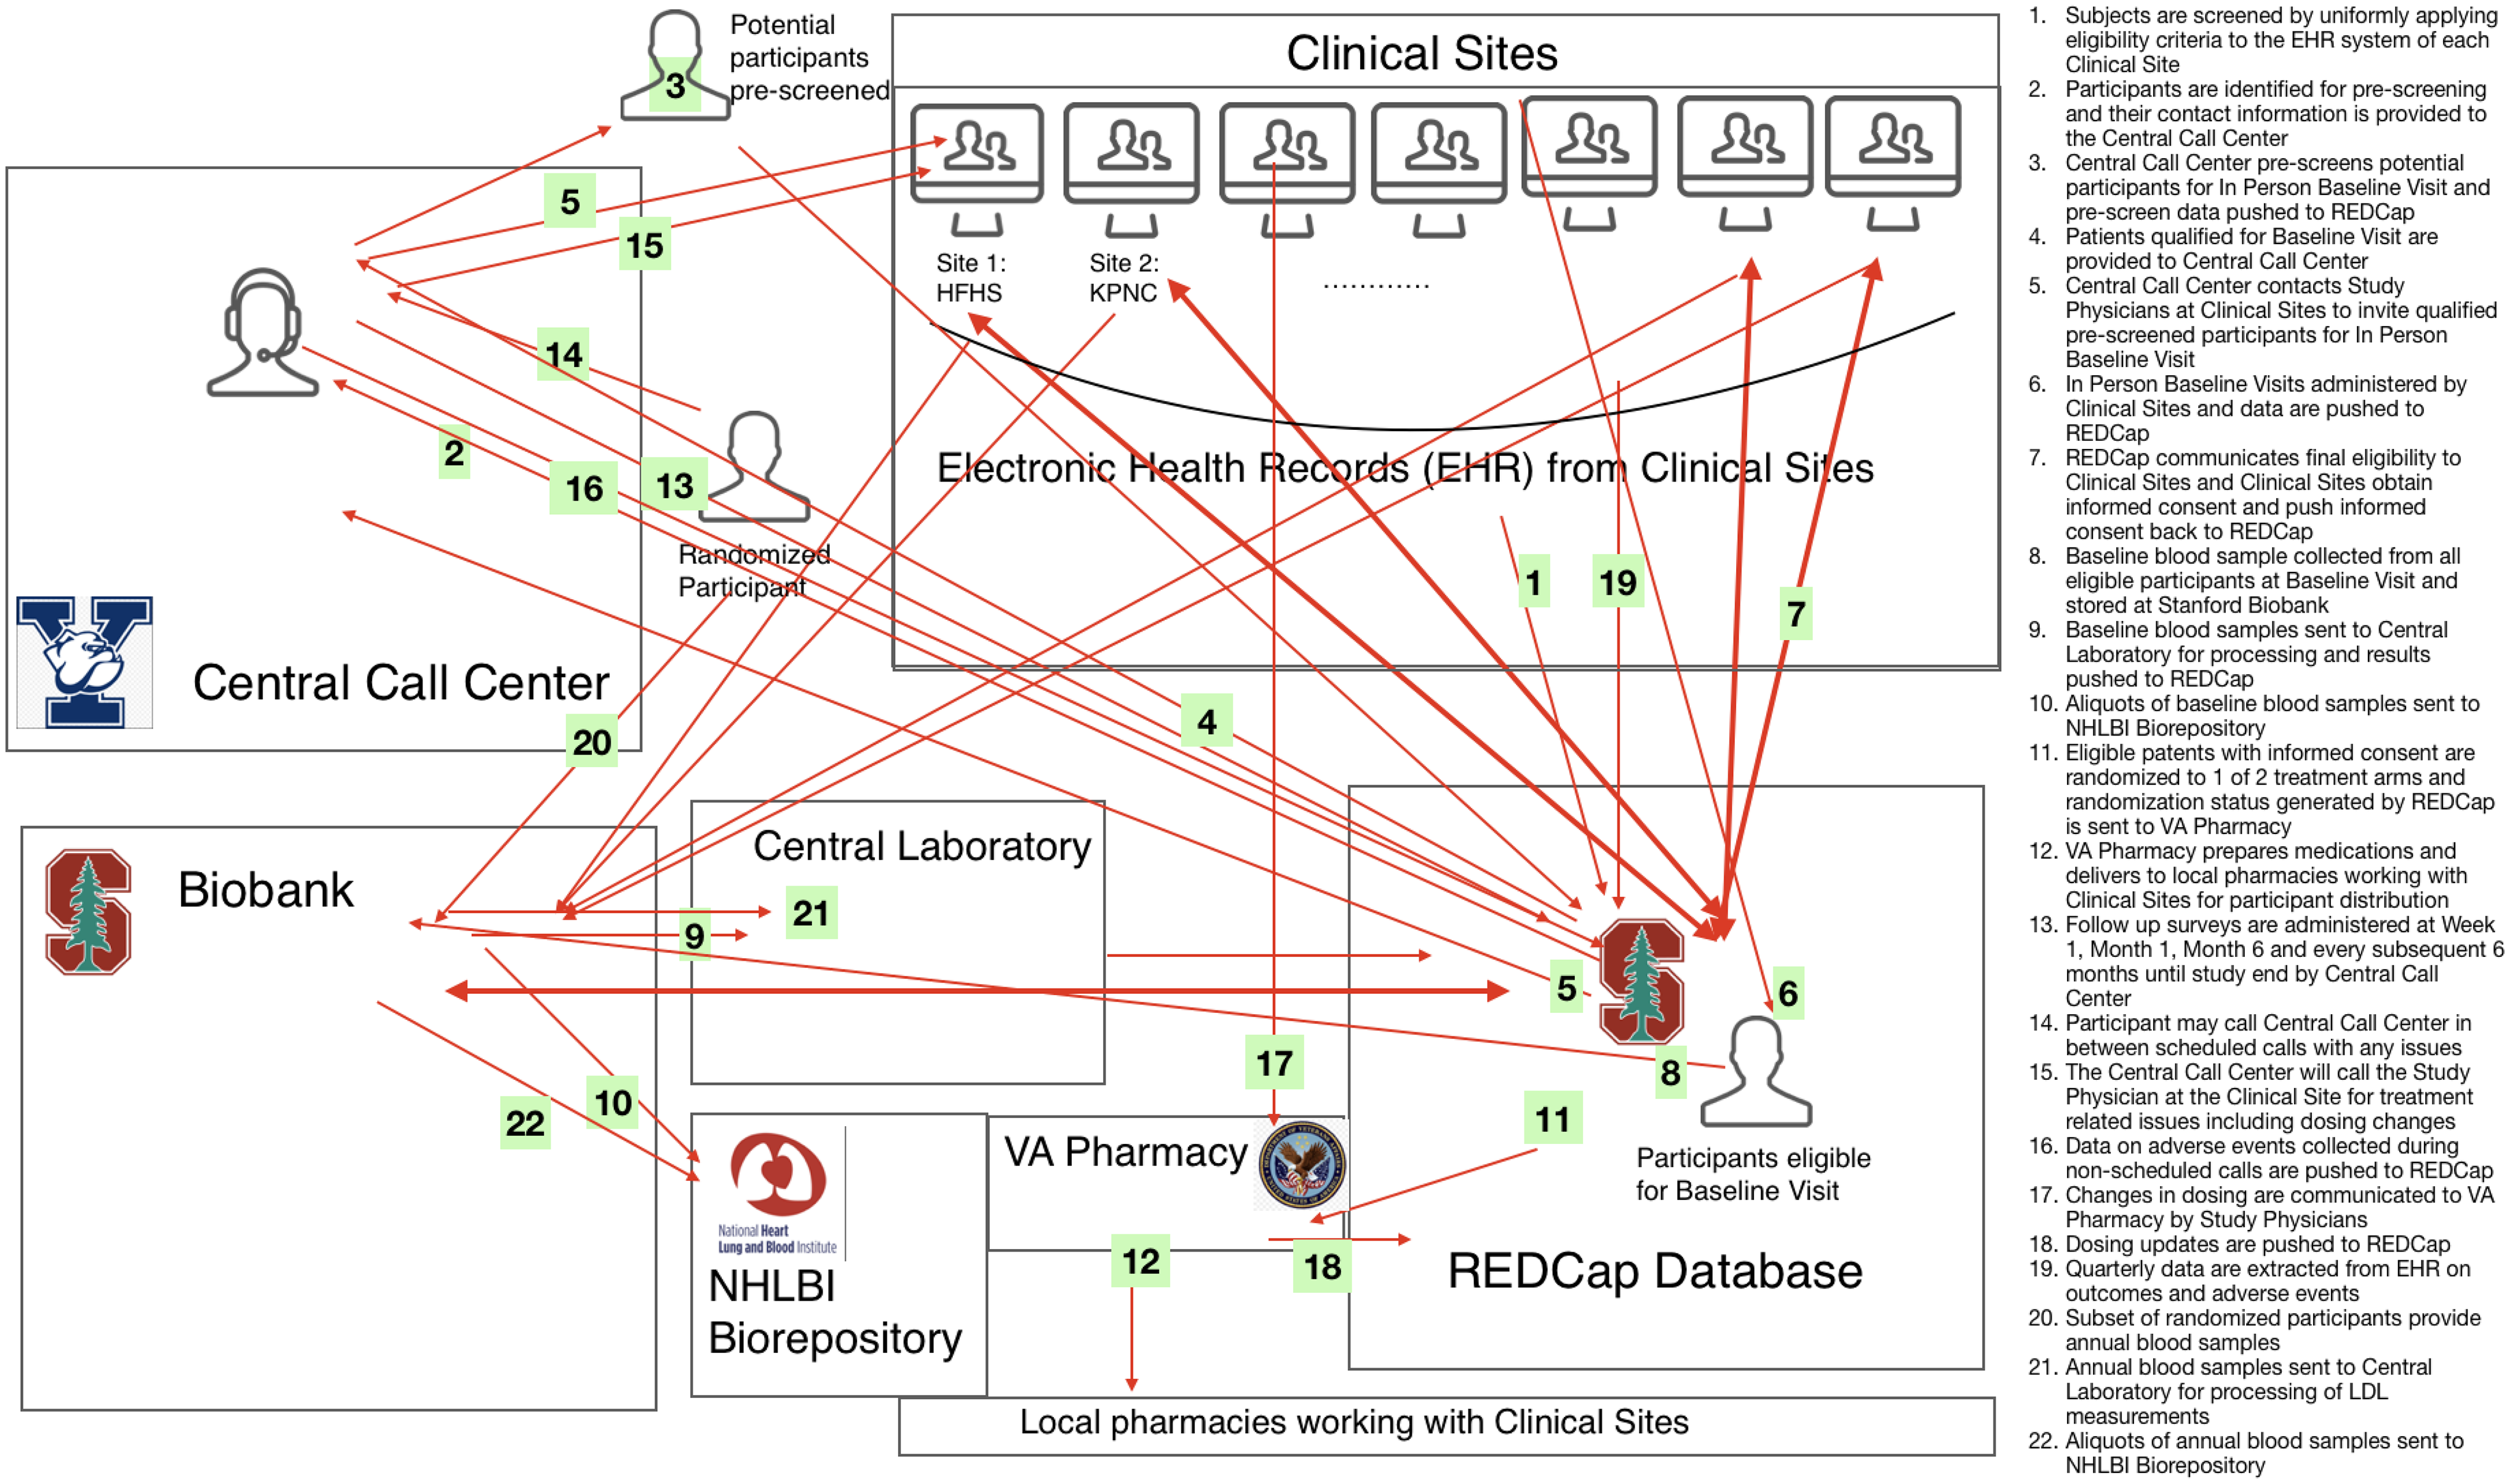
A kickoff meeting with the DSMB typically takes place prior to launch of the study to orient DSMB members to their charge and to obtain initial guidance. Materials are reviewed that include the charter, the overall study design and goals, and the statistical analysis plan. We argue that for real-world trials, additional feedback may prove beneficial on plans related to data integrity. This includes a data flow chart (See example from the STAGE PCT Study in Fig. 1), the data sharing and monitoring plan, how the data may impact the allocation of care provider attention, definitions for key monitoring terms and how they will be measured in the trial given the real-world data sources used (e.g., lost to follow-up, study withdrawal, patient adherence, adverse events, and protocol deviations), and, if available, findings from a pilot phase, discussed in detail below. A list of topics and associated reports that should be included for discussion at the kickoff meeting for real-world trials are presented in Table 1.
Data flow chart of the the statin therapy and global outcomes in older persons pragmatic clinical trial (STAGE PCT).
Topics of interest in a real-world trial requiring DSMB involvement with example reporting

Pilot
Previous literature points to the importance of a pilot phase prior to study launch to provide insights into data flow and integrity [Reference Garcia, Balasubramanian and Lee24,Reference Inan, Tenaerts and Prindiville25], especially if there are components that are not modifiable after study launch. The pilot can test the strength and integrity of data pathways, inform the study team on a finalized study design, and provide the DSMB with insight into the study team’s rationale. Additionally, the pilot can inform the metrics to be reported to the DSMB and how the metrics should be designed and tailored to the type of real-world data used [Reference Fleming, DeMets and Roe26].
The Apple Heart Study team discussed the potential benefits of a pilot study in their work on the lessons learned [Reference Garcia, Balasubramanian and Lee24]. While the Apple Heart Study team had to be nimble to respond to ongoing issues, the static nature of the app required the team to fix certain features before enrollment began. A pilot study was noted as the most important lesson, as it may have provided insight into issues with integrating data across multiple sources with a potential to learn about record duplication, missing data, and the noise of critical time stamp variables. Although not every issue will be uncovered, conducting a pilot study that includes and goes beyond end-to-end testing of the data capture will ultimately increase efficiency and allow for a smoother trial.
The 4T Study team recognized the need for a pilot study and gained considerable insight into data flow and operational challenges. It was in the pilot phase of the 4T Study where the team found continuous glucose monitor passive data uploads were incomplete for participants with limited Wi-Fi. This data discrepancy alerted the team to an issue of equity, as individuals with lower socioeconomic status had less access to Wi-Fi, which made them more likely to contribute less data. Local storage solutions (iPods) were provided to reduce the gap in missing data rates.
The data collection proposed in STAGE PCT relied heavily on electronic health record and other data collected from the respective healthcare systems of the participating sites. A common algorithm would be developed to identify clinical outcome events. The study team had proposed a pilot phase so that the common algorithm could be tested for tailored refinement across the sites. Thus, the pilot would be leveraged to understand the properties of the algorithm and its ability to enroll from the same target population across each healthcare system. The study team additionally anticipated that the data collection process would experience a lag due to the need to apply the algorithm at each site and then transfer the data to the data coordinating center. Such a lag is of importance to a DSMB, particularly when safety is being monitored, and the proposed pilot would have provided insight into the possible shortcomings of the data flow so that corresponding solutions could be provided.
Conducting a pilot to refine the study design is a worthwhile investment. Reviewing pilot findings with the DSMB will alert the DSMB to issues they should be aware of and ongoing metrics to monitor. Ideally, the pilot should result in a vetted data infrastructure and a reproducible reporting structure for ongoing study monitoring.
Key Monitoring Metrics
Monitoring retention, engagement, and adherence requires clear pre-specified definitions for terms such as “lost to follow-up,” “withdrawal,” and “lack of adherence.” Additional nontraditional terms (e.g., device wear time) may be of interest depending on the data and its collection strategy (active or passive). In traditional trials, there may be standard ways of assessing adherence to study drug such as counting the number of pills remaining at each study visit. In real-world trials, the “dose” received may be based on medication refill pattern or frequency of engagement with a smartphone app. Further, there may be multiple domains of participant adherence that should be captured. For example: (1) engaging with an app to receive a text message that informs the participant to exercise; (2) acting on the instructions provided in the message; and (3) completing a daily patient-reported survey. There may be trial-specific challenges to defining and measuring such metrics. To complicate matters, trials that rely on real-world data sources do not always include pre-specified follow-up visits with protocol-defined windows, as in all three of our examples. Often a mix of passively and actively collected data will contribute to measurements and inform monitoring (See Fig. 2). For example, if the study team wants to understand whether the participant follows text-based instructions to exercise, they could measure adherence to instructions (albeit noisily) by leveraging passively collected heart rate data on a wearable. The pre-specified key definitions surrounding participant monitoring should be discussed with the DSMB. Note that clarity on these metrics is necessary for defining interpretable analysis sets (e.g., intent-to-treat, safety, and per-protocol), which inform the quality and generalizability of the clinical evidence generated.
Violin plots highlight the data distribution of the overall Teamwork, Targets, Technology, and Tight Control (4T) Study population across different metrics used as proxies for overall patient adherence, including CGM wear time, the open rate of messages sent from the patient’s clinical team, message response rate, message response time, and finally the average change in time in range one week following a message. This last metric is proposed as an indicator of whether a given patient is adhering to behaviors recommended by the care team. This illustrative visualization also allows for users to split data by factors including the patient’s race, gender, insurance type, age, and preferred langauge. The lower visualization shows population level adherence metrics with a split across insurance type selected. Note that the distributions presented are illustrative and are not necessarily representative of the 4T study.

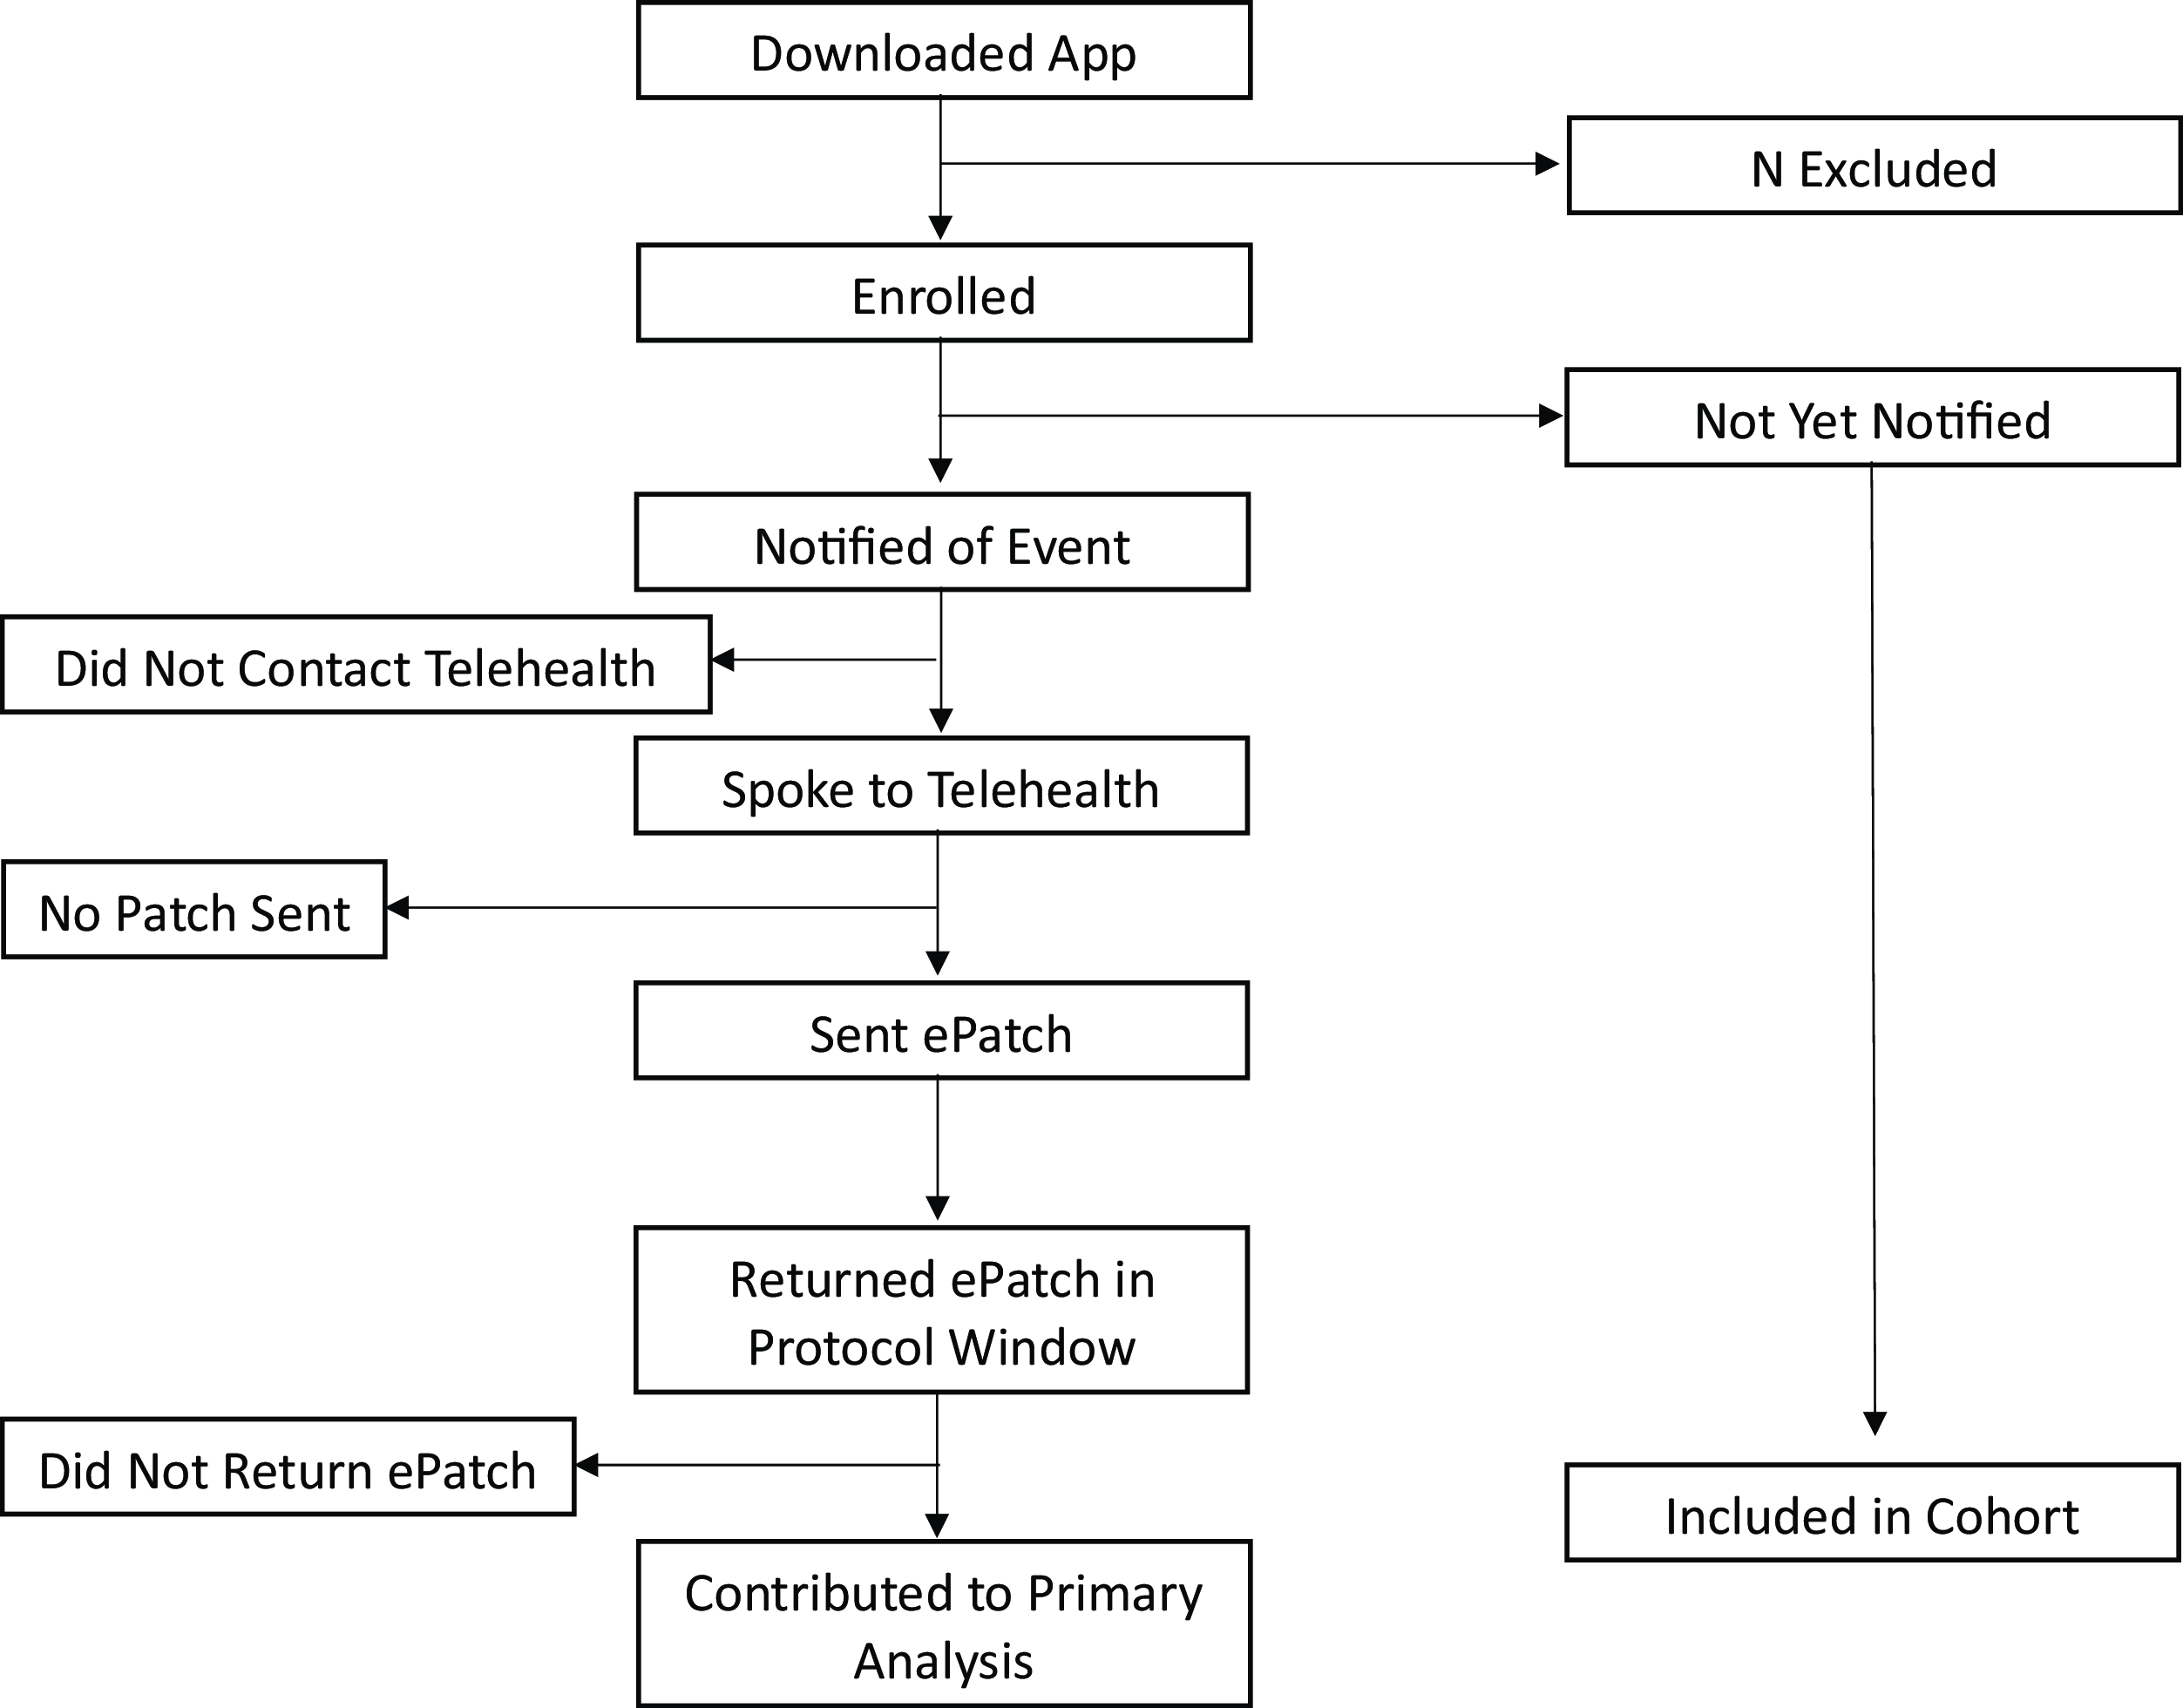
For example, in the Apple Heart Study, consider a participant who may not have contributed any heart rate data through the app because they did not wear the watch throughout the study, but who filled out the participant-reported survey at the end of the study when they ultimately put their watch on. This participant may not have been “exposed” to the app (i.e., the intervention) throughout the study period, but they were considered retained in the study through study completion. While the participant had complete follow-up, they were not adherent to the protocol, as they were not fully engaged with the app and did not have complete and accurate outcome ascertainment. Consider another participant who enrolled and then subsequently deleted the app without stating that they were withdrawing from the study. This individual would be considered lost to follow-up at the time they deleted the app. To understand the “treatment dose” of the app, the study team and DSMB may additionally wish to understand wear time and gain consensus on how to measure it. With the value of hindsight, we provide an example of a figure that could have been beneficial in the monitoring of what we would consider adherence in the Apple Heart Study. The proposed “Adherence Monitoring Diagram” (Fig. 3) represents a periodically updated flow diagram to record the counts of individuals who progress through important stages of the protocol that may assess where in the pipeline the decentralized study is “leaky” and at risk of losing participants. The diagram shows multiple pathways where participants could be non-adherent. It is nontrivial to aggregate such count data, as the data needed will be in disparate locations.
Proposed participant adherence monitoring diagram based on the protocol from the Apple Heart Study example. Each box represents a count of the number of participants who completed the given step in the protocol.
All three example studies required unique definitions for each of these terms (lost to follow-up, withdrawal, and protocol adherence) along with methods for measuring how participants meet those definitions. Note that study adherence and engagement may be a time-varying state for participants. For example, for the 4T Study, to gain insight into engagement with the program’s multi-faceted intervention, a heatmap may be a useful tool in understanding time-varying features including wear time of the continuous glucose monitor, if/when the clinical team messages the participant, and if/when the participant reads the message (Fig. 4). Such metrics can be aggregated to understand adherence and engagement metrics on average with visualizations that also sort the participants by diversity metrics like insurance status to gain insight into fairness of the team’s engagement scheme/algorithm as well as uptake of the intervention (Fig. 2).
Example visualization picturing average weekly time in range for a given patient over time, split by time of day. Messages sent by clinical team are also overlayed, and color coded by whether or not they were read by the patient. The purpose of this visualization is to provide a quick overview for whether or not a patient is responding to recommendations provided by the care team.

Similar to the traditional trial, other key monitoring metrics include protocol deviations and safety events. Protocol deviations in a real-world trial may include a variety of situations such as apps crashing, no connectivity to the internet, including an ineligible participant due to inaccurate electronic health record data, delays in documenting events only observed in the healthcare system, the person wearing the device is not the person who consented, or the data collected are not solely from the person who consented. These could be particularly problematic if the study participant’s main contact with the study is virtual. Anticipating protocol deviations and how they will be captured requires expertise on the data source and methods and is important to anticipate and pre-specify with the DSMB.
Study teams of real-world trials should also consider the potential biases in adverse event reporting when adverse event collection is participant-initiated or collected passively. Continuously sensing and informing participants may have downstream effects such as over-diagnosis or over-utilization of health care, particularly for new interventions or data collection techniques that have yet to be well-studied. Nontraditional safety events that capture this phenomenon must be defined in advance (e.g., how many additional medical tests were ordered downstream of engaging the participant that did not result in a new diagnosis or treatment deemed to improve the participant’s health or quality of life) and modified during the study if the approach is misclassifying true adverse events.
Post-Launch
With clearly defined key monitoring terms, longitudinally following the regularly generated data reports that include anticipated data integrity issues is key to monitoring the trial’s overall integrity. Seeing a rapid and sudden change in adherence reports, for example, could reflect a problem in the data pipeline or protocol. However, it is impossible to anticipate or uncover all issues a trial may encounter. For this purpose, it is beneficial to establish a structured process to report unanticipated problems in data integrity to the DSMB (See Supplement). When problems occur, it is important to assess how an informatics problem may affect safety, study integrity, inference, or generalizability. Corrective action plans can serve to address how the study team can resolve issues and demonstrate success in mitigating issues. In the Apple Heart Study, when duplicated records were discovered despite an initial deduplication scheme, the study team developed and evaluated performance of a refined deduplication algorithm while the study was ongoing. While enrollment was not interrupted, the study team continued to carefully assess the issue of duplicated records throughout the lifespan of the study [Reference Garcia, Lee and Balasubramanian16]. Additionally, access to intensively sampled data – a feature that accompanies some real-world data – can be leveraged opportunistically to monitor key study activities in real-time. This can enable pre-specification of data-derived rules that trigger various actions. For example, the Apple Heart Study team implemented metered enrollment as a precaution to make sure a much higher than anticipated notification rate was not observed which would have signified abnormal behavior of the algorithm “in the wild” that could lead to false positives.
Conclusions
Clinical trials can benefit from incorporating real-world data sources, potentially increasing the generalizability of findings and overall trial scale and efficiency. The data, however, present a level of informatic complexity that relies heavily on a robust data science infrastructure. The pragmatism of real-world trial design commonly includes flexibility in data capture and the mechanism of enrollment that differs from the tightly controlled traditional trial. The real-world trial design trades the work of a clinical team interfacing with study participants for an increased burden on the informatics team around data capture, flow, integration, and analysis. There are features to real-world trials that necessitate a new way of providing oversight than necessary in previous eras. Through three examples of real-world trials, we illustrate how real-world trial oversight must evolve to uphold fundamental principles. We provide guidance surrounding DSMBs in four main areas that are particularly affected by the integration of real-world data sources: the charge, the composition, activities prior to launch, and activities post-launch.
An important consideration is whether a trial can benefit from a DSMB in the first place. Ellenberg and others provide a tool to assess whether a trial needs DSMB oversight, which considers the level of risk posed to participants, as many modern pragmatic trials are considered low-risk [Reference Ellenberg, Culbertson, Gillen, Goodman, Schrandt and Zirkle19]. In our experience, however, issues with data integrity alone in certain real-world trial scenarios have downstream impact that threaten the overall integrity of the trial, even when risk to the participant is minimal. The heart of such issues is bias. Leaving such issues unaddressed or ignoring biases has potential to result in misleading, non-replicable, or otherwise invalid conclusions [15]. Extending ideas from Evans and others that state DSMBs are particularly needed in the context of high uncertainty, we argue that the presence of real-world data introduces a level of uncertainty that often well exceeds that of traditional trials, and thus these real-world trials need DSMB oversight even in the absence of direct risk to participants by the intervention being studied. We, therefore, recommend DSMBs of real-world trials have an increased focus on data integrity that includes data flow and integration. We assert that the composition and expertise of DSMBs for real-world trials should reflect the monitoring needs of the data leveraged in the trial. Real-world trials present atypical monitoring needs, opening the door for informatics, software engineering, platform development, and other unique facets of expertise for a DSMB.
Training a new generation of DSMB members is key in achieving this goal [Reference Hess, Roe and Gibson21,Reference Fleming, DeMets and Roe26]. The pool of data scientists and engineers familiar with clinical trial design, conduct, and trial monitoring is small. Ensuring real-world trials have experts available to serve on their DSMBs requires curricular modifications for these fields to incorporate and expand training in clinical trials, trial integrity, and trial monitoring. With the right composition – specifically one that is knowledgeable and well-positioned to monitor the data integrity of real-world data sources – DSMBs can be even more effective in providing support and oversight of real-world trials to best aid the study team’s goal of generating evidence that is robust, reproducible, and replicable.
Supplementary material
The supplementary material for this article can be found at https://doi.org/10.1017/cts.2023.582.
Acknowledgments
We thank all participants who devoted their time and attention toward the clinical research described in this manuscript, and for the professionals who volunteer their time to serve on Data and Safety Monitoring Boards.
Funding statement
This manuscript is partially supported by the following NIH grants: Stanford’s CTSA-sponsored Biostatistics, Epidemiology and Research Design Program (RRID:SCR_203695): UL1TR003142; the Clinical and Translational Core of the Stanford Diabetes Research Center (RRID:SCR_016212): P30DK116074; the Biostatistics Shared Resource (B-SR) of the NCI-sponsored Stanford Cancer Institute (RRID:SCR_023696): P30CA124435; the NIH funded “Novel machine learning and missing data methods for improving estimates of physical activity, sedentary behavior and sleep using accelerometer data:” R01LM013355; the NIH funded “2/1 Arrest Respiratory Failure due to Pneumonia:” U24HL141727, and the National Library of Medicine 2T15LM007033.
Competing interests
BJB, HH, JDC, JOF, AG, RJ, JL, KOO, MP, KR, HS, MT, & MD have no disclosures.
JHC has received research grant support from NIH/National Institute on Drug Abuse Clinical Trials Network (UG1DA015815 - CTN-0136), Stanford Artificial Intelligence in Medicine and Imaging - Human-Centered Artificial Intelligence (AIMI-HAI) Partnership Grant, Doris Duke Charitable Foundation - Covid-19 Fund to Retain Clinical Scientists (20211260), Google, Inc. Research collaboration Co-I to leverage EHR data to predict a range of clinical outcomes, and American Heart Association - Strategically Focused Research Network - Diversity in Clinical Trials. JHC discloses: Co-founder of Reaction Explorer LLC that develops and licenses organic chemistry education software & Paid consulting fees from Sutton Pierce and Younker Hyde MacFarlane PLLC as a medical expert witness.
EF is supported in part by AFOSR Grant FA9550-21-1-0397, ONR Grant N00014-22-1-2110, and the Stanford Institute for Human-Centered Artificial Intelligence (HAI). EBF is a Chan Zuckerberg Biohub – San Francisco Investigator.
AGo has received research funding from the National Heart, Lung, and Blood Institute; National Institute of Diabetes, Digestive, and Kidney Diseases; and the National Institute on Aging. He has also received research grants through his institution from Novartis, Bristol Myers Squibb, Pfizer, Janssen Research & Development, CSL Behring, iRhythm Technologies, and Amarin Pharmaceuticals.
RJ was partially supported by the National Science Foundation under grant 2205084, and by the Stanford Maternal and Child Health Research Institute under the Transdisciplinary Initiatives Program.
DMM has had research support from the NIH, JDRF, NSF, and the Helmsley Charitable Trust and his institution has had research support from Medtronic, Dexcom, Insulet, Bigfoot Biomedical, Tandem, and Roche. Dr Maahs has consulted for Abbott, Aditxt, the Helmsley Charitable Trust, Lifescan, Mannkind, Sanofi, Novo Nordisk, Eli Lilly, Medtronic, Insulet, Dompe, Biospex, Provention Bio, and Bayer.
DS discloses advising Carta Healthcare.
MPT has received grants or personal fees from American Heart Association, Apple, Bayer, Bristol Myers Squibb, FDA, Gilead Sciences, Johnson & Johnson, Medtronic Inc., Myokardia, Pfizer, and Sanofi, is a shareholder of AliveCor, Connect America, Evidently, Forward, iRhythm, and PocketRN, and is an employee of iRhythm Technologies, Inc.
KWM’s financial disclosures can be viewed at http://med.stanford.edu/profiles/kenneth-mahaffey.


 Open access