


Social media summary: New research shows that people are good at telling when someone fakes their accent, and this ability varies by region
How good are humans at identifying cheaters? Previous research has provided mixed findings: people do not detect lying at a consistently higher-than-chance rate across controlled trials (Bond and DePaulo, Reference Bond and Depaulo2008). Recognising and thwarting free riders, however, is considered in the human evolutionary sciences to have been pivotal in the development of large-scale societies (Tooby and Cosmides, Reference Tooby, Cosmides, Barkow, Cosmides and Tooby1992).
One solution to this issue is the evolution of tags, which may allow cooperators – or more specifically, members of cultural groups with high rates of parochial cooperation – to detect one another. McElreath et al. (Reference McElreath, Boyd and Richerson2003) suggest that clothing styles, tattoos or speech patterns may be tags through which cooperative behaviours are directed. In humans, tags are likely to be inherited socially and signal social identity (see Barth, Reference Barth1969; Brewer, Reference Brewer1991; Axelrod et al., Reference Axelrod, Hammond and Grafen2004; see also Smaldino, Reference Smaldino2019). This logic helps to explain the evolution of covert signals (‘secret handshakes’; Robson, Reference Robson1990, see also Smaldino et al., Reference Smaldino, Flamson and McElreath2018), or signals that represent social identity or group membership, that – ostensibly – only target members of the population recognise and issue (see Adami & Hintze, Reference Adami and Hintze2013 and Wiseman & Yilankaya, Reference Wiseman and Yilankaya2001; see also Pietraszewski, Reference Pietraszewski2022 for a recent and detailed discussion of a computational definition of groups).
Yet if tags are not inflexible phenotypes fixed genetically, cheating represents a significant problem for their implications for human cooperation (McElreath et al., Reference McElreath, Boyd and Richerson2003). If, for example, individuals in a cultural group direct altruistic behaviours towards people bearing a group-related tag, such as a tattoo, it is likely that non-group members will mark themselves with the tattoo to free-ride on group benefits, without themselves directing altruism towards true group members (Dawkins et al., Reference Dawkins, Krebs, Maynard Smith and Holliday1979; Ruxton et al., Reference Ruxton, Sherratt and Speed2018).
Evolutionary psychologists have suggested, as a potential solution to the free-rider problem, that a general cheater detection module may thwart free riding across human cooperative networks. Insofar as individuals can recognise and eliminate cheaters from groups, the inclusive benefits of tag-based cooperation are likely to remain unadulterated (Cosmides & Tooby, Reference Cosmides and Tooby1992). Research into false laughter (Bryant & Aktipis, Reference Bryant and Aktipis2014) and fake cooperative intent (Verplaetse et al., Reference Verplaetse, Vanneste and Braeckman2007) suggests, in line with this general hypothesis, that humans are better than chance at recognising social deception, although the rate of detection is generally about 60–70%. Some deceivers, by implication, evade detection – although the interplay between cooperation-related deception and detection is not well established.
With tags of social origins or identity, furthermore, we should not expect that individuals across social groups are equally good at mimicry detection. Any intergroup variance may therefore suggest culturally specific qualities to thwart free riding. The process of ethnification (where a group becomes phenotypically distinct from others; see Barth, Reference Barth1969; Boyd & Richerson, Reference Boyd and Richerson1987; Gil-White, Reference Gil-White2001; Bell & Paegle, Reference Bell and Paegle2021; Tucker et al., Reference Tucker, Ringen, Tsiazonera, Hajasoa, Gérard and Garçon2021) may play a role in explaining inter-group variance in the detection of mimicry of identity-specific signals. It is possible that varying cultural contexts determine the local emphasis placed on the similarity of accent of speaker and receiver (see Cohen, Reference Cohen2012; Cohen & Haun, Reference Cohen and Haun2013), depending on local cultural diversity, cultural boundaries and any local manifestations of parochial altruism relying on social identity signals.
Cohen (Reference Cohen2012; see also Cohen & Haun, Reference Cohen and Haun2013; Padilla-Iglesias et al., Reference Padilla-Iglesias, Foley and Shneidman2020; Cohen et al., Reference Cohen, van Leeuwen, Barbosa and Haun2021) has suggested that accents of languages may be candidates of such tags. Furthermore, accents, unlike laughter, are specific to cultural groups and vary significantly even within subcultures (Nettle, Reference Nettle1999). The causes of cultural diversity, of which linguistic and accent diversity is a part, probably vary by ecological and sociological conditions (Collard & Foley, Reference Collard and Foley2002; Foley, Reference Foley and Jones2004; Foley & Lahr, Reference Foley and Mirazón Lahr2011), but stochastic drift (Nettle, Reference Nettle2012), prestige bias (Henrich & McElreath, Reference Henrich and McElreath2003) and functional and social (Nettle, Reference Nettle1999, Reference Nettle2012) selection are likely candidates. These processes introduce change in accents both at the group and individual levels. Individuals, for example, are known to change their accents over their lifespan (Evans & Iverson, Reference Evans and Iverson2007), and the ability to effectively perceive regional dialects is known to improve through adolescence to adulthood (McCullough et al., Reference McCullough, Clopper and Wagner2019).
The diversity and complexity of accents, as well as their importance as markers in modern Western societies (Kinzler, Reference Kinzler2021), suggests their recognition may function, at least partly, as a mechanism for directing parochial altruism. Previous work (see Cohen, Reference Cohen2012) suggests that accents may help individuals to do so: they are salient, properties of an individual, readily discriminable, dynamic and universal across cultures, among other qualities.
More broadly, while accents of languages may initially have evolved through drift after group dispersal (see Nettle, Reference Nettle1999), they may directly or indirectly have made possible social categorization (Pietraszewski & Schwartz, Reference Pietraszewski and Schwartz2014a, Reference Pietraszewski and Schwartzb). Insofar as individuals present a social identity, indicating social origins, through accent-related signals, listeners might use these signals to inform partner choice, or bias judgments about speakers more broadly, with the consequence that listeners may emphasise or de-emphasise markers of their own cultural group, including accent, in response (Barth, Reference Barth1969; see also Smaldino, Reference Smaldino2019).
These hypotheses are supported by research in sociolinguistics over the 75 years. Labov's (Reference Labov1963) classic study showed, for example, that the strength of a local accent speaker's linguistic markers can correlate with their own views of their social identity with reference to outsiders. This was shown in Martha's Vineyard, an island off the northeast US coast, and was reproduced in several studies (see, for example, Chambers, Reference Chambers1995). A study by Bourhis and Giles (Reference Bourhis, Giles and Giles1977) showed that Welsh speakers emphasised their local accents when interrogated by an aggressive English interlocutor in an experimental setting. More recent studies have repeatedly shown that an individual's accent can drive a listener's perceptions of the speaker's personal or physical characteristics, and even their trustworthiness, regardless of whether the listener is a child or adult (Kinzler et al., Reference Kinzler, Corriveau and Harris2011; see Giles & Billings, Reference Giles, Billings, Davies and Elder2004 for a review).
For a feature to qualify as a tag in the evolutionary sense it must, however, be difficult to fake, or honest, to use the terminology from signalling theory (Zahavi, Reference Zahavi1975), which prevents free riding by cheaters – although few data exist to date that have helped to verify this premise. Similarly, previous work has not explored how group-level differences in detection of accent mimicry manifest, or the reasons for those manifestations, if they exist.
In the present study, we explored this set of issues over two experiments, which aimed to verify the overall rate of accent mimicry-detection in a large cohort of participants, and to determine inter-group variation in such detection. We have two hypotheses, which we explore and discuss further throughout this paper:
H1: Individuals across groups are likely to be better than chance at mimicry detection;
H2: Individuals with social identities matching the target mimicry identity are likely to be better than others at mimicry detection.
We tested these hypotheses by recruiting more than 900 participants from seven areas across the UK and Ireland to mimic, and attempt to detect mimicry of, the accents spoken in their own home areas. We then recruited a larger group of participants online, which both improved the sample sizes from these seven areas and served to create a control group for comparison.
Our results are in line with expectations with our hypotheses; notably, while participants across groups were better than chance at detecting accent mimicry, participants who spoke naturally in a stimulus's target accent often performed better than others at the accent recognition test.
Methods
We ran this experiment in two separate phases (Figure 1). In the first, we created a series of sentences to be recorded by speakers of seven accents of English, which varied in the ranges of their geographic usage. We used the following accents: northeast England, Belfast, Dublin, Bristol, Glasgow, Essex and received pronunciation (RP), commonly understood as standard British English. We asked participants in phase 1 to read the sentences outlined in the Supplement §1, which we designed to elicit phonetic variables distinguishing between our accents of interest, using Wells (Reference Wells1982).
Flowchart of phases 1 and 2 as described in the Methods.

We received ethical clearance from the University of Cambridge (Graduate Education Committee, August 2021); all data were, per protocol, de-identified and stored on a Cambridge University cloud system, and were password protected. All de-identified data are available on Github (https://github.com/jonathanrgoodman/accents-2).
Phase 1 design and recruitment
We divided phase 1 into three parts. In phase 1A, speakers (n = 8; four male and four female for each accent of interest, for an intended phase 1 accrual of 56 participants) read a set of sentences recorded using the Qualtrics survey platform (https://www.qualtrics.com) with a plug-in from Phonic.Ai (https://www.phonic.ai) to allow for user recording. Participants used their own home hardware, which could have been a mobile device or desktop computer. We then chose the six recordings (three for each sex per accent, comprising 42 total recordings) that we believed best represented the accents of interest for use in phase 1B (see the Supplement §1). We chose only two recordings for females from Bristol because of low accrual. We also included four females and two males from Glasgow because of accrual problems.
In phase 1B, the same participants recruited to 1A were asked to mimic 12 of the selected sentences in the other of the six accents in which they did not speak naturally, chosen randomly. For example, a participant from northeast England mimicked two random recordings each from speakers from Belfast, Dublin, Bristol, Glasgow and Essex and RP. Females mimicked females; males mimicked males.
Each participant was given two tries per sentence in case of error or poor recording quality. We then chose six mimicry attempt recordings for each accent (three for males, three for females) that we believed best approximated the accents in question. This was based on judgments made by the study authors regarding successful reproduction of the phonetic variables of interest at the sentence level (see the Supplement §1 for details).
Finally, in phase 1C, the same participants again were asked to listen to mimicked recordings from other participants of their own accents of both genders and to determine (a) whether the mimicry recordings were fake, (b) their confidence in this response, measured on a confidence scale from 1–3 and (c) whether the accent appeared to be ‘strong’ or ‘weak’.
All participants were asked to determine whether the speaker was an accent-mimic for each of 12 recordings (six mimics and six genuine speakers, presented in random order). We coded sentence-level scores as ‘1’ or ‘0’ for whether mimics were correctly identified and where genuine accent-speakers were correctly identified, and for false-positives and false-negatives, respectively. The maximum score on this task was 12. Listeners were asked to listen to each stimulus twice.
Because of the study design, it was possible for a participant to hear their own voice during the exercise. For this reason, in phase 1C, we had an additional possible check box indicating ‘I think this is my own voice’. We removed answers where this box was checked; we also checked responses to ensure that no participant heard their own voice and did not check the box. Also, as we chose those recordings that best represented the accent in question, males and females did not hear the same recordings on task 1C. While it was possible for participants to hear the same stimulus in tasks 1B and 1C, the phases took place over one month apart, and given the recordings were on average 2 seconds long, we do not believe this creates any noise in our data.
Finally, we asked participants to provide basic demographic information. Further information about sentence selection and the Qualtrics system can be found in the online supplementary material on Github (https://github.com/jonathanrgoodman/accents-2). All recordings from phases 1A–1C were edited using Apple software (iMovie) to eliminate background noise and normalize volumes.
We attempted to recruit individuals to phase 1 through university listservs in the UK and Ireland, and through traditional media, including local newspapers and radio. Participants were able to participate digitally only; each participant completed a written or digital consent form and had a chance to receive one of seven available Amazon gift cards. All Qualtrics surveys in phase 1 were e-mail-invite only.
Phase 2 design and recruitment
In phase 2, we aimed to recruit a larger group of participants from the UK and Ireland, regardless of which accent they spoke naturally (our target accrual was 1000 individuals). Participants could participate only on an open Qualtrics survey that prevented multiple accesses from the same IP address.
Each participant was asked for basic demographic data, including whether they spoke in any of our accents of interest (northeast England, Belfast, Dublin, Bristol, Glasgow, Essex and RP) naturally. If they selected one of these accents, they received the identical task to participants in phase 1C.
If they selected that they did not speak in any of these accents, they received a random sample of 14 (one genuine, one fake for seven accents) recordings, presented in a random order. As in phase 1C, we asked each participant to answer ‘yes’ or ‘no’ about whether each recording was a mimic, and specified the accent being attempted. Scores were recorded in an identical manner to phase 1C, except that the maximum possible score was 14.
We recruited participants through university listservs as well as through Twitter/X (https://www.twitter.com) using a promoted tweet from the corresponding author's Twitter/X account. All participants completed a digital consent form prior to participation. There was no compensation for this task.
Analysis
We initially analysed phases 1 and 2 separately. For each phase, we calculated the Jeffreys interval of the overall probability of a correct response. We then fitted Bayesian hierarchical models, using participant and stimulus as random-level effects, to determine whether individuals were, by region, better than chance at detecting mimics.
Next, we amalgamated data from both phases and fitted a further Bayesian hierarchical model to determine whether:
• individuals were better than chance at detecting mimics overall (H1);
• whether an individual who spoke naturally in a target accent was better at mimicry detection than was an individual not from that region (H2); and
• whether the likelihood of a correct response differed by accent-region.
We completed these statistical analyses and visualisations using the R statistical computing language (R Core Team 2021) using the brms (Bürkner et al., Reference Bürkner, Gabry, Weber, Johnson, Modrak, Badr and Mills2022), tidyr (Wickham et al., Reference Wickham and Girlich2022), ggplot2 (Wickham, Reference Wickham2016) and ggridges (Wilke, Reference Wilke2021) packages. R scripts are available on the study's Github page. All models included slopes for random effects.
Results
Phase 1
Participants
While our intended accrual was eight participants per seven accents (56 total), 71 people wrote to express interest in participating; 65 completed the consent form and 61 completed phase 1A; 51 and 55 completed phases 1B and 1C, respectively. As we faced low accrual initially, and were concerned about losing participants to follow-up, we did not limit enrolment to eight individuals per accent. Participants confirmed that they spoke in the relevant accent of interest; we separately confirmed this when listening to phase 1A recordings. Before moving to phase 1B, we ensured we had at least six usable recordings from unique participants (three for each sex) for each accent.
Of participants who completed phase 1C, 33 and 22 participants identified as female and male sex, respectively; see Table 1 for further demographic data. Participants who did not complete any of the phases were removed from the database; in four cases, participants did not complete phase 1B but did complete phase 1C, and their data were included in the analysis.
Demographic data for participants included in phase 1C (F = female; M = male)

Analysis
The total number of responses to the mimicry detection task in phase 1C was 618, of which 424 (68.61%) answers were correct; this corresponded to an overall 95% Jeffrey's probability interval (PI) of 63.24–72.20%, indicating a better-than-chance ability to detect mimics in the overall phase 1 cohort.
To determine the probability of correctly detecting mimics by participant accent–group, we fitted a Bayesian hierarchical model using Markov Chain Monte Carlo sampling. The model's formula, priors, and other details are provided in Table 2 (Model 1); further data are available in the online supplementary material. Individuals speaking in accents from cities located further north in the UK and Ireland had higher probabilities of a correct response than did individuals from cities in the south (Figures 2 and 3).
Summary of Markov Chain Monte Carlo model (phase 1)

Probability intervals for correctly identifying mimics and non-mimics by listener region; individuals heard only the target accent with which they identified speakers (see Methods).

Probability intervals for correctly identifying mimics and non-mimics by listener region from phase 1; individuals heard only the target accent with which they identified speakers (see Methods). Individuals from areas further north in the UK and Ireland performed better at task phase 1C (identifying mimics and non-mimics of their home target accents) than did individuals from areas in the south of the UK. A, Belfast; B, Bristol; C, Dublin; D, Essex; E, Glasgow; F, northeast England; G, London (the city with the most received pronunciation speakers in the UK).

Phase 2
Participants
Of 1709 participants who visited the Qualtrics-hosted study, 990 completed the online consent form; the basic demographic data are given in Table 3. All participants verified they were from the UK or Ireland. Forty-nine participants did not respond to the question regarding their natural accent and seven did not respond to any accent-mimicry question; this left 934 participants for the overall phase 2 analysis.
Participant demographics for phase 2

Analysis
The total number of responses to the mimicry detection task in phase 2 was 11,672, of which 7189 (61.59%) answers were correct; this corresponded to an overall 95% probability interval of correctly identifying a mimic or non-mimic of 60.32–62.47%, a finding comparable with that seen with the smaller sample size of phase 1.
As with the initial dataset from phase 1C, we fitted a Bayesian hierarchical model using Markov Chain Monte Carlo sampling to the phase 2 data. Here, we investigated whether participants from phase 2 who spoke naturally in the same accent as that given in the target stimulus were stronger at mimicry detection than were others. The posterior probability intervals suggested that this was the case (no study accent, 57.17–66.26%; study accent, 65.03–76.26%; difference, −13.49 to −4.54%; Figure 4). The model's formula, priors, PIs and other details are provided in Table 4 (Model 2).
Probability of correct response in phase 2 by whether participants who spoke naturally in one of our seven study accents (Belfast, Bristol, Dublin, Essex, Glasgow, northeast England and received pronunciation) were, overall, better at the task than were participants who did not speak naturally in one of these accents. The posterior probability intervals suggested that this was the case (no study accent, 57.17–66.26%; study accent, 65.03–76.26%; difference, −13.49 to −4.54%).

Model from the phase 2 dataset (see main text)

Phases 1C and 2 (combined)
Next, we amalgamated responses from phases 1C and 2. Given the experimental setting was identical between the two phases, we combined the data into a single data frame rather than conducting a meta-analysis of the two phases.
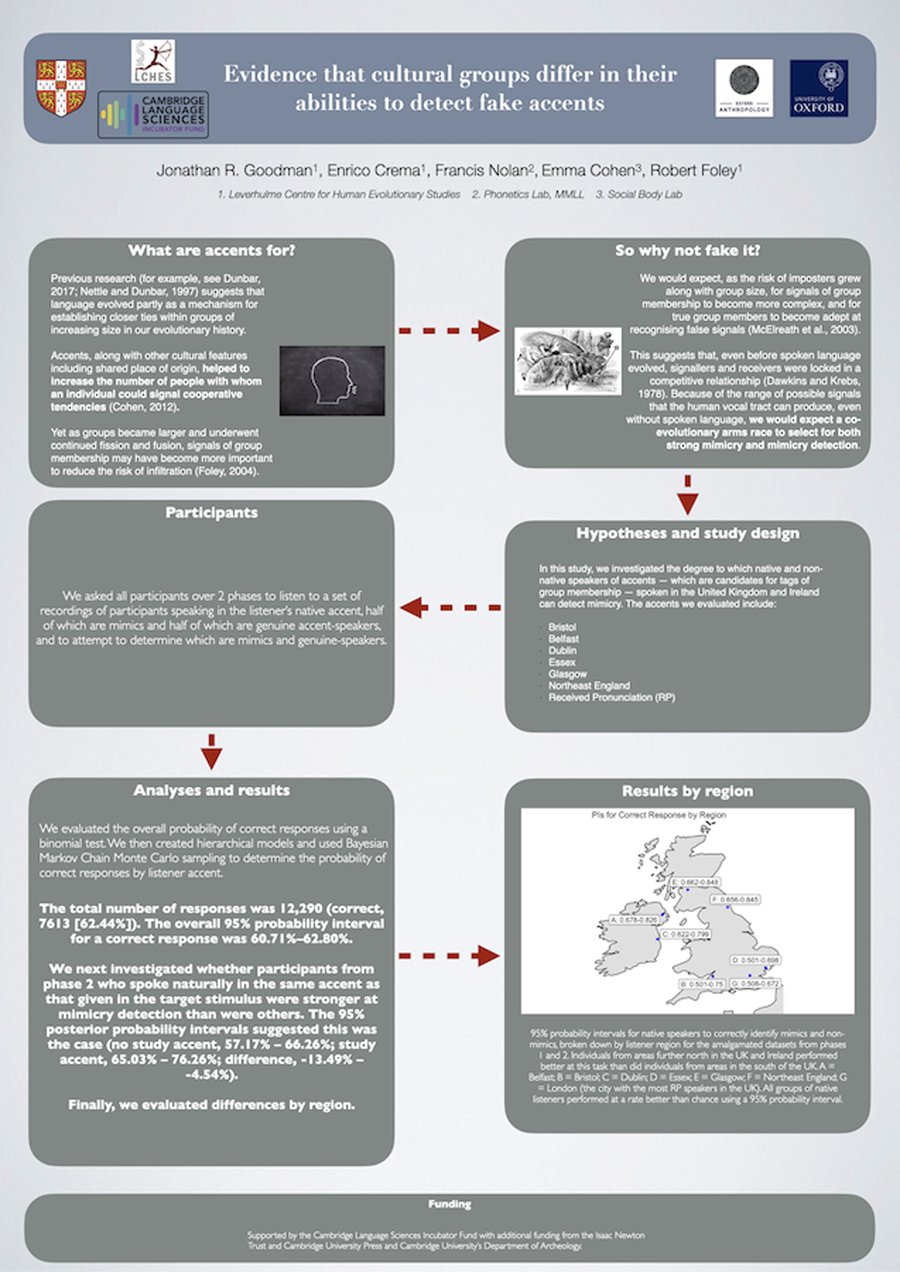
The total number of responses was 12,290 (correct, 7613 (62.44%)). The overall 95% probability interval for a correct response was 60.71–62.80%. We fitted models to investigate the overall difference in probability of a correct answer by whether the listener spoke naturally in a study accent (Model 3) and then investigated these results by region (Model 3.1). The findings from Model 3 confirmed those of Model 2 (Figure 5); Model 3.1 suggested variation between our areas of interest. See the probability interval details in Figures 6 and 7 and in Table 5; the models’ formulae, priors and other details are provided in Table 6 and in the online supplementary material. Three accents of interest – Dublin, Glasgow and northeast England – showed a non-zero difference between natural speakers and non-natural speakers in the likelihood of detecting mimics and non-mimics. Importantly, furthermore, all native listener groups performed better than chance using a 95% probability interval; this was not true of all non-native listener groups.
Probability of correct response (using amalgamated data from phases 1C and 2) by whether participants who spoke naturally in one of our seven study accents (Belfast, Bristol, Dublin, Essex, Glasgow, northeast England and received pronunciation) were, overall, better at the task than were participants who did not speak naturally in one of these accents. The posterior probability intervals suggested that this was the case (no study accent, 56.11–65.36%; study accent, 62.46–73.34%; difference, −12.13 to −2.17%).

Probability of correct response by region and by whether listeners spoke naturally in the accent of interest. Red, participant did not speak naturally in the relevant accent as given on the y-axis; blue, participant spoke naturally in the relevant accent.

The 95% probability intervals for native speakers to correctly identify mimics and non-mimics, broken down by listener region for the amalgamated datasets from phases 1 and 2. Individuals from areas further north in the UK and Ireland performed better at this task than did individuals from areas in the south of the UK. A, Belfast; B, Bristol; C, Dublin; D, Essex; E, Glasgow; F, northeast England; G, London (the city with the most received pronunciation speakers in the UK). All groups of native listeners performed at a rate better than chance using a 95% probability interval.

Probability intervals (PIs) for a correct response by whether individuals spoke in a study accent, broken down by accent group (the left-most column indicates the difference). All groups of native listeners performed at a rate better than chance using a 95% probability interval

Models from amalgamated dataset (see main text)

Discussion
In the present set of studies, we found that: (a) participants from phases 1 and 2 were, across groups, better than chance at detecting accent mimicry, supporting H1; (b) participants who spoke natively in the mimicry target accent were better than non-natives at detecting mimicry, supporting H2; and (c) that there was substantial heterogeneity in detecting mimics among groups. Overall, while mimicry detection was greater than chance across groups, we saw high variance based on participant qualities, including the native accent group and whether listeners spoke natively in the target accent of mimicry. Native listeners were consistently better than chance at detecting mimics across groups; this was not true among non-native listeners.
Unlike with previous research into free rider detection, which has looked into laughter (Bryant & Aktipis, Reference Bryant and Aktipis2014), lying (Fonseca & Peters, Reference Fonseca and Peters2021) and cooperative intent (Verplaetse et al., Reference Verplaetse, Vanneste and Braeckman2007), and which moreover found comparable overall rates of detection (~60–70%), we evaluated detection quality differences by group, and found substantial intergroup variance. This suggests that cheating detection is context dependent, and may be the result of ethnification processes and cultural transmission.
The view that accents evolved as signals to better allow phenotypic matching – whether for kinship recognition (see Cohen, Reference Cohen2012), to determine likelihood of cooperative intent (Verplaetse et al., Reference Verplaetse, Vanneste and Braeckman2007) or to determine social identity (Smaldino, Reference Smaldino2019; Pietraszewski & Schwartz, Reference Pietraszewski and Schwartz2014a, Reference Pietraszewski and Schwartzb) – cannot, we suggest, alone explain the variation in intergroup mimicry detection we find here. It is possible, for example, that in our ancient history, accents evolved as signals indicating kinship, much as other forms of phenotypic matching may serve as signals of shared ancestry (Lieberman et al., Reference Lieberman, Tooby and Cosmides2007). It is likely that while stochastic drift played a role in changes in linguistic traits associated with accents as groups lived separately over time, accents underwent ritualization (see Tinbergen, Reference Tinbergen1952) as individuals who used these cues for phenotypic matching gained inclusive fitness benefits through reciprocal cooperative preferences (Humphrey, Reference Humphrey1997). Given previous work suggesting that groups reproducing in isolation are likely to have a higher than total population average genetic relationship (Lehmann et al., Reference Lehmann, Keller, West and Roze2007), the inclusive fitness benefits of phenotypic matching through accent detection are likely to be non-zero.
As with any evolutionary model where social gains are possible through signalling, free riding presents a problem that only effective detection may solve (Goodman & Ewald, Reference Goodman and Ewald2021; for a model, see Goodman, Reference Goodman2023). This general kinship detection model, while providing a plausible ultimate explanation for the view that accents are signals, does not make any prediction about intergroup or intercultural variation in cheater detection. We suggest that sociocultural factors explain this set of findings, and that detection may allow for frequency-dependent free-riding (see Sperber & Baumard, Reference Sperber and Baumard2012), which will vary by local cultural norms and boundaries.
Our finding that there was heterogeneity in detection rates among groups may provide evidence in favour of this view. Timur Kuran (Reference Kuran1998) gave a model suggesting that, in terms of ethnic norms, an individual's utility function is determined largely by reputational concerns. Norms that are not associated with ethnicity (for example, wearing a homespun, cheap hat) can undergo ethnification insofar as the norm becomes associated with an ethnic group – and further, members of the ethnic group, because of sociocultural reasons, begin to place emphasis on practising ethnicity-specific norms. Kuran notes, for example, that towards the end of British rule in India, homespun hats worn by Hindus became known as ‘Gandhi caps’; Muslims, in contrast, began to place cultural emphasis on wearing fur hats. While hat choices, prior to the ethnoreligious divides that became pervasive in India during this period, were once indicative only of what a person could afford, the tensions between India's two largest ethnoreligious groups created individual-level pressures to practice these norms as ethnic signals. Individuals who did not change their practices to identify with the norms of their ethnoreligious group suffered potential reputational damage – creating a cascade effect that more closely linked hat-wearing and group-level tensions and biases.
We suggest that an analogous phenomenon may explain the intergroup variance in mimicry detection noted in our models. Sociocultural events, such as between-group competition, may cause cultural selection processes to speed up (Henrich & Muthukrishna, Reference Henrich and Muthukrishna2021), forcing a greater focus on detecting out-group members (Goodman et al., Reference Goodman, Caines and Foley2023). Even if functional selection and stochastic drift (Nettle, Reference Nettle1999) lead to greater differences between groups in linguistic traits, increasing animosity and social boundaries may not only speed up such change through social selection, but also place greater emphasis on both manifesting and detecting culturally relevant norms at the individual level (see Labov, Reference Labov1963; Giles, Reference Bourhis, Giles and Giles1977; and Chambers, Reference Chambers1995 for examples of changes in accent-manifestation because of between-group animosity). Implicit to Kuran's model is recognition by individuals of Gandhi caps as ethnoreligious signals informing as to personal bias; accents, similarly, may become of increasing social importance insofar as the identities they signal have consequences for speaker and listener. Similar contextualization is critical in multi-linguistic settings where accents are less important signals of social identity (Cohen & Haun, Reference Cohen and Haun2013). The ethnification of accents may be a consequence of between-group forces imposing cultural selection on both linguistic traits and their recognition – a cultural form of the ritualization of cues described by Tinbergen (Reference Tinbergen1952).
The accents of speakers from Belfast, Glasgow, Dublin and northeast England have culturally evolved over the past several centuries, during which time there have been multiple cases of between-group cultural tension, especially with the cultural group making up southeast England, particularly London. The ethnification processes described by Kuran, and which may be described in the language of cultural evolutionary pressures, probably caused individuals from areas in Ireland and the northern regions of the UK to place emphasis on their accents as signals of social identity. Greater social cohesion among accent speakers may have increased the risks posed by free riders from other groups, necessitating improved accent recognition and mimicry detection – characteristics probably not needed by individuals without strong cultural group boundaries, such as those living in London. (We give a rudimentary analysis evaluating whether ethnic diversity in a region predicts success in our experimental task in Supplement Section 2. Our findings are inconclusive but warrant further study.)
This narrative both predicts better mimicry detection among speakers from places with high-between group tension, such as Belfast, Glasgow and Dublin, and explains why an area like Essex may also have relatively poor mimicry detection. Specifically, speakers of the Essex accent moved to this area over the past 25 years from London (see Watt et al., Reference Watt, Millington, Huq, Watt and Smets2014) – a strong contrast with speakers living in Belfast, Glasgow and Dublin, whose accents evolved over centuries of cultural tension and violence.
Together, these findings lend preliminary support to a model that increases accent recognition and mimicry detection pressures in accordance with cultural evolutionary processes, specifically between-group tension (see Boyd & Richerson, Reference Boyd and Richerson1998). Rather than assume interindividual variance in cheater detection with a mean rate of 66%, we should view recognition and mimicry detection as functions of sociocultural processes that wax and wane in pressure in accordance with ethnification. A formal model accounting for similar terms to those of Kuran (Reference Kuran1998) would explain not only the intergroup variance we find here, but also the differences in the culturally significant accent-signals that make recognition and mimicry detection more likely. Cultural evolutionary processes, based on intergroup relationships, will in our view, select for both linguistic traits likely to differentiate ethnic or cultural groups and cultural learning processes allowing better recognition of signal mimicry.
Finally, we suggest that this set of findings lends support to Nolan's (Reference Nolan2012) view that native accent-speakers are likely to be better than non-natives at recognizing natural accents and determining when a speaker is faking a relevant target accent. Hoskin and Foulkes (forthcoming; personal communication) showed, relatedly, that native Syrian individuals and native Syrian linguists are highly effective at determining speaker authenticity in linguistic tests for asylum (recognition rates ~90–100%). Both non-Syrian native speaker non-linguists and non-Syrian linguists, in contrast, had correct rejection rates of ~85–88%. Our results, which are based on shorter sentences than are linguistic tests such as the Language Analysis for the Determination of Origin, which is used in the UK for asylum, suggest, following Nolan (Reference Nolan2012), that native accent-speakers are likely to be stronger at mimicry detection than are others. Coupled with Hoskin and Foulkes's findings, it follows that native speakers ought to be used in asylum tests – a suggestion that should be explored in future research into mimicry of linguistic signals.
Our study has several limitations that may be addressed in future experiments. For example, we conducted our studies only using participants from the UK and Ireland, and specifically using only seven accents from these countries. Moreover, some features of the accents we chose may have affected our findings, such as how familiar listeners and speakers were with some of the chosen accents, such as RP. Similarly, heterogeneity within accent groups, such as northeast England, may have affected our findings. Finally, our sub-group sample sizes, particularly for some native-speaker groups like Bristol, prevents our testing for interactions between whether a listener is a native speaker and region.
While these limitations prevent broad generalization of the model we are advocating here, future studies may explore these aspects further, such as whether our findings apply to other cultural groups in other regions who speak different languages, and whether our findings hold in a follow-up experiment with a larger sample size. We believe, however, that research in the US (Tate, Reference Tate1979) and into asylum tests of individuals from Syria (Hoskin and Foulkes, forthcoming) – the latter of which explored a fuller diagnostic test than the short recognition test performed here – points to broad support for our general findings.
We also suggest that future experiments account for how individual biases evolve based on signals of social identity in response to changing group relationships. While previous research has established that such signals drive preferential treatment (Kinzler, Reference Kinzler2021), and even the perception of veracity (Lev-Ari & Keysar, Reference Lev-Ari and Keysar2010), it is unknown, following the model we espouse here, whether evolving relationships between groups, and the consequent ethnification of group-level signals, directly affect interpersonal treatment. We suggest that economic games are used to explore this further.
Supplementary material
To view supplementary material for this article, please visit https://doi.org/10.1017/ehs.2024.36
Acknowledgements
The authors are grateful to Daniel Nettle, Nik Chaudhary and two anonymous reviewers for helpful comments on previous drafts of this paper.
Author contributions
JRG, EC2, RAF and FJN designed the study, JRG conducted the experiments and ran the analyses with support from EC1. JRG wrote the manuscript, and all authors aided in manuscript edits.
Financial support
This work was supported by the Cambridge Language Sciences Incubator Fund with further support from the Isaac Newton Trust and Cambridge University Press and Assessment; we are also grateful for support from Cambridge University's Department of Archaeology.
Conflicts of interest
We have no relevant conflicts to disclose.
Research transparency and reproducibility/data availability
All information about the study's design and protocols, as well as the data and analyses associated with this research are available at https://github.com/jonathanrgoodman/accents-2.


 Open access