

Local experiences of lack of resources in services for people with learning disabilities, coupled with expanding population size, have caused concern over whether this reflects a nationwide problem. The importance of equity in mental health services (Reference AchesonAcheson, 1998) is clear. Recent work has looked at allocation processes for mental health care and learning disability services (Reference GloverGlover, 1999; Reference Bindman, Glover and GoldbergBindman et al, 2000). Literature searches reveal no previous work investigating health authority spending on learning disability services or its reflection on population distribution. This seems pertinent, given widespread demographic changes following asylum closures and introduction of community services. While long-stay hospital placements have reduced, residential provision has rapidly expanded.
Specialist residential care provision in some regions has allowed people with learning disabilities to be funded by their local social services to reside ‘out of area’ if similar local provision is not possible. If there are ongoing mental health needs, these should theoretically be funded by payment from the original health authority to the ‘out of area’ health authority through a service level agreement. This should compensate for any extra burden on health services in ‘receiver’ areas. We suspect that this often does not happen.
Allocation formulas do not address the specific needs of the population with learning disabilities. Inherent difficulties in fair allocations and the need for better research are well recognised (Reference Judge and MaysJudge & Mays, 1994). We tackle this complex issue by ascertaining the correlation between health authority spending and the overall burden on learning disability services regionally.
METHOD
Expenditure on learning disability
Data collated from the National Audit Commission gave figures for the total expenditure on adult learning disability services reported by each health authority in England for the year 1998-1999. Crude population figures were collated to allow prevalence estimates. Weighted population figures (accounting for differences in age and local market forces) were not used, as their calculation takes no account of differances in the learning disability population. Figures for some geographically divided areas were combined. This enabled accurate comparison with residential data provided by services given only for the larger region (e.g. North and South Essex data were combined to give a figure for Essex). Figures excluded expenditure on forensic and child learning disability services.
Calculation of the total burden
This calculation aimed to ascertain the total number of adults with learning disabilities residing within each health authority area. The relative levels of specialist service need and socio-economic or demographic variables were not addressed.
Data were obtained from the community care statistics published by the Department of Health (Reference Kilby2000), for all adults aged 18 years and over with learning disabilities. This total gave the number of adults with learning disabilities in registered homes; these included residential, dual-registered (although excluding general adult mental health placements), small (three people or fewer), voluntary, private, local authority social-service-funded and nursing home establishments. Figures were verified by approaching three health authorities directly and comparing these totals with the lists of individual establishments. Hospital and prison populations were excluded. In addition, Department of Health information was used to obtain the numbers of adults with learning disabilities helped to live at home (Department of Health, 1999a ). This included those accessing any form of help from social or health services such as welfare benefits, but specifically excluded people in residential care, to prevent double counting. These figures were added to give the total burden: the approximate number of all adults with learning disabilities resident in that region. An estimate of the prevalence of learning disabilities was calculated by expressing the total burden as a percentage of crude population figures.
Calculation of the spend/burden ratio
The total expenditure on learning disability services for each health authority was divided by the total burden for the same region to give a spend/burden ratio, a tool devised for the purpose of this research. Expressed as a formula, this is
giving a spend/burden ratio in £000 per person with learning disability.
As the data were not normally distributed, we calculated the median value of the ratios to prevent results skew by extremes. The ratios of the individual health authorities were compared with this figure; a ratio significantly less than the median value suggests comparative underspending.
Confounding factors
Potential confounding factors that might have influenced results were associated with the following factors.
-
(a) Long-stay hospital data showing bed occupancy by adults with learning disabilities in 1998-1999 (Department of Health, 1999c ) were used. These beds are the remaining old asylum placements, so are home for those who occupy them, although funded by health providers. These people would therefore not show up in our burden calculations.
-
(b) The Office for National Statistics area classification groups health authorities into similar regional types based on a range of demographic and socio-economic census variables (Reference Bailey, Charlton and DollamoreBailey et al, 1999). These include, for example, ‘coalfields’, ‘resort and retirement’, ‘growth areas’ and ‘ports and industry’.
-
(c) Data showing the number of residential placements funded by local authority social services (Reference KilbyDepartment of Health, 2000) were expressed as a percentage of all local residential placements. The placements are reassigned to the original social service region, even if the individual is living in another area. If local authorities are funding residential care for more people than there are local placements (i.e. a figure over 100%), the people concerned must be residing ‘out of area’ and there is a net export.
Spearman's rank correlation was used to assess positive or negative correlation between the spend/burden ratio and long-stay data, comparator grouping, or percentage of local-authority-funded placements.
RESULTS
A database was set up to compare all the collated data (Table 1). Five out of 100 health authorities were excluded owing to lack of residential figures: Morecambe Bay, East Kent, West Kent, West Pennine and North West Anglia. Some geographically close health authorities were amalgamated to account for the combination of social services and Audit Commission data (e.g. North and South Staffordshire; North and South Essex). In total, 84 regions were included in the database. The suggested prevalence of learning disability ranged from 0.1 to 0.49%.
Learning disability services expenditure and residential burden across English health authorities, 1998-1999

| Health authority | Total expenditure on learning disability services (£000) | Crude population (n) | Total burden1 (n) | Prevalence of learning disabilities2 (%) | Average number of adults in long-stay occupied beds (n) | Percentage of placements funded by local authority social services3 (%) | Spend/burden ratio (£000 per person with learning disability) |
|---|---|---|---|---|---|---|---|
| Lincolnshire | 12 869 | 623 130 | 3038 | 0.49 | 26 | 33 | 4.23 |
| Herefordshire | 2864 | 167 920 | 649 | 0.39 | 8 | 20 | 4.41 |
| Gloucestershire | 11 355 | 557 257 | 2488 | 0.45 | 77 | 32 | 4.56 |
| Somerset | 10 367 | 489 280 | 2105 | 0.43 | 8 | 45 | 4.92 |
| Isle of Wight | 3209 | 126 989 | 601 | 0.47 | 10 | 13 | 5.34 |
| Co. Durham | 9620 | 607 770 | 1798 | 0.30 | 55 | 21 | 5.35 |
| N. Yorkshire | 13 253 | 742 404 | 2428 | 0.35 | 73 | 42 | 5.46 |
| Salford & Trafford | 11 400 | 446 222 | 1962 | 0.42 | 0 | 67 | 5.81 |
| Shropshire | 8596 | 430 212 | 1441 | 0.33 | 7 | 49 | 5.97 |
| Gateshead & S. Tyneside | 10 860 | 353 466 | 1754 | 0.50 | 48 | 39 | 6.19 |
| St Helens & Knowsley | 5126 | 333 002 | 823 | 0.25 | 0 | 35 | 6.22 |
| Manchester | 9389 | 429 812 | 1490 | 0.36 | 0 | 154 | 6.30 |
| Wirral | 8110 | 327 145 | 1256 | 0.38 | 0 | 42 | 6.45 |
| Leicestershire | 21 114 | 928 716 | 3180 | 0.34 | 94 | 40 | 6.60 |
| E. Norfolk | 15 035 | 628 094 | 2266 | 0.36 | 192 | 43 | 6.64 |
| North Nottinghamshire | 9905 | 388 889 | 1471 | 0.38 | 6 | 33 | 6.73 |
| Cambridge & Huntingdon | 11 201 | 467 980 | 1618 | 0.35 | 2 | 55 | 6.92 |
| Sefton | 7352 | 287 743 | 1062 | 0.37 | 0 | 26 | 6.92 |
| S., W., N. & E. Devon | 25 656 | 1 068 388 | 3661 | 0.34 | 9 | 29 | 7.01 |
| N. Cumbria | 8494 | 319 255 | 1165 | 0.36 | 10 | 31 | 7.29 |
| Calderdale & Kirklees | 9797 | 583 774 | 1342 | 0.23 | 0 | 42 | 7.30 |
| Coventry | 5307 | 304 334 | 717 | 0.24 | 0 | 54 | 7.40 |
| E. Sussex, Brighton & Hove | 17 461 | 747 183 | 2265 | 0.30 | 13 | 34 | 7.70 |
| Barnsley | 3648 | 228 103 | 456 | 0.20 | 0 | 211 | 8.00 |
| Rotherham | 5546 | 254 424 | 669 | 0.26 | 50 | 49 | 8.30 |
| Redbridge & Waltham Forest | 14 147 | 453 316 | 1631 | 0.36 | 10 | 119 | 8.67 |
| Northumberland | 9342 | 309 642 | 1072 | 0.35 | 147 | 49 | 8.71 |
| Dorset | 10 692 | 691 215 | 1224 | 0.17 | 192 | 61 | 8.74 |
| Northamptonshire | 14 658 | 615 796 | 1660 | 0.27 | 97 | 53 | 8.83 |
| Dudley | 6321 | 311 468 | 732 | 0.24 | 46 | 30 | 8.84 |
| Cornwall & Isles of Scilly | 12 075 | 490 370 | 1359 | 0.28 | 0 | 32 | 8.89 |
| Enfield & Haringey | 9647 | 486 441 | 1056 | 0.22 | 0 | 102 | 9.14 |
| N. & S. Derbyshire | 24 140 | 937 649 | 2608 | 0.28 | 152 | 41 | 9.26 |
| Wakefield | 6927 | 318 804 | 737 | 0.23 | 85 | 29 | 9.40 |
| Solihull | 5665 | 205 649 | 599 | 0.29 | 0 | 54 | 9.45 |
| Suffolk | 13 461 | 671 095 | 1383 | 0.21 | 0 | 25 | 9.73 |
| Oxfordshire | 16 552 | 616 707 | 1679 | 0.27 | 0 | 90 | 9.86 |
| Leeds | 17 451 | 727 389 | 1758 | 0.24 | 107 | 69 | 9.93 |
| Worcestershire | 19 391 | 538 200 | 1930 | 0.36 | 0 | 44 | 10.05 |
| Bradford | 10 639 | 483 285 | 1057 | 0.22 | 14 | 60 | 10.07 |
| E., S. & NW Lancashire | 38 792 | 1 290 168 | 3839 | 0.30 | 111 | 50 | 10.10 |
| W. Sussex | 17 953 | 751 845 | 1773 | 0.24 | 0 | 71 | 10.13 |
| N. & S. Staffs | 24 134 | 1 061 280 | 2322 | 0.22 | 69 | 47 | 10.39 |
| North, Mid, SE & SW Hampshire | 37 792 | 1 643 958 | 3570 | 0.22 | 132 | 57 | 10.58 |
| Wiltshire | 16 386 | 605 511 | 1519 | 0.25 | 22 | 58 | 10.79 |
| Tees | 16 670 | 556 344 | 1504 | 0.27 | 12 | 63 | 11.08 |
| S. Humberside | 5596 | 308 584 | 498 | 0.16 | 18 | 69 | 11.24 |
| Warwickshire | 13 423 | 506 713 | 1189 | 0.23 | 146 | 35 | 11.29 |
| Barking & Havering | 7238 | 383 888 | 608 | 0.16 | 0 | 107 | 11.90 |
| Wolverhampton | 6679 | 241 623 | 560 | 0.23 | 13 | 47 | 11.93 |
| Buckinghamshire | 13 676 | 681 873 | 1135 | 0.17 | 100 | 67 | 12.05 |
| Walsall | 7347 | 261 170 | 598 | 0.23 | 68 | 62 | 12.29 |
| Liverpool | 13 835 | 461 481 | 1106 | 0.24 | 0 | 45 | 12.51 |
| Hillingdon | 6456 | 251 165 | 516 | 0.21 | 0 | 119 | 12.51 |
| Lambeth, Southwark & Lewisham | 20 314 | 745 240 | 1615 | 0.22 | 0 | 115 | 12.58 |
| Berkshire | 28 713 | 800 180 | 2248 | 0.28 | 9 | 48 | 12.78 |
| Sheffield | 13 678 | 531 141 | 1064 | 0.20 | 6 | 43 | 12.85 |
| Bexley & Greenwich | 11 644 | 432 933 | 901 | 0.21 | 0 | 114 | 12.92 |
| Birmingham | 29 009 | 1 013 431 | 2221 | 0.22 | 144 | 50 | 13.06 |
| Camden & Islington | 6998 | 367 569 | 530 | 0.14 | 0 | 175 | 13.20 |
| Wigan & Bolton | 12 028 | 577 985 | 816 | 0.14 | 0 | 109 | 14.74 |
| N. & S. Essex | 52 423 | 1 605 622 | 3527 | 0.22 | 371 | 15 | 14.86 |
| Brent & Harrow | 14 367 | 464 447 | 922 | 0.20 | 23 | 76 | 15.58 |
| Bedfordshire | 16 283 | 556 628 | 1028 | 0.18 | 0 | 60 | 15.84 |
| Bury & Rochdale | 11 545 | 391 007 | 725 | 0.19 | 0 | 97 | 15.92 |
| E. London & The City | 14 888 | 612 425 | 932 | 0.15 | 5 | 123 | 15.97 |
| Sunderland | 11 305 | 292 307 | 678 | 0.23 | 12 | 78 | 16.67 |
| East Riding | 14 137 | 574 533 | 814 | 0.14 | 0 | 37 | 17.37 |
| Nottingham | 11 375 | 642 698 | 629 | 0.10 | 76 | 37 | 18.08 |
| E, N. & W. Herts | 38 944 | 1 033 616 | 2119 | 0.21 | 6 | 67 | 18.38 |
| Croydon | 13 760 | 338 217 | 738 | 0.22 | 0 | 49 | 18.64 |
| N. & S. Cheshire | 33 090 | 984 280 | 1735 | 0.18 | 6 | 42 | 19.07 |
| Merton, Sutton & Wandsworth | 26 807 | 626 992 | 1334 | 0.21 | 217 | 108 | 20.10 |
| Avon | 44 581 | 999 295 | 2215 | 0.22 | 260 | 33 | 20.13 |
| Kingston & Richmond | 11 574 | 334 032 | 574 | 0.17 | 0 | 69 | 20.16 |
| Newcastle & N. Tyneside | 16 313 | 470 071 | 780 | 0.17 | 0 | 30 | 20.91 |
| Barnet | 11 291 | 331 548 | 533 | 0.16 | 0 | 144 | 21.18 |
| Sandwell | 11 485 | 290 521 | 533 | 0.18 | 23 | 52 | 21.55 |
| E. & W. Surrey | 63 751 | 1 060 541 | 2824 | 0.27 | 493 | 48 | 22.57 |
| Bromley | 8193 | 297 118 | 339 | 0.11 | 0 | 228 | 24.17 |
| Doncaster | 10 965 | 290 468 | 411 | 0.14 | 49 | 29 | 26.70 |
| Ealing, Hammersmith & Hounslow | 24 957 | 671 169 | 896 | 0.13 | 0 | 114 | 27.85 |
| Kensington, Chelsea & Westminster | 9244 | 390 772 | 331 | 0.08 | 0 | 252 | 27.92 |
| Stockport | 7643 | 292 808 | 273 | 0.10 | 0 | 260 | 27.99 |
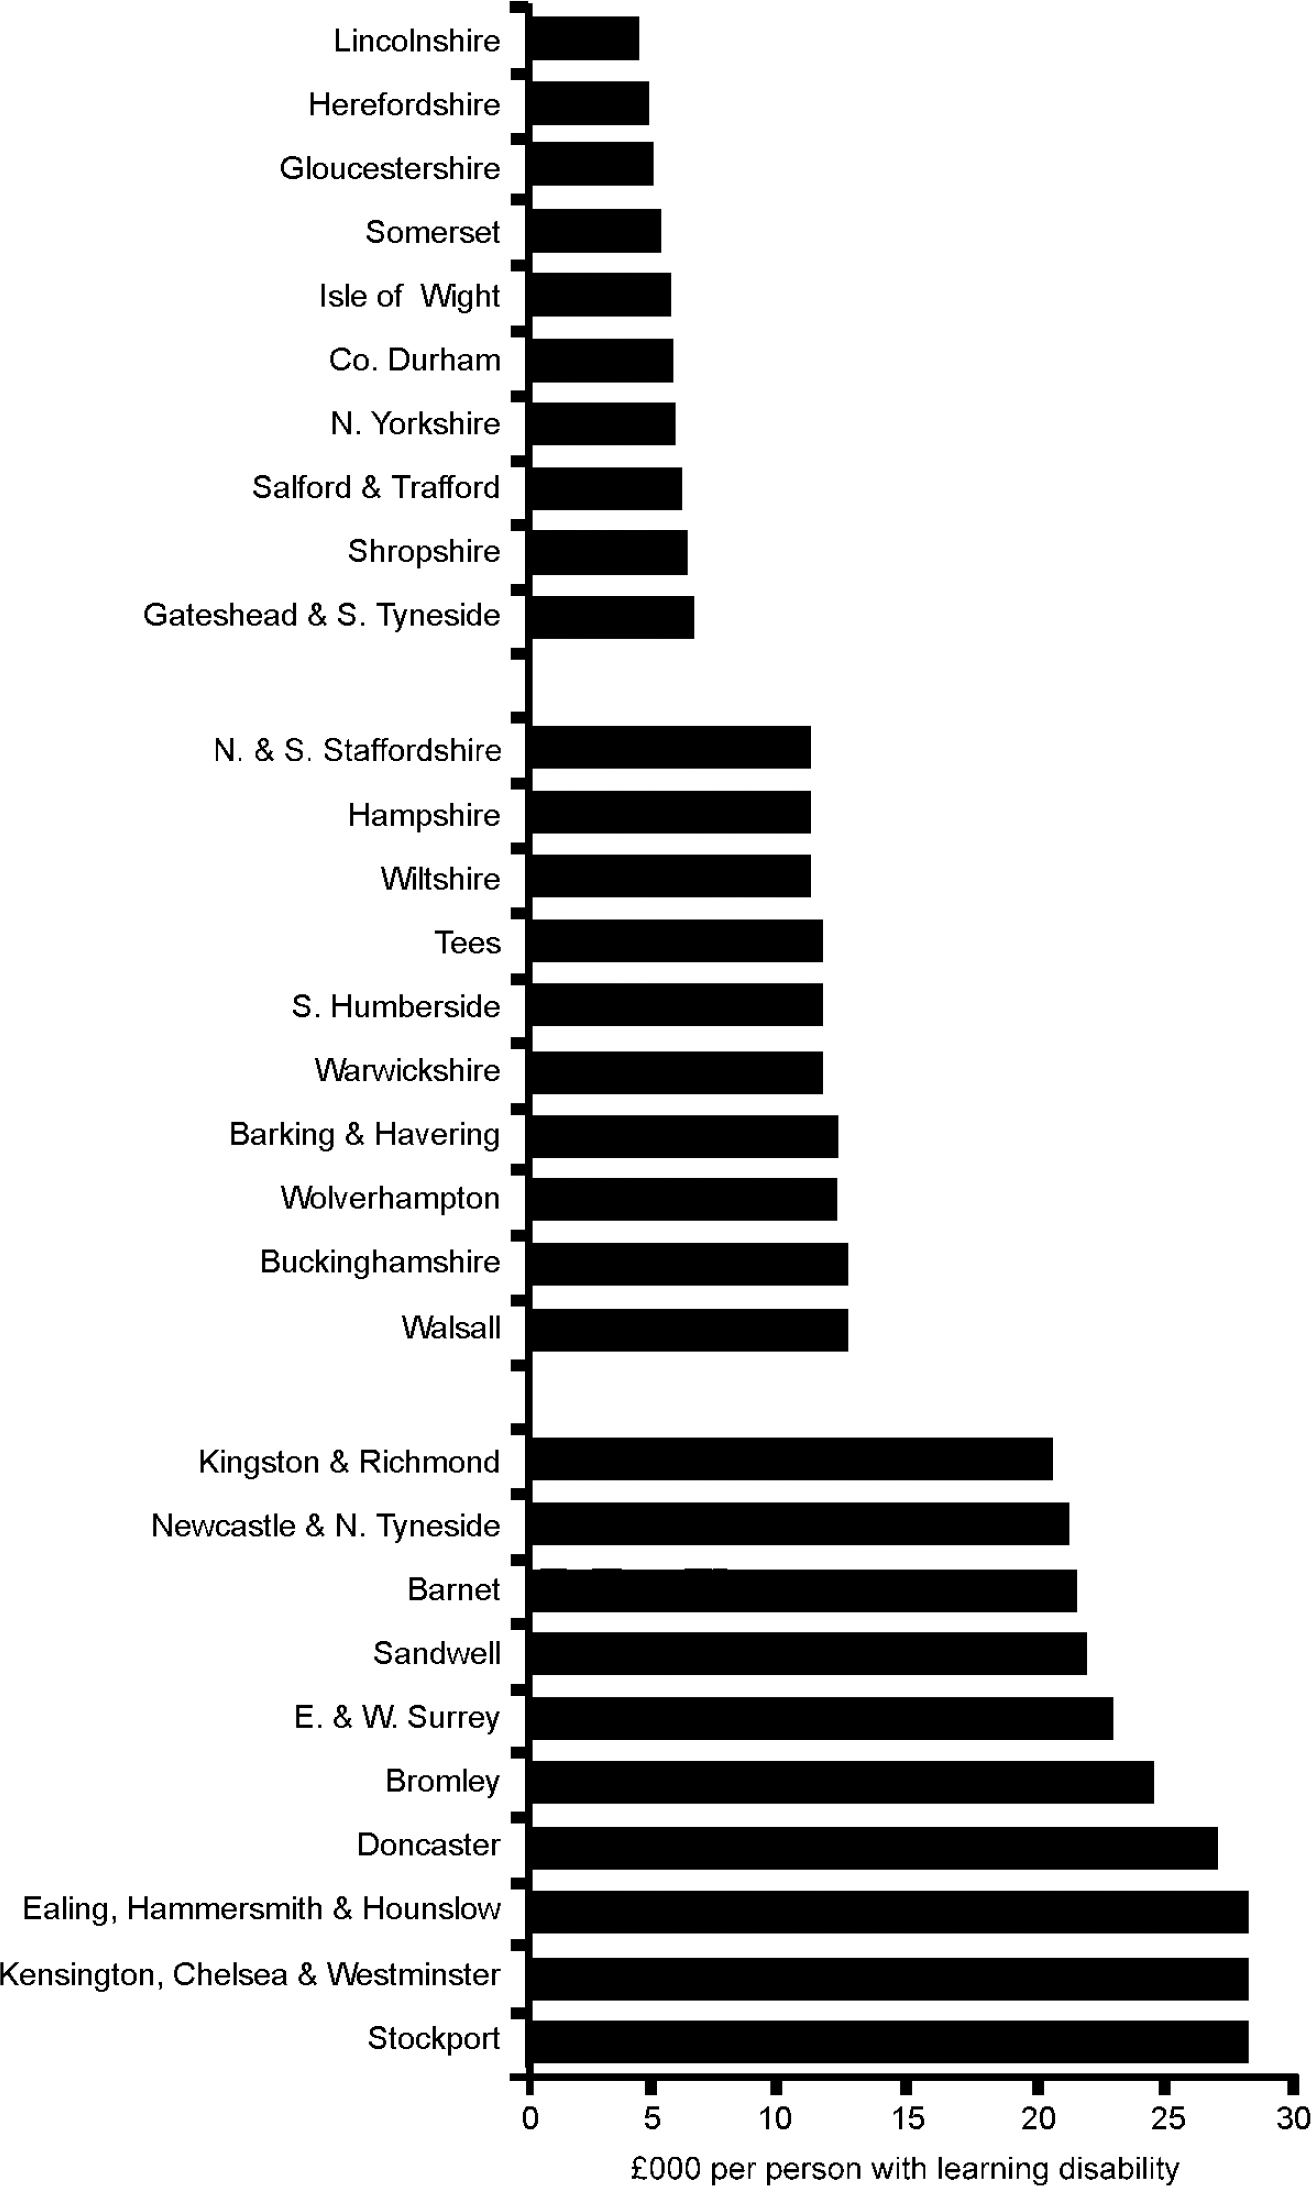
Total health expenditure on learning disability services ranged from £ 2 864 000 (Herefordshire) to £63 751 000 (East and West Surrey). The total burden ranged from 273 (Stockport) to 3839 (Lancashire). The spend/burden ratio varied from 4.23 (Lincolnshire) to 27.99 (Stockport), the median being 10.26 (£000 per person with learning disability). Figure 1 contrasts the ten regions with the highest, middle and lowest rankings.
Spend/burden ratios of the ten highest, middle and lowest ranking English health authorities, 1998-1999.
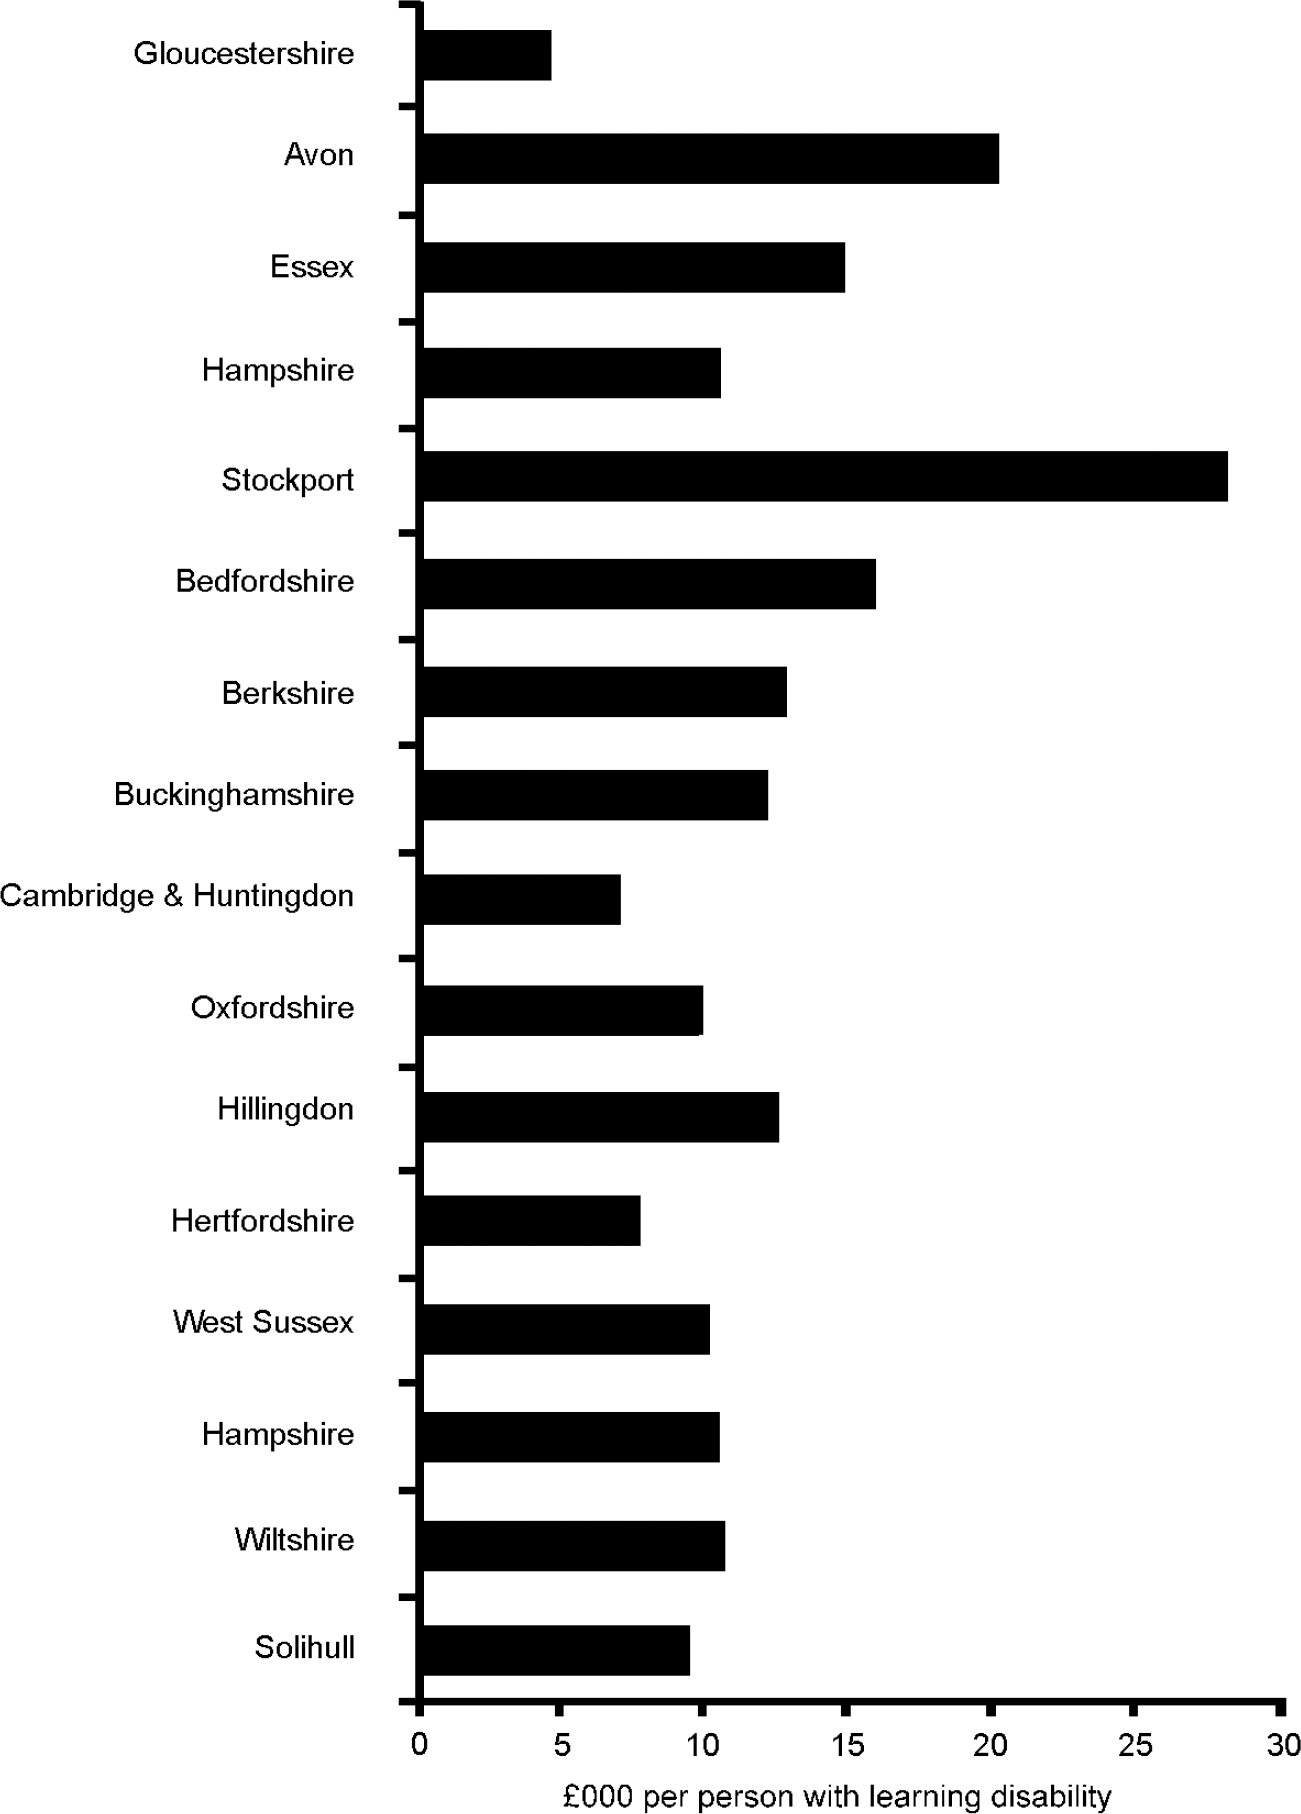
The health authorities were grouped by comparator data, e.g. all regions classified as growth areas. Spend/burden ratios showed no correlation, having randomly high or low values within these groupings (Fig. 2). Health authority spend/burden ratios were then compared with the percentage of local-authority-funded placements. This relationship had a statistically significant positive correlation (Spearman's rank correlation, two-tailed, 0.413, P < 0.001). Net exporters (with values greater than 100%) were seen in increasing numbers as the spend/burden ratio increased. There were none in the ten lowest-ranked authorities, one in the middle-placed and five in the highest-placed regions (Fig. 3). Numbers of long-stay hospital placements (which would not register in other residential figures) showed no correlation with spend/burden ratios (Spearman's rank correlation, two-tailed, -0.113, P=0.31).
Spend/burden ratios of health authorities grouped by Office for National Statistics classification into comparator ‘growth areas’, 1998-1999.
The spend/burden ratios of the highest-, middle- and lowest-ranking health authorities have a positive correlation with the proportion of residential placements that are funded by the local authority (values >100% indicate a net export). Spearman's rank correlation 0.413, P <0.001.

Verification of figures
Verification of the accuracy of Department of Health registrations data was attempted by approaching three health authorities directly, namely South Gloucestershire, Bristol and Hampshire, who provided detailed lists of all residential establishments in their region, together with the population figures for each home. These figures were added together, then divided by the Department of Health figure to express a positive or negative percentage deviation. There was a deviation in numbers of 2.5% (485/473), -5.1% (788/830) and -3.6% (1036/1075) respectively. This suggests a maximum margin of error of 5%.
DISCUSSION
Limitations of the study
Data provision
The figure for expenditure is that given by individual health authorities to the Audit Commission. It does not necessarily translate into direct provision on the ground because of different interpretations of which facilities, staff, resources and administrative costs accurately come under the ‘learning disability’ umbrella. In interpreting the results, therefore, this may be an issue for clinicians to clarify directly if spend figures seem out of step with actual resources.
The data used to calculate the total burden were derived from social services, and there may well be regional differences in the accuracy of the figures obtained. However, there is no other available source of such data at present. We must assume the accuracy of the data collected but there is no independent means of validation.
Excluded categories
A section of the population with learning disability is, by definition, excluded from this study; these are adults with learning disabilities who live at home alone or with their families and do not receive any form of help from health or social services, including welfare benefits. To include this group was beyond the means of this study. A larger group of people with mild learning disabilities (IQ=55-69) living independent lives and not identifying themselves as having disabilities are also excluded.
The IQ test with mean 100 (s.d. 15) is normally distributed in populations, giving a predicted 2.27% of the population falling below IQ=70 (used to define learning disability). However, there is also a small effect below IQ=50 from specific pathological conditions. Some data confirm these figures (Reference Rutter, Tizard and YuleRutter et al, 1976; Reference Szymanski, Kaplan and WeinerSzymanski & Kaplan, 1997). However, the percentages identified in other prevalence studies of 0.3% to 0.65% (Reference FryersFryers, 1993; Reference Van Schrojenstein Lantman-De ValkVan Schrojenstein Lantman-De Valk, 1997) correlate with the figures obtained here, illustrating the difficulty of including all who qualify. Few reliable sources for prevalence estimation exist because of varying selection criteria and case-finding methods, as well as variations in age and in temporal and social factors (Reference Fryers and RussellFryers, 1997).
Financial complexities
Unusual forms of purchasing arrangements can cloud accurate spend figures. There are funds known as ‘Section 28 transfers’, which allow the movement of funds from health authorities to local authorities. These are applied to people who were resident in long-stay hospitals before April 1971. This money follows the individual until movement out of National Health Service (NHS) care or death, and counts against health authority expenditure. Owing to the complexity of care provisions, with different health authorities making different arrangements for the continuing care of former asylum residents, exact expenditure has become difficult to untangle. Other funds, not tied to individuals, may also count against spend; these are now under investigation by the Department of Health.
Further complication may arise from health authorities using ‘health’ funds to provide what is effectively social care, funding which should be provided by social services. Old long-stay beds are an example for which we have accounted, but other residential placements of people with high-level needs may have a percentage of their specialist residential care paid for by the health budget. The definitions for these provisions and standard percentage contributions for such cases may vary across the country, and we have no means of tracking them individually.
Provision for autism and children's services
A further complicating factor is that of provision for children with learning disabilities. Although spend figures are supposed to represent adult expenditure only, there are very different practices across England in how child and adolescent mental health services liaise with learning disability services. In addition, some regions provide services for autistic-spectrum disorder under the learning disability services umbrella, whereas others do not. This could well be mirrored by different financial arrangements allowing for transitional services and dual working.
Differences in spend/burden ratios
There appear to be large discrepancies nationally in the spend/burden ratios, with some health authorities spending far less on services in relation to the number of people with learning disabilities than do others. This study makes no attempt to define adequate levels of spending, merely to make comparisons with a national median. Whether there is national underresourcing, adequate resourcing or even overresourcing, the emerging picture strongly suggests a widespread disparity between health authorities. It is important to remember that high spending does not necessarily equate with effective use of resources, and that lower relative expenditure may represent more efficient and effective services. Although the quality and costs of residential provision for people with learning disabilities have been investigated (Reference Hatton, Emerson and RobertsonHatton et al, 1995; Department of Health, 1999b ), comparison of spending levels with respect to population numbers has not been reviewed.
Regional differences
Clarification of data enabling analysis of confounders such as comparator grouping does not seem to explain the spend/burden ratio discrepancies. However, in looking for regional patterns the results show more rural areas with lower expenditure relative to higher burden.
‘Exporter’ v. ‘receiver’ areas
There is significant correlation between spend/burden ratios and the proportions of placements funded by local authority social services. Given the rarity of privately funded placements, results suggest that lower-ratio health authorities (‘receiver areas’) have more imported placements from other regions. Higher-ratio health authorities are significantly more likely to be net exporters. It is notable that all clear exporter health authorities are smaller, urban regions. It may be that it is the geographical size of the region rather than the urban—rural distinction that increases the likelihood of export, with smaller authorities having fewer internal residential resources. It may be cheaper to build residential facilities in rural areas than in cities, and this too could account for greater use of exports to rural regions. ‘Out of area’ placements are often used where higher levels of specialist services are needed (implying greater health needs). Unless service level agreements are arranged with the receiving health authority, the receiver area funds any future mental health needs. In effect, this can mean that the health burden of such placements is particularly high, this being the experience locally in Gloucestershire. There is an implication that accurate enforcement of service level agreements for all exported people with specialist mental health needs might redress the imbalance of present expenditure patterns. If this is unworkable, overhaul of present allocation methods may be necessary.
Although recent research has looked at the extent of ‘out of area’ admissions to psychiatric beds in general psychiatry (Reference Glover and BindmanGlover & Bindman, 2001), there is no similar research in the learning disability sector, either for hospital or residential ‘out of area’ placements.
Long-stay hospital data
The lack of correlation between numbers of long-stay (asylum) placements and spend/burden ratios is surprising, given that these figures would be an obvious source of discrepancies.
Clinical implications
Effect of asylum closure
The fact that expenditure on learning disability services is not distributed equitably between health authorities mirrors the findings of research into general mental health service expenditure (Reference Bindman, Glover and GoldbergBindman et al, 2000). The noted high level of expenditure on general mental health services in London (Reference Chisholm, Lowin, Knapp, Johnson, Ramsay and ThornicroftChisholm et al, 1997) has been attributed to need greater than that accounted for by the York index (Reference Ramsay, Thornicroft, Johnson, Johnson, Ramsay and ThornicroftRamsay et al, 1997). Whether this translates into spending on learning disabilities services is unknown. Crucially, the movements of this vulnerable population over the past decade as asylums have closed have not been accounted for in a coherent national approach with regard to relative levels of expenditure. This has created ethical dilemmas (Reference GreavesGreaves, 1997).
This study suggests that the export of people out of their home county has not been paralleled by an increase in spending by the receiving counties facing the consequent higher burden. The closure of asylum provision may therefore have occurred at the expense of such receiver areas without adequate follow-through of finances to fund the needed community care.
Political initiatives
The impact of political initiatives on spending is not documented in learning disability research. The formation of ‘health action zones’ in areas such as Stockport and Sandwell may have affected their expenditure. Similarly, some areas have pioneered effective joint working between health and social services, as has been done in Hillingdon, and this may have had a beneficial effect on improving the efficiency and profile of the service area.
The White Paper Valuing People: A New Strategy for Learning Disability for the 21st Century (Department of Health, 2001) sets out proposals for improving the lives of all people with learning disabilities. A new learning disability development fund of £22 million revenue and £20 million capital is being introduced in 2002, to ensure implementation. The observed discrepancies suggest that individual health authorities should address potential inequalities, particularly in the light of future budgetary increases, to ensure that people with learning disabilities are optimally and equitably served.
CLINICAL IMPLICATIONS
-
▪ There are significant financial inequalities in learning disability services across England, which are likely to affect the quality and quantity of clinical care.
-
▪ Receiver areas with more imported placements have lower relative expenditure, so potentially worse health outcomes.
-
▪ Lower spend/burden ratios indicate that clinical provision in rural ‘shire’ areas is likely to be limited compared with urban areas.
LIMITATIONS
-
▪ The study excludes a large group of people with mild learning disabilities.
-
▪ The complexity of different financial arrangements and degrees of provision for children or autism services may cloud expenditure figures.
-
▪ Alternative data sources to verify the accuracy of health and social services statistics are unavailable.
Acknowledgements
We are grateful to Bill Alexander of the National Audit Commission for help in data provision, to Oliver Russell of the Department of Health for data provision and comments, to Chris Foy for statistical advice and to Mark Scheepers and Mhairi Duff for critical appraisal.


eLetters
No eLetters have been published for this article.