


1 Introduction
Social scientists often seek to estimate the causal effects of treatments, such as events or interventions, on various outcomes of interest. Researchers may, for example, investigate the consequences of introducing minimum wage legislation on unemployment, the influence of terrorist attacks on economic growth, or the effect of electoral redistricting on legislative behavior. Typically, making such causal inferences requires the construction of counterfactuals to infer what would have occurred in the absence of the treatment.
An important tool for constructing counterfactuals is the synthetic control (SC) method, “arguably the most important innovation in the policy evaluation literature in the last 15 years” (Athey and Imbens Reference Athey and Imbens2017). This method is designed to provide an accurate representation of the hypothetical outcome for the treated unit without the treatment. It involves combining non-treated units, which, when given appropriate weights, closely resemble the pre-treatment unit. This technique extends the difference-in-difference approach, with the advantage of generating a close match to the unit of interest, even when no single control unit would be appropriate on its own.
However, the SC approach does not account for the potentially different speeds at which units react and adapt to changes. Changes in reactions to an event or a policy may be inelastic or “sticky” and therefore take longer in one unit than in another. Consider the example of public opinion shifts following major policy changes. While some segments of the public may quickly adjust their views in response to new information or policy announcements, showing a “fast” response, while others might take longer to process the new information or for the effects of the policy change to become apparent in their daily lives. More generally, the speed at which $y_{t}$
moves reflects how quickly it mirrors changes in its underlying latent process
$y_{t}$
moves reflects how quickly it mirrors changes in its underlying latent process $z_{t}$
. This speed of reaction to changes may also vary within one unit over time: a previously slow unit may now be fast, and vice versa. In addition, speed may also vary as a function of covariates.Footnote
1
$z_{t}$
. This speed of reaction to changes may also vary within one unit over time: a previously slow unit may now be fast, and vice versa. In addition, speed may also vary as a function of covariates.Footnote
1
Variations in speed—how quickly units react to changes—have important consequences for our ability to make inferences. We may, for example, conclude that a treatment had a large effect on treated unit $\mathbf {y}_{1}$
compared to untreated units
$\mathbf {y}_{1}$
compared to untreated units $\mathbf {y}_{2}$
and
$\mathbf {y}_{2}$
and $\mathbf {y}_{3}$
. However, the observed difference in reaction may simply be due to the fact that
$\mathbf {y}_{3}$
. However, the observed difference in reaction may simply be due to the fact that $\mathbf {y}_{2}$
and
$\mathbf {y}_{2}$
and $\mathbf {y}_{3}$
lag behind
$\mathbf {y}_{3}$
lag behind $\mathbf {y}_{1}$
—there is in fact no treatment effect, and all we observe is
$\mathbf {y}_{1}$
—there is in fact no treatment effect, and all we observe is $\mathbf {y}_{1}$
’s reaction to common shocks (not the treatment) ahead of
$\mathbf {y}_{1}$
’s reaction to common shocks (not the treatment) ahead of $\mathbf {y}_{2}$
and
$\mathbf {y}_{2}$
and $\mathbf {y}_{3}$
. Conversely, we may underestimate the effect on
$\mathbf {y}_{3}$
. Conversely, we may underestimate the effect on $\mathbf {y}_{1}$
if
$\mathbf {y}_{1}$
if $\mathbf {y}_{2}$
reacts faster to these common shocks. Ignoring these differences in speed creates further problems for SCs, as the donorFootnote
2
and the treated units may be out of synchronization, and what appears to be a good pre-treatment match may in fact be due to chance rather than a true alignment. Another problem is that the varying speeds may prevent us from finding a suitable SC at all, as there may be no linear combination of the donors that allows for a close match to the treated unit.
$\mathbf {y}_{2}$
reacts faster to these common shocks. Ignoring these differences in speed creates further problems for SCs, as the donorFootnote
2
and the treated units may be out of synchronization, and what appears to be a good pre-treatment match may in fact be due to chance rather than a true alignment. Another problem is that the varying speeds may prevent us from finding a suitable SC at all, as there may be no linear combination of the donors that allows for a close match to the treated unit.
Different units—states, cities, and people—may adjust and react at varying speeds for many reasons. For instance, legal constraints in one state may slow down the speed at which economic decisions are made compared to other states. Öztekin and Flannery (Reference Öztekin and Flannery2012), for example, find that the speed with which firms adjust their capital structure correlates with legal and financial norms. Additionally, the speed of convergence—the rate at which a country’s per capita income approaches its steady state—has also been shown to vary by country and over time (Barro et al. Reference Barro, Sala-i-Martin, Blanchard and Hall1991; Canarella and Pollard Reference Canarella and Pollard2004; Rappaport Reference Rappaport2000). Similarly, the effect of a policy may be slower to fully manifest itself in one instance than in another. Thus, Alesina, Cohen, and Roubini (Reference Alesina, Cohen and Roubini1992) find that the speed at which the deficit is adjusted in election years may be slower than in other years. Moreover, the impact of a shock on, for example, commodity prices, may be almost instantaneous in some markets but drag on in others.
To demonstrate the significance of these varying speeds for our ability to make inferences, suppose that we aim to estimate the causal effect of a policy on an outcome, for example, the impact of cigarette taxes on consumption or the introduction of a minimum wage on employment. We have artificial data for three units (e.g., states) over time, as illustrated in Figure 1. During the observation period, one of the units ( $\mathbf {y}_{1}$
) receives a treatment, while the other two (
$\mathbf {y}_{1}$
) receives a treatment, while the other two ( $\mathbf {y}_{2}$
and
$\mathbf {y}_{2}$
and $\mathbf {y}_{3}$
) do not, allowing them to be used as potential donor units for counterfactual analysis. However, the researcher is not aware that the true effect of the treatment is zero.Footnote
3
In addition to the treatment, which applies exclusively to
$\mathbf {y}_{3}$
) do not, allowing them to be used as potential donor units for counterfactual analysis. However, the researcher is not aware that the true effect of the treatment is zero.Footnote
3
In addition to the treatment, which applies exclusively to $\mathbf {y}_{1}$
, we also assume that all three units are subject to universal shocks represented by
$\mathbf {y}_{1}$
, we also assume that all three units are subject to universal shocks represented by $\mathbf {z}$
. All units react to
$\mathbf {z}$
. All units react to $\mathbf {z}$
at different speed. As shown in 1,
$\mathbf {z}$
at different speed. As shown in 1, $\mathbf {y}_{2}$
adjusts slowly when y decreases but recovers fast. In contrast,
$\mathbf {y}_{2}$
adjusts slowly when y decreases but recovers fast. In contrast, $\mathbf {y}_{3}$
decreases fast but recovers slowly. Unit
$\mathbf {y}_{3}$
decreases fast but recovers slowly. Unit $\mathbf {y}_{1}$
has a neutral speed.
$\mathbf {y}_{1}$
has a neutral speed.
The challenge of varying speeds. Consider a researcher aiming to quantify the effect of a treatment on unit $\mathbf {y}_{1}$
. Unbeknownst to them, no treatment effect actually exists. Employing conventional synthetic control (SC) methods with donor units
$\mathbf {y}_{1}$
. Unbeknownst to them, no treatment effect actually exists. Employing conventional synthetic control (SC) methods with donor units $\mathbf {y}_{2}$
(slow) and
$\mathbf {y}_{2}$
(slow) and $\mathbf {y}_{3}$
(fast), they obtain a post-treatment estimate (blue curve) that diverges markedly from the true outcome (black curve), leading to a significant bias in the estimated treatment effect. In contrast, dynamic synthetic controls, as elaborated below, produce a SC (red curve) that more closely approximates the truth.
$\mathbf {y}_{3}$
(fast), they obtain a post-treatment estimate (blue curve) that diverges markedly from the true outcome (black curve), leading to a significant bias in the estimated treatment effect. In contrast, dynamic synthetic controls, as elaborated below, produce a SC (red curve) that more closely approximates the truth.

To generate the synthetic unit, the standard SC approach constructs a weighted average of the two available donor units $\mathbf {y}_{2}$
and
$\mathbf {y}_{2}$
and $\mathbf {y}_{3}$
using weights
$\mathbf {y}_{3}$
using weights $\mathbf {w^*} = (w_{\mathbf {y}_{2}}^*, w_{\mathbf {y}_{3}}^*)$
.
$\mathbf {w^*} = (w_{\mathbf {y}_{2}}^*, w_{\mathbf {y}_{3}}^*)$
. $\mathbf {w^*}$
is selected such that the resulting SC, which combines the non-treated units
$\mathbf {w^*}$
is selected such that the resulting SC, which combines the non-treated units $\mathbf {Y}_{-1}$
as
$\mathbf {Y}_{-1}$
as $\mathbf {Y}_{-1}\mathbf {w}^*$
, closely matches the pre-treatment sequence of the treated unit
$\mathbf {Y}_{-1}\mathbf {w}^*$
, closely matches the pre-treatment sequence of the treated unit $\mathbf {y}_{1}$
.Footnote
4
Abadie and Gardeazabal (Reference Abadie and Gardeazabal2003) demonstrate that this approach produces a plausible counterfactual for the treated unit.
$\mathbf {y}_{1}$
.Footnote
4
Abadie and Gardeazabal (Reference Abadie and Gardeazabal2003) demonstrate that this approach produces a plausible counterfactual for the treated unit.
In the example of Figure 1, however, selecting weights that generate a suitable counterfactual is not straightforward. Indeed, even in this simple case, there is no easily obtainable closed-form solution for finding $\mathbf {w}$
. The standard linear approach results in the SC depicted by the blue curve. This curve poorly matches both the pre- and post-treatment unit
$\mathbf {w}$
. The standard linear approach results in the SC depicted by the blue curve. This curve poorly matches both the pre- and post-treatment unit $\mathbf {y}_{1}$
, and leads us to erroneously conclude that a treatment effect exists (the post-treatment difference between the blue and black curves) when, in reality, the true treatment effect is zero. Adding nonlinear terms or lags does not improve the situation much either (see Figure A1 in Supplementary Appendix 2, which incorporates multiple lags and polynomial terms).
$\mathbf {y}_{1}$
, and leads us to erroneously conclude that a treatment effect exists (the post-treatment difference between the blue and black curves) when, in reality, the true treatment effect is zero. Adding nonlinear terms or lags does not improve the situation much either (see Figure A1 in Supplementary Appendix 2, which incorporates multiple lags and polynomial terms).
The approach’s challenge to generate a satisfactory approximation of the treated unit using untreated units stems from the challenge of accounting for varying speeds. In this case, $\mathbf {y}_{2}$
,
$\mathbf {y}_{2}$
, $\mathbf {y}_{3}$
, and
$\mathbf {y}_{3}$
, and $\mathbf {y}_{1}$
all exhibit cycles that unfold at different rates. All three units display the same patterns, but prior to the treatment,
$\mathbf {y}_{1}$
all exhibit cycles that unfold at different rates. All three units display the same patterns, but prior to the treatment, $\mathbf {y}_{2}$
’s cycle is longer (i.e., slower) than
$\mathbf {y}_{2}$
’s cycle is longer (i.e., slower) than $\mathbf {y}_{1}$
’s, and
$\mathbf {y}_{1}$
’s, and $\mathbf {y}_{3}$
is faster than
$\mathbf {y}_{3}$
is faster than $\mathbf {y}_{1}$
. Additionally, the differences in speed fluctuate within each unit over time, so that a single speed adjustment parameter is insufficient. Lastly, variations in speed might depend on unobservable variables or endogenous regressors. Unless we can correctly account for the complex mechanisms and model the speed, the speed difference will cause errors akin to omitted variable bias in SC estimation.Footnote
5
$\mathbf {y}_{1}$
. Additionally, the differences in speed fluctuate within each unit over time, so that a single speed adjustment parameter is insufficient. Lastly, variations in speed might depend on unobservable variables or endogenous regressors. Unless we can correctly account for the complex mechanisms and model the speed, the speed difference will cause errors akin to omitted variable bias in SC estimation.Footnote
5
In this paper, we introduce a new method, dynamic synthetic control (DSC), which accounts for varying speeds within and across units. This approach operates by learning the differences in speed between the series during the pre-treatment period. We do this by calculating a dynamic time warping (DTW) path between them. The warping path subsequently provides a measure of speed differentials across units and over time. We then use this warping path to warp the post-treatment donor units to align their speed with that of the treated unit. As a result, we can assess the treatment effect while controlling for the inherent varying speeds. As an illustration of the method’s capabilities, the red curve in Figure 1 shows the outcome of applying DSC to this simple case. We observe that warping enables us to more closely match the post-treatment unit compared to a standard SC. Importantly, the estimator only removes speed differences that originate from the pre-treatment period; it does not remove speed differences that are caused by the treatment. This, in turn, allows for a more precise inference of the treatment effect’s magnitude.
The remainder of this paper demonstrates that this result extends beyond a simple example. In fact, we show empirically that DSCs serve as a more efficient estimator of the treatment effect compared to standard SCs. We substantiate these findings by replicating leading empirical work in this field and illustrating how the results can be improved using DSC. Additionally, we generalize our results through a Monte Carlo simulation.
2 Synthetic Controls and the Problem of Speed
Many of the questions of interest to social scientists revolve around estimating the effect of treatments such as an event or an intervention (e.g., Becker and Klößner Reference Becker and Klößner2016; Brady and McNulty Reference Brady and McNulty2011; Card and Krueger Reference Card and Krueger2000; Chattopadhyay and Duflo Reference Chattopadhyay and Duflo2004; Di Tella and Schargrodsky Reference Di Tella and Schargrodsky2004). Difference-in-differences, for example, leverages similarities between a treated unit and an untreated one to deduce the treatment’s effect. However, the method potentially suffers from biased control selection and imprecise case similarity—sometimes lacking a suitable comparison altogether.
The SC approach, pioneered by Abadie and Gardeazabal (Reference Abadie and Gardeazabal2003) and refined in Abadie, Diamond, and Hainmueller (Reference Abadie, Diamond and Hainmueller2010, Reference Abadie, Diamond and Hainmueller2015), aims to address such limitations by combining a basket of control cases to mimic the pre-treatment scenario for the treated unit. This enables a more robust counterfactual study of the treatment’s impact (see Abadie Reference Abadie2021 for a review; a refresher of the method is in Supplementary Appendix 3).
However, in a wide class of situations, there is in fact no easy way to generate a good counterfactual using standard SC method. Suppose that we observe a time series $y_{1,t}$
exposed to a treatment at time T. We also observe a basket of time series
$y_{1,t}$
exposed to a treatment at time T. We also observe a basket of time series ![]() to be used as donors. All time series are of length N. Assuming that the target time series
to be used as donors. All time series are of length N. Assuming that the target time series $y_{1,t}$
depends not only on current
$y_{1,t}$
depends not only on current $y_{j,t}$
, but also on lags
$y_{j,t}$
, but also on lags ![]() , then the model of interest for the behavior of
, then the model of interest for the behavior of $\mathbf {y}_{1}$
over time is
$\mathbf {y}_{1}$
over time is
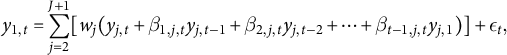
where $\beta _{l,j,t}$
is a time-dependent coefficient for the lag term
$\beta _{l,j,t}$
is a time-dependent coefficient for the lag term $y_{j,t-l}$
, l refers to the order of the lag, j to the donor unit, and t to the time.
$y_{j,t-l}$
, l refers to the order of the lag, j to the donor unit, and t to the time. $w_{j}$
is a constant weight for donor
$w_{j}$
is a constant weight for donor $\mathbf {y}_{j}$
and its lags, and
$\mathbf {y}_{j}$
and its lags, and $\epsilon _{t}$
is the error term. We assume that all classical assumptions about
$\epsilon _{t}$
is the error term. We assume that all classical assumptions about $\epsilon _{t}$
apply. This model explores the speed problem by allowing a varying number of lags of
$\epsilon _{t}$
apply. This model explores the speed problem by allowing a varying number of lags of $y_{j,t}$
to influence the target time series
$y_{j,t}$
to influence the target time series $y_{1,t}$
. The higher order of lags that have nonzero coefficients, the “slower”
$y_{1,t}$
. The higher order of lags that have nonzero coefficients, the “slower” $y_{1,t}$
is relative to
$y_{1,t}$
is relative to $y_{j,t}$
—that is, the more the past drags on.
$y_{j,t}$
—that is, the more the past drags on.
Consider now the standard SC approach. As it only includes the current donor time series $y_{j,t}$
but not the lags
$y_{j,t}$
but not the lags $y_{j,t-l}$
, the model used in estimating the weights
$y_{j,t-l}$
, the model used in estimating the weights $\mathbf {w}_{sc}$
is not the one of Equation (2.1), but rather
$\mathbf {w}_{sc}$
is not the one of Equation (2.1), but rather
 $$ \begin{align*} y_{1,t} = \sum_{j=2}^{J+2}(w_{j}y_{j,t} )+\eta_{t}=\mathbf{Y}_{-1,t}\mathbf{w}_{sc} + \eta_{t}, \end{align*} $$
and the new error term $\eta _{t}$
is
$\eta _{t}$
is
 $$ \begin{align*} \eta_{t} = \mathbf{Y}_{-1,L}\boldsymbol{\beta}_{L}\mathbf{w} + \epsilon_{t}, \end{align*} $$
where $\mathbf {Y}_{-1,L}$
are lag terms and
$\mathbf {Y}_{-1,L}$
are lag terms and $\boldsymbol {\beta }_{L}$
are lag coefficients. Clearly, ignoring the lagged effects of the donor time series results in omitted variable bias. This subsequently leads to a biased estimate of the treatment effect and inflated standard errors (see Supplementary Appendix 4 for a proof).
$\boldsymbol {\beta }_{L}$
are lag coefficients. Clearly, ignoring the lagged effects of the donor time series results in omitted variable bias. This subsequently leads to a biased estimate of the treatment effect and inflated standard errors (see Supplementary Appendix 4 for a proof).
Various extensions of the SC method have been introduced to tackle the problems of poor pre-treatment fits, but none are suitable for the varying speed problem. For example, Ben-Michael, Feller, and Rothstein (Reference Ben-Michael, Feller and Rothstein2022) examine the SC method in scenarios where policies are implemented by different units at distinct times. Other than SC methods, Goodman-Bacon (Reference Goodman-Bacon2021) discusses how improved difference-in-difference estimators address the bias from time-varying treatment effects. While many newly developed methods (Ben-Michael et al. Reference Ben-Michael, Feller and Rothstein2022; Ferman, Pinto, and Possebom Reference Ferman, Pinto and Possebom2020; Goodman-Bacon Reference Goodman-Bacon2021) strive to enhance causal inference outcomes when the data requirements outlined in Abadie and Cattaneo (Reference Abadie and Cattaneo2021) are not met, none specifically address the varying speed problem which involves estimating the $JNN$
lag coefficients.Footnote
6
$JNN$
lag coefficients.Footnote
6
In a related paper, Becker and Klößner (Reference Becker and Klößner2018) have improved the accuracy of the SC method. They do so by accommodating varying time resolutions and introducing time-specific weights for donors and predictors. This has broadened the applicability of the method in analyzing complex economic phenomena with multiple dependent variables and predictors of differing temporal granularities. Our methodology complements Becker and Klößner (Reference Becker and Klößner2018) by addressing the challenge of differential response speeds among units—an aspect of temporal variability not directly tackled by the focus on time resolution in the work by Becker and Klößner (Reference Becker and Klößner2018). By employing a warping technique on the outcome time series y j , we enhance the alignment of treated and control units, beyond observable characteristics or the temporal granularity of the data. This process effectively mitigates bias arising from the varying speeds at which units respond to latent processes or external shocks, ensuring the SC more accurately mirrors the counterfactual scenario. While the framework by Becker and Klößner (Reference Becker and Klößner2018) handles varying time resolutions and introduces time-specific weights for donors and predictors, it does not explicitly address pre-treatment alignment of outcome series to manage differences in unit response speeds. Our warping approach specifically fills this gap.Footnote 7
In this paper, we address the speed problem by relying on DTW, a non-parametric method derived from speech recognition (Vintsyuk Reference Vintsyuk1968), which allows us to recover speed differences between sequences. The DTW algorithm is widely used to find the optimal alignment between two time series that may vary in speed. It obtains the alignment by warping the sequences in the time dimension, such that the Euclidean distance between the warped and the target sequences is minimized. Determining the best way to warp the series is equivalent to estimating the lag coefficient $\beta $
s.
$\beta $
s.
After estimating the lag coefficient $\beta $
s, we combine the lag terms into a single time series
$\beta $
s, we combine the lag terms into a single time series
 $$ \begin{align*} y^{w}_{j,t} = \sum_{l=t-N}^{t-1}\hat{\beta}_{l,j,t}y_{j,t-l}, \end{align*} $$
which we refer to as a “warped” time series. Then when applying SC, we replace the original donor time series $\mathbf {y}_{j}$
with the warped time series
$\mathbf {y}_{j}$
with the warped time series $\mathbf {y}^{w}_{j}$
to mitigate the impact of the speed problem.Footnote
8
We provide details of DSC method below.
$\mathbf {y}^{w}_{j}$
to mitigate the impact of the speed problem.Footnote
8
We provide details of DSC method below.
3 Accounting for Speed: Dynamic Synthetic Controls
The speed issue arises from two possible sources: those caused by the treatment itself and those resulting from inherent speed differences (see Figure 1 and the previous section). Here, we introduce a method designed to mitigate the inherent speed differences between treated and untreated units while maintaining the effects induced by the treatment—whether in level or speed. As a result, we can attribute any post-treatment differences between the two groups exclusively to the treatment. This approach eliminates the influence of pre-existing speed disparities in the time series.
The DSC method introduced below addresses the issue of varying speeds across time and units. It begins by warping the untreated units to minimize the speed differences between them and the treated unit. The algorithm extracts information on speed differences from the pre-treatment period, and adjusts the speed of the entire donor time series to align with the treated time series.Footnote 9 This indirect warping approach allows the remaining difference between the treated and donor units to be attributed exclusively to treatment differences rather than inherent speed differences. After adjusting the series’ speeds, the standard SC method is applied.
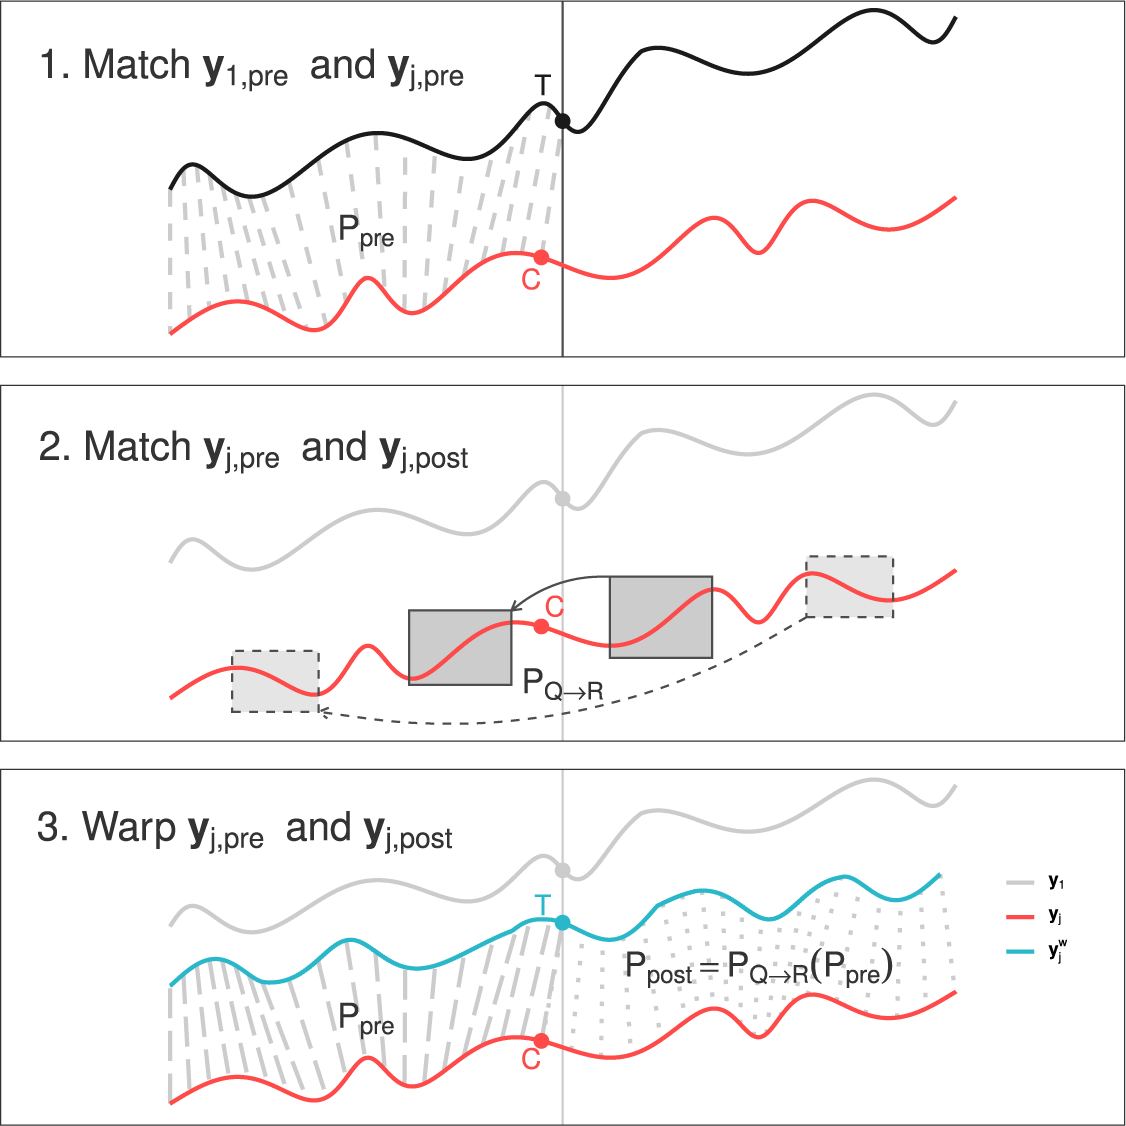
The warping process comprises three steps (see Figure 2 and Algorithm A1 in Supplementary Appendix 7). First, we match the pre-treatment parts of the target (black) and the donor (red) time series; second, we match the post-treatment and the pre-treatment parts of the donor time series; finally, we combine the time alignments obtained in the previous two steps and create a warped donor time series (blue) that minimizes the inherent speed difference between itself and the target time series (black). We now discuss each step in detail.
Dynamic synthetic control (DSC). The warping process of the DSC algorithm operates in three key steps. First, it matches the pre-treatment segments of $\mathbf {y}_{j}$
and
$\mathbf {y}_{j}$
and $\mathbf {y}_{1}$
to derive the warping path
$\mathbf {y}_{1}$
to derive the warping path $\mathbf {P}_{pre}$
. Second, it aligns the pre- and post-treatment segments of
$\mathbf {P}_{pre}$
. Second, it aligns the pre- and post-treatment segments of $\mathbf {y}_{j}$
, yielding
$\mathbf {y}_{j}$
, yielding $\mathbf {P}_{Q \to R}$
. Finally,
$\mathbf {P}_{Q \to R}$
. Finally, $\mathbf {y}_{j}$
is warped using both
$\mathbf {y}_{j}$
is warped using both $\mathbf {P}_{pre}$
and
$\mathbf {P}_{pre}$
and $\mathbf {P}_{post}$
to produce the time-warped series
$\mathbf {P}_{post}$
to produce the time-warped series $\mathbf {y}_{j}^{w}$
.
$\mathbf {y}_{j}^{w}$
.
Step 1. Matching Pre-Treatment Time Series
The DSC algorithm first estimates the speed relationship between the pre-treatment segments of the target time series $\mathbf {y}_{1}$
and the donor time series
$\mathbf {y}_{1}$
and the donor time series $\mathbf {y}_{j}$
. This is achieved by employing the DTW method to align the pre-treatment portion of
$\mathbf {y}_{j}$
. This is achieved by employing the DTW method to align the pre-treatment portion of $\mathbf {y}_{1}$
with
$\mathbf {y}_{1}$
with $\mathbf {y}_{j}$
and storing the warping path matrix.
$\mathbf {y}_{j}$
and storing the warping path matrix.
The warping path matrix stores the results of DTW alignments and is formally defined as follows:
 $$ \begin{align*} \mathbf{P}_{j} = [p_{j,\upsilon,t}], \quad \upsilon,t\in [1,N],\\ p_{j,\upsilon,t} = \begin{cases} 1, \hfill & \text{ if } y_{j,\upsilon} \text{ matches } y_{1,t},\\ 0, \hfill & \text{otherwise}. \end{cases} \end{align*} $$
As illustrated in Figure 3, the points of $\mathbf {y}_{1}$
are matched to the points of
$\mathbf {y}_{1}$
are matched to the points of $\mathbf {y}_{j}$
by DTW in a manner that minimizes the total distance between the matched points.Footnote
10
The warping path matrix
$\mathbf {y}_{j}$
by DTW in a manner that minimizes the total distance between the matched points.Footnote
10
The warping path matrix $\mathbf {P}_{j}$
captures the speed difference between
$\mathbf {P}_{j}$
captures the speed difference between $\mathbf {y}_{1}$
and
$\mathbf {y}_{1}$
and $\mathbf {y}_{j}$
.
$\mathbf {y}_{j}$
.
Warping path. The left figure shows data points matched in DTW, connected by dashed lines. The right figure displays the corresponding warping path matrix, where only matched pairs (ones) are shown. The time series $\mathbf {y}_{j}$
initially progresses at a rate
$\mathbf {y}_{j}$
initially progresses at a rate $2\times $
slower (indicated in red) than
$2\times $
slower (indicated in red) than $\mathbf {y}_{1}$
but later becomes
$\mathbf {y}_{1}$
but later becomes $2\times $
faster (in blue) than
$2\times $
faster (in blue) than $\mathbf {y}_{1}$
.
$\mathbf {y}_{1}$
.

We first match the pre-treatment target time series $\mathbf {y}_{1,1:T}$
to the donor time series
$\mathbf {y}_{1,1:T}$
to the donor time series $\mathbf {y}_{j}$
(see the first part of Figure 2). The point
$\mathbf {y}_{j}$
(see the first part of Figure 2). The point $y_{1,T}$
is matched to
$y_{1,T}$
is matched to $y_{j,C}$
.Footnote
11
Let
$y_{j,C}$
.Footnote
11
Let $\mathbf {y}_{j,pre} = \mathbf {y}_{j,1:C}$
denote the pre-treatment part of
$\mathbf {y}_{j,pre} = \mathbf {y}_{j,1:C}$
denote the pre-treatment part of $\mathbf {y}_{j}$
and
$\mathbf {y}_{j}$
and $\mathbf {y}_{j,post} = \mathbf {y}_{j,C:N}$
the post-treatment portion. Similarly, we define
$\mathbf {y}_{j,post} = \mathbf {y}_{j,C:N}$
the post-treatment portion. Similarly, we define $\mathbf {y}_{1,pre}=\mathbf {y}_{1,1:T}$
and
$\mathbf {y}_{1,pre}=\mathbf {y}_{1,1:T}$
and $\mathbf {y}_{1,post}=\mathbf {y}_{1,T:N}$
. Using DTW, we obtain a warping path from
$\mathbf {y}_{1,post}=\mathbf {y}_{1,T:N}$
. Using DTW, we obtain a warping path from $\mathbf {y}_{j,pre} \to \mathbf {y}_{1,pre}$
, which is stored in a
$\mathbf {y}_{j,pre} \to \mathbf {y}_{1,pre}$
, which is stored in a $C\times T$
matrix
$C\times T$
matrix $\mathbf {P}_{j,pre}$
.
$\mathbf {P}_{j,pre}$
.
The warping path $\mathbf {P}_{j,pre}$
is used in step three to warp the time axis of
$\mathbf {P}_{j,pre}$
is used in step three to warp the time axis of $\mathbf {y}_{j,pre}$
with the goal of minimizing the speed difference between
$\mathbf {y}_{j,pre}$
with the goal of minimizing the speed difference between $\mathbf {y}_{j,pre}$
and
$\mathbf {y}_{j,pre}$
and $\mathbf {y}_{1,pre}$
. Additionally, it is employed along with the warping path derived from step two to adjust the speed of
$\mathbf {y}_{1,pre}$
. Additionally, it is employed along with the warping path derived from step two to adjust the speed of $\mathbf {y}_{j,post}$
.
$\mathbf {y}_{j,post}$
.
Step 2. Matching Pre- and Post-Treatment Donor Time Series
Learning the warping path between the post-treatment segments $\mathbf {y}_{j,post}$
and
$\mathbf {y}_{j,post}$
and $\mathbf {y}_{1,post}$
is more challenging. We cannot directly align the two sequences, because their differences are due not only to their different speeds but also to the treatment effect. Aligning them would artificially remove that treatment effect. So the post-treatment warping path
$\mathbf {y}_{1,post}$
is more challenging. We cannot directly align the two sequences, because their differences are due not only to their different speeds but also to the treatment effect. Aligning them would artificially remove that treatment effect. So the post-treatment warping path $\mathbf {P}_{j,post}$
, that is, the inherent differences in speed, must be learned from the pre-treatment path
$\mathbf {P}_{j,post}$
, that is, the inherent differences in speed, must be learned from the pre-treatment path $\mathbf {P}_{j,pre}$
.
$\mathbf {P}_{j,pre}$
.
To extract similar short-term sequences in $\mathbf {y}_{j,post}$
and
$\mathbf {y}_{j,post}$
and $\mathbf {y}_{j,pre}$
and therefore infer the warping path
$\mathbf {y}_{j,pre}$
and therefore infer the warping path $\mathbf {P}_{j,post}$
from
$\mathbf {P}_{j,post}$
from $\mathbf {P}_{j,pre}$
, we use a double-sliding window approach.Footnote
12
In essence, the double-sliding window serves as a dynamic “lens”—the first window scans through the post-treatment time series to identify segments requiring alignment, while the second window sifts through the pre-treatment time series to find the most similar segments, which facilitates optimal matching and warping of patterns between the two time series. As illustrated in the second part of Figure 2, we slide a target window
$\mathbf {P}_{j,pre}$
, we use a double-sliding window approach.Footnote
12
In essence, the double-sliding window serves as a dynamic “lens”—the first window scans through the post-treatment time series to identify segments requiring alignment, while the second window sifts through the pre-treatment time series to find the most similar segments, which facilitates optimal matching and warping of patterns between the two time series. As illustrated in the second part of Figure 2, we slide a target window $Q_{u}$
in
$Q_{u}$
in $\mathbf {y}_{j,post}$
and a reference window
$\mathbf {y}_{j,post}$
and a reference window $R_{i}$
in
$R_{i}$
in $\mathbf {y}_{j,pre}$
. For each short-term sequence
$\mathbf {y}_{j,pre}$
. For each short-term sequence $Q_{u}$
in
$Q_{u}$
in $\mathbf {y}_{j,post}$
, we find the best-matching sequence
$\mathbf {y}_{j,post}$
, we find the best-matching sequence $R^{*}$
from
$R^{*}$
from $\mathbf {y}_{j,pre}$
, and record the warping path
$\mathbf {y}_{j,pre}$
, and record the warping path $Q_{u}\to R^{*}$
as
$Q_{u}\to R^{*}$
as $\mathbf {P}_{j,Q_{u}\to R^{*}}$
. We also extract the corresponding pre-treatment warping path
$\mathbf {P}_{j,Q_{u}\to R^{*}}$
. We also extract the corresponding pre-treatment warping path $\mathbf {P}_{j,R^{*}}:R^{*}\to \mathbf {y}_{1}$
from
$\mathbf {P}_{j,R^{*}}:R^{*}\to \mathbf {y}_{1}$
from $\mathbf {P}_{j,pre}$
. Next,
$\mathbf {P}_{j,pre}$
. Next, $\mathbf {P}_{j,R^{*}}$
is adjusted based on
$\mathbf {P}_{j,R^{*}}$
is adjusted based on $\mathbf {P}_{j,Q_{u}\to R^{*}}$
to account for the differences between
$\mathbf {P}_{j,Q_{u}\to R^{*}}$
to account for the differences between $Q_{u}$
and
$Q_{u}$
and $R^{*}$
. The resulting adjusted warping path is
$R^{*}$
. The resulting adjusted warping path is $\mathbf {P}_{j,Q_{u}}$
. Once the sliding target window
$\mathbf {P}_{j,Q_{u}}$
. Once the sliding target window $Q_{u}$
reaches the right boundary
$Q_{u}$
reaches the right boundary $y_{j,N}$
, we merge all the resulting warping paths
$y_{j,N}$
, we merge all the resulting warping paths $\mathbf {P}_{j,Q_{u}}$
to obtain the final warping path
$\mathbf {P}_{j,Q_{u}}$
to obtain the final warping path $\mathbf {P}_{j,post}$
for the post treatment donor time series.Footnote
13
$\mathbf {P}_{j,post}$
for the post treatment donor time series.Footnote
13
Step 3. Warping Donor Time Series
In the third step, the DSC algorithm uses the previously estimated warping path $\mathbf {P}_{j,pre}$
to warp the pre-treatment donor series
$\mathbf {P}_{j,pre}$
to warp the pre-treatment donor series $\mathbf {y}_{j,pre}$
. Similarly, it uses
$\mathbf {y}_{j,pre}$
. Similarly, it uses $\mathbf {P}_{j,post}$
from the second step to warp
$\mathbf {P}_{j,post}$
from the second step to warp $\mathbf {y}_{j,post}$
.Footnote
14
The resulting time series are combined into a single warped donor time series
$\mathbf {y}_{j,post}$
.Footnote
14
The resulting time series are combined into a single warped donor time series $\mathbf {y}_{j}^{w}$
:
$\mathbf {y}_{j}^{w}$
:
 $$ \begin{align*} \mathbf{y}_{j}^{w} &= [\mathbf{y}^{w}_{j,pre}, \mathbf{y}^{w}_{j,post}]\nonumber \\ &=[\mathbf{P}_{j,pre}(\mathbf{y}_{j,pre}), \mathbf{P}_{j,post}(\mathbf{y}_{j,post})]. \end{align*} $$
After being warped, the inherent speed differences between $\mathbf {y}_{j}^{w}$
and
$\mathbf {y}_{j}^{w}$
and $\mathbf {y}_{1}$
are minimized, while the differences caused by the intervention are unchanged. Finally, using the warped donor time series
$\mathbf {y}_{1}$
are minimized, while the differences caused by the intervention are unchanged. Finally, using the warped donor time series ![]() , we apply the SC method to construct a counterfactual of
, we apply the SC method to construct a counterfactual of $\mathbf {y}_{1}$
to minimize the impact of the speed problem.Footnote
15
$\mathbf {y}_{1}$
to minimize the impact of the speed problem.Footnote
15
All methods discussed in this paper have been implemented in an accompanying R package.Footnote 16
4 Evaluating the Method
We showcase the advantages of our proposed method using two approaches. First, we create synthetic data using a Monte Carlo simulation. This lets us design and know the treatment effect, in contrast to real-world data where the true treatment effect is never known. This allows us to show that, across a wide range of parameters, our estimate of the treatment effect is more efficient than the one obtained using the standard SC approach.
Second, we apply the DSC method to data from three seminal articles on SCs: Abadie and Gardeazabal’s (Reference Abadie and Gardeazabal2003) data on the effect of terrorist attacks on GDP; Abadie et al.’s (Reference Abadie, Diamond and Hainmueller2010) data on changes in tobacco consumption in California; and Abadie et al.’s (Reference Abadie, Diamond and Hainmueller2015) study of the economic impact of the 1990 German reunification. In each case, we demonstrate that our estimates of the placebos are more efficient, such that the statistical test of the effect of the treatment has greater power.
In each case, we make two main arguments. First, we argue that our method generates a better counterfactual than the standard SC. Second, we demonstrate that our method enhances precision by reducing uncertainty in the treatment effect estimate. A key issue in SC is the possibility that observed effects occur by chance. Existing literature often shows that while SCs for untreated units (placebo units) generally yield less extreme results than the treated unit, the confidence intervals remain wide. Our DSC method effectively narrows these intervals, thereby improving estimator precision.
4.1 Monte Carlo simulation
We first use a Monte Carlo simulation to replicate the types of empirical challenges faced with real data. We generate hundreds of artificial panel datasets, each containing time series for ten units observed over 100 periods. In each sample of 10 series, one time series is designated as the “treated” unit, while the remaining nine serve as the donor pool to construct the SC (i.e., $J=9$
,
$J=9$
, $N=100$
).Footnote
17
$N=100$
).Footnote
17
All 10 time series follow a common autoregressive integrated moving average (ARIMA) process but exhibit differing speeds. A time series’ speed is either random or a function of the time series direction (increasing or decreasing). The idea behind it is to capture the possibility that speed may vary as a function of the direction of the underlying series. Economic crashes (i.e., a decreasing series), for example, may unfold faster than recoveries (Reinhart and Rogoff Reference Reinhart and Rogoff2014). A dataset-specific parameter $\psi \in (0,1)$
determines the extent to which this occurs. For instance,
$\psi \in (0,1)$
determines the extent to which this occurs. For instance, $\psi =0$
implies that the speed will be entirely governed by a random normal noise. Conversely, if
$\psi =0$
implies that the speed will be entirely governed by a random normal noise. Conversely, if $\psi =1$
, the speed will completely depend on the direction of the time series.
$\psi =1$
, the speed will completely depend on the direction of the time series.
For each dataset, we implement DSC and standard SC to construct counterfactuals for the treated unit. A key advantage of the Monte Carlo simulation, as opposed to real observational data, is that we know the true treatment effect and thus the true counterfactual. Consequently, we can assess how well counterfactuals formed using different methods approximate the post-treatment series. In accordance with common practice in the literature, we evaluate the performance of each method over the 10 periods following the treatment, that is, from $t=61$
to
$t=61$
to $t=70$
.
$t=70$
.
To evaluate the quality of the SC generated by each method, we compute the 10-period post-treatment mean squared error (MSE) for the estimated treatment effects. Specifically, the MSE for dataset d is defined as: $\textrm {MSE}_{d}=\frac {1}{10}\sum _{t=61}^{70}(\widehat {\tau }_{t,d}-\tau _{t})^{2}$
, where
$\textrm {MSE}_{d}=\frac {1}{10}\sum _{t=61}^{70}(\widehat {\tau }_{t,d}-\tau _{t})^{2}$
, where $\widehat {\tau }_{t,d}$
denotes the estimated treatment effects using one of the two SC methods. A small MSE indicates that the estimated treatment effect closely fits the true effect imposed during the data generation process. For each simulation, we calculate the MSE for the standard SC approach—
$\widehat {\tau }_{t,d}$
denotes the estimated treatment effects using one of the two SC methods. A small MSE indicates that the estimated treatment effect closely fits the true effect imposed during the data generation process. For each simulation, we calculate the MSE for the standard SC approach— $\textrm {MSE}_{SC}$
—and the MSE for our DSC approach—
$\textrm {MSE}_{SC}$
—and the MSE for our DSC approach— $\textrm {MSE}_{DSC}$
. The log ratio of these two values yields a measure r representing the relative performance of each method, that is,
$\textrm {MSE}_{DSC}$
. The log ratio of these two values yields a measure r representing the relative performance of each method, that is, $r = \log \left (\textrm {MSE}_{DSC}/\textrm {MSE}_{SC}\right )$
. Negative log ratios suggest superior performance of our method via lower MSE. We compute the log ratio r for each simulated dataset and conduct a t-test on the resulting
$r = \log \left (\textrm {MSE}_{DSC}/\textrm {MSE}_{SC}\right )$
. Negative log ratios suggest superior performance of our method via lower MSE. We compute the log ratio r for each simulated dataset and conduct a t-test on the resulting $100$
log ratios to assess whether the ratio is significantly different from 0 (
$100$
log ratios to assess whether the ratio is significantly different from 0 ( $p<0.01$
).
$p<0.01$
).
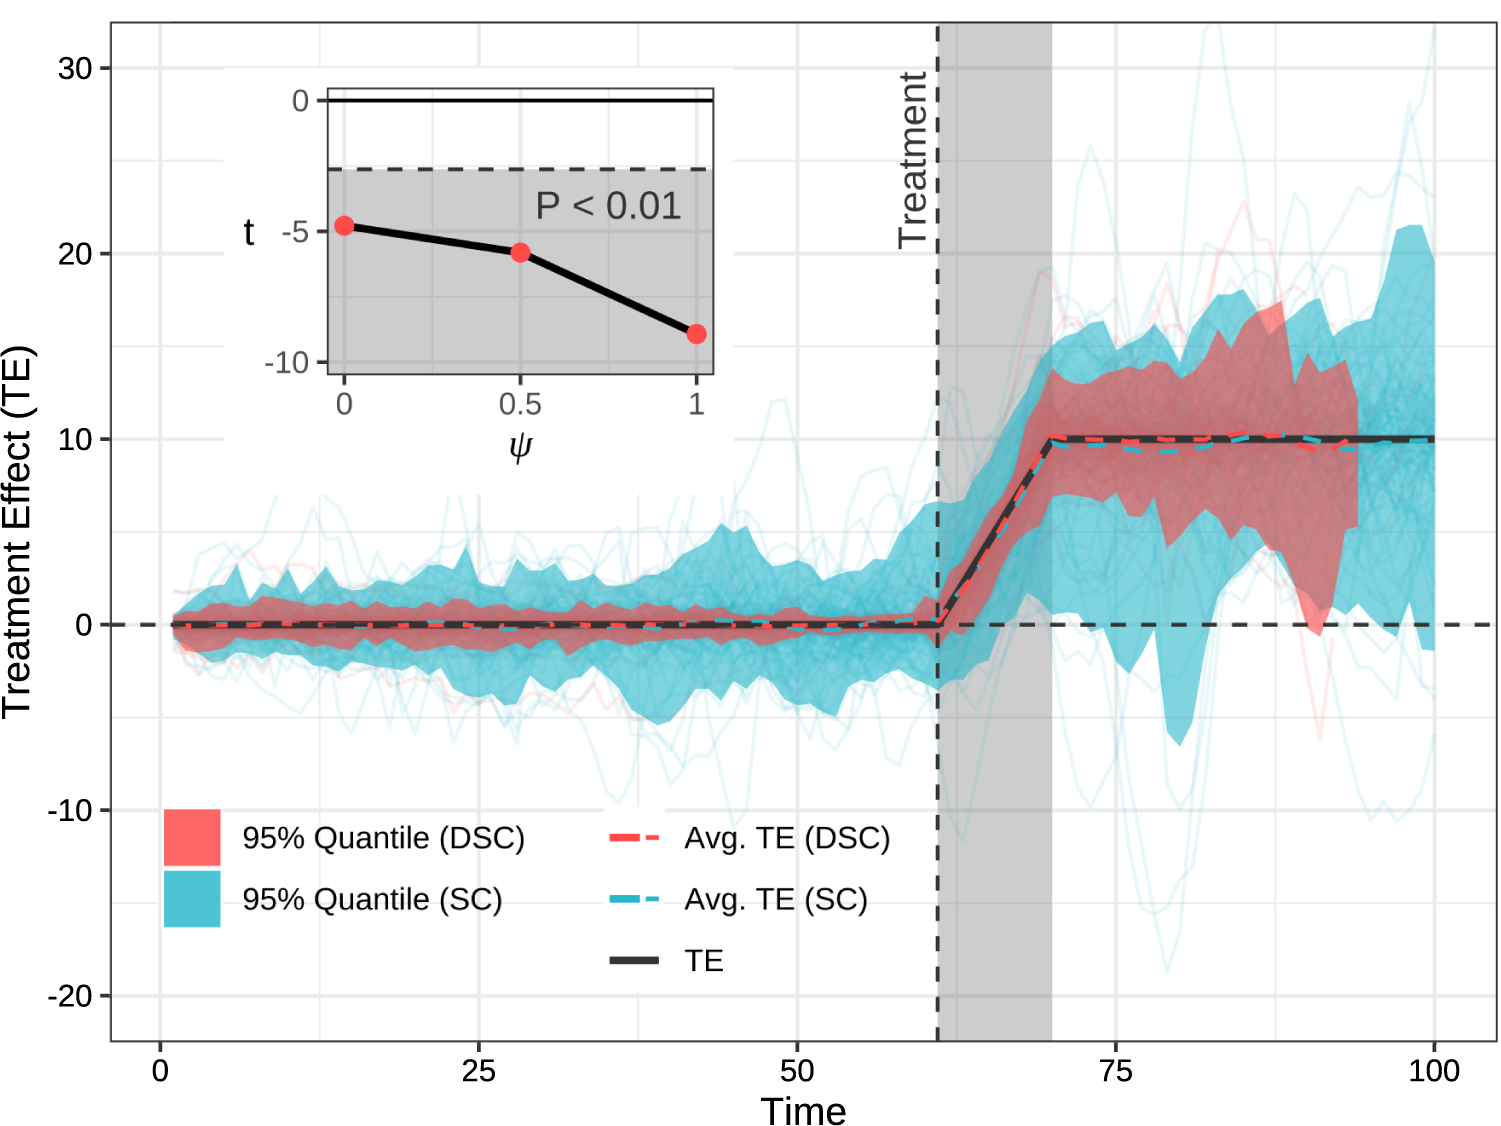
The estimated treatment effects for all datasets are illustrated in Figure 4. We see that, in the 10 periods following the treatment, the average estimated treatment effects from the two methods are close to the true effects. However, the new method, DSC, produces a significantly smaller error area than the standard method. Specifically, the average logged MSE for the standard SC method ( $\overline {log(\textrm {MSE}_{SC})}$
) is
$\overline {log(\textrm {MSE}_{SC})}$
) is $0.90$
, while the value for the DSC method (
$0.90$
, while the value for the DSC method ( $\overline {log(\textrm {MSE}_{DSC})}$
) is
$\overline {log(\textrm {MSE}_{DSC})}$
) is $-0.50$
.Footnote
18
Moreover, our approach outperforms the standard method 77% of the time (Wilcox test
$-0.50$
.Footnote
18
Moreover, our approach outperforms the standard method 77% of the time (Wilcox test $< 0.001$
). These results suggest a strong expected benefit to using this method and are in line with our theory: Section 2 shows that the estimated treatment effect from SC is potentially biased and has a larger variance. In the Monte Carlo study, we do not directly observe bias because the biases around the true values tend to average out to zero. But it is clear in the Monte Carlo results that the SC estimator has a higher variance, and hence that the DSC estimator of the treatment effect is more efficient.
$< 0.001$
). These results suggest a strong expected benefit to using this method and are in line with our theory: Section 2 shows that the estimated treatment effect from SC is potentially biased and has a larger variance. In the Monte Carlo study, we do not directly observe bias because the biases around the true values tend to average out to zero. But it is clear in the Monte Carlo results that the SC estimator has a higher variance, and hence that the DSC estimator of the treatment effect is more efficient.
Results from the simulation study with $95\%$
confidence intervals. The main graph showcases results drawn from Monte Carlo simulations where
$95\%$
confidence intervals. The main graph showcases results drawn from Monte Carlo simulations where $\psi = 1$
. The gray-shaded region delineates the period over which performance is estimated. Red and blue lines represent the distribution of estimated treatment effects for the dynamic synthetic control and synthetic control methods, respectively. The true treatment effect is in black. An inset in the top-left corner demonstrates that larger
$\psi = 1$
. The gray-shaded region delineates the period over which performance is estimated. Red and blue lines represent the distribution of estimated treatment effects for the dynamic synthetic control and synthetic control methods, respectively. The true treatment effect is in black. An inset in the top-left corner demonstrates that larger $\psi $
values lead to improved performance—as evidenced by more negative t-values.
$\psi $
values lead to improved performance—as evidenced by more negative t-values.
Finally, we also show that the results hold for all values of $\psi $
—the parameter which controls the extent to which speed varies as a function of the shape of the series (see the subfigure of Figure 4), although larger
$\psi $
—the parameter which controls the extent to which speed varies as a function of the shape of the series (see the subfigure of Figure 4), although larger $\psi $
s lead to more significance (more negative t value). When
$\psi $
s lead to more significance (more negative t value). When $\psi =1$
, the average log ratio of MSEs is
$\psi =1$
, the average log ratio of MSEs is $\bar {r} = -1.39$
. This value indicates that, on average, the DSC method reduces the MSE of the estimated treatment effect by
$\bar {r} = -1.39$
. This value indicates that, on average, the DSC method reduces the MSE of the estimated treatment effect by $75.19\%$
when compared to the standard SC method (
$75.19\%$
when compared to the standard SC method ( $1-e^{-1.39} \approx 75.19\%$
).
$1-e^{-1.39} \approx 75.19\%$
).
4.2 Re-Evaluating Empirical Findings
We now show that these results are not limited to artificial data but extend to real-world empirical data. Specifically, we apply our method to three seminal articles in the SC literature: Abadie and Gardeazabal’s (Reference Abadie and Gardeazabal2003) analysis of the economic costs of terrorism in the Basque country; Abadie et al.’s (Reference Abadie, Diamond and Hainmueller2010) assessment of the effect of Proposition 99—a large-scale tobacco control program implemented in California in 1988; and Abadie et al.’s (Reference Abadie, Diamond and Hainmueller2015) evaluation of the economic impact of the 1990 German reunification on West Germany.Footnote 19
One challenge, of course, is that we do not know the true treatment effect for the main unit of interest. This effect must be estimated and, unlike in the Monte Carlo study, there is no way to argue that a particular result is more accurate or less biased than another. However, we do know that there is no treatment effect in the other (non-treated) units. Thus, we can assess the performance of the estimators by comparing how well their respective synthetic controls approximate the true post-treatment period for non-treated units. For example, we cannot know the true effect of the German reunification on West Germany’s GDP, but we do know that there was no treatment in Canada, and can thus attempt to match Canada’s post-1990 trajectory—as well as each of the untreated units.Footnote 20 Due to the limited set of untreated units, however, this is not enough to yield a sufficiently large set of estimates for comparison. We therefore use jacknife resampling to generate more datasets in which we randomly remove one of the countries.
We now review each of the three datasets and the results obtained using each method.
4.2.1 Terrorism and GDP per Capita in the Basque Country
Abadie and Gardeazabal (Reference Abadie and Gardeazabal2003) find that the outbreak of terrorism in the late 1960s significantly affected per capita GDP in the Basque Country. When compared to an SC region without terrorism, the Basque Country’s GDP declined by about 10 percentage points.
Our estimate of the effect on the Basque country is similar to the standard SC estimate. However, when we build SCs for the untreated units themselves, we find that they are closer to the true trajectory than is the standard SC. Figure 5 (top) displays the distribution of our estimated treatment effects for all untreated units. Since these units did not receive a treatment, our SC should ideally be as close as possible to the post-treatment values of the time series. In other words, the average difference between the post-treatment series and the SC should deviate as little as possible from zero. Visually, we observe that the band for our approach is narrower than the one for standard SC.
Placebo tests, real data. We revisited the placebo tests reported in Abadie and Gardeazabal (Reference Abadie and Gardeazabal2003), Abadie et al. (Reference Abadie, Diamond and Hainmueller2010), and Abadie et al. (Reference Abadie, Diamond and Hainmueller2015). The plots report the placebo tests for each of these studies, using standard synthetic controls (SCs) (blue) and dynamic synthetic control (red). In addition, the estimated treatment effects for the treated units—Basque Country, California State, and West Germany—are shown as thick, brighter lines. For each study, find that our placebo estimates exhibit smaller variance than those using standard SCs, which do not account for variations in speed.
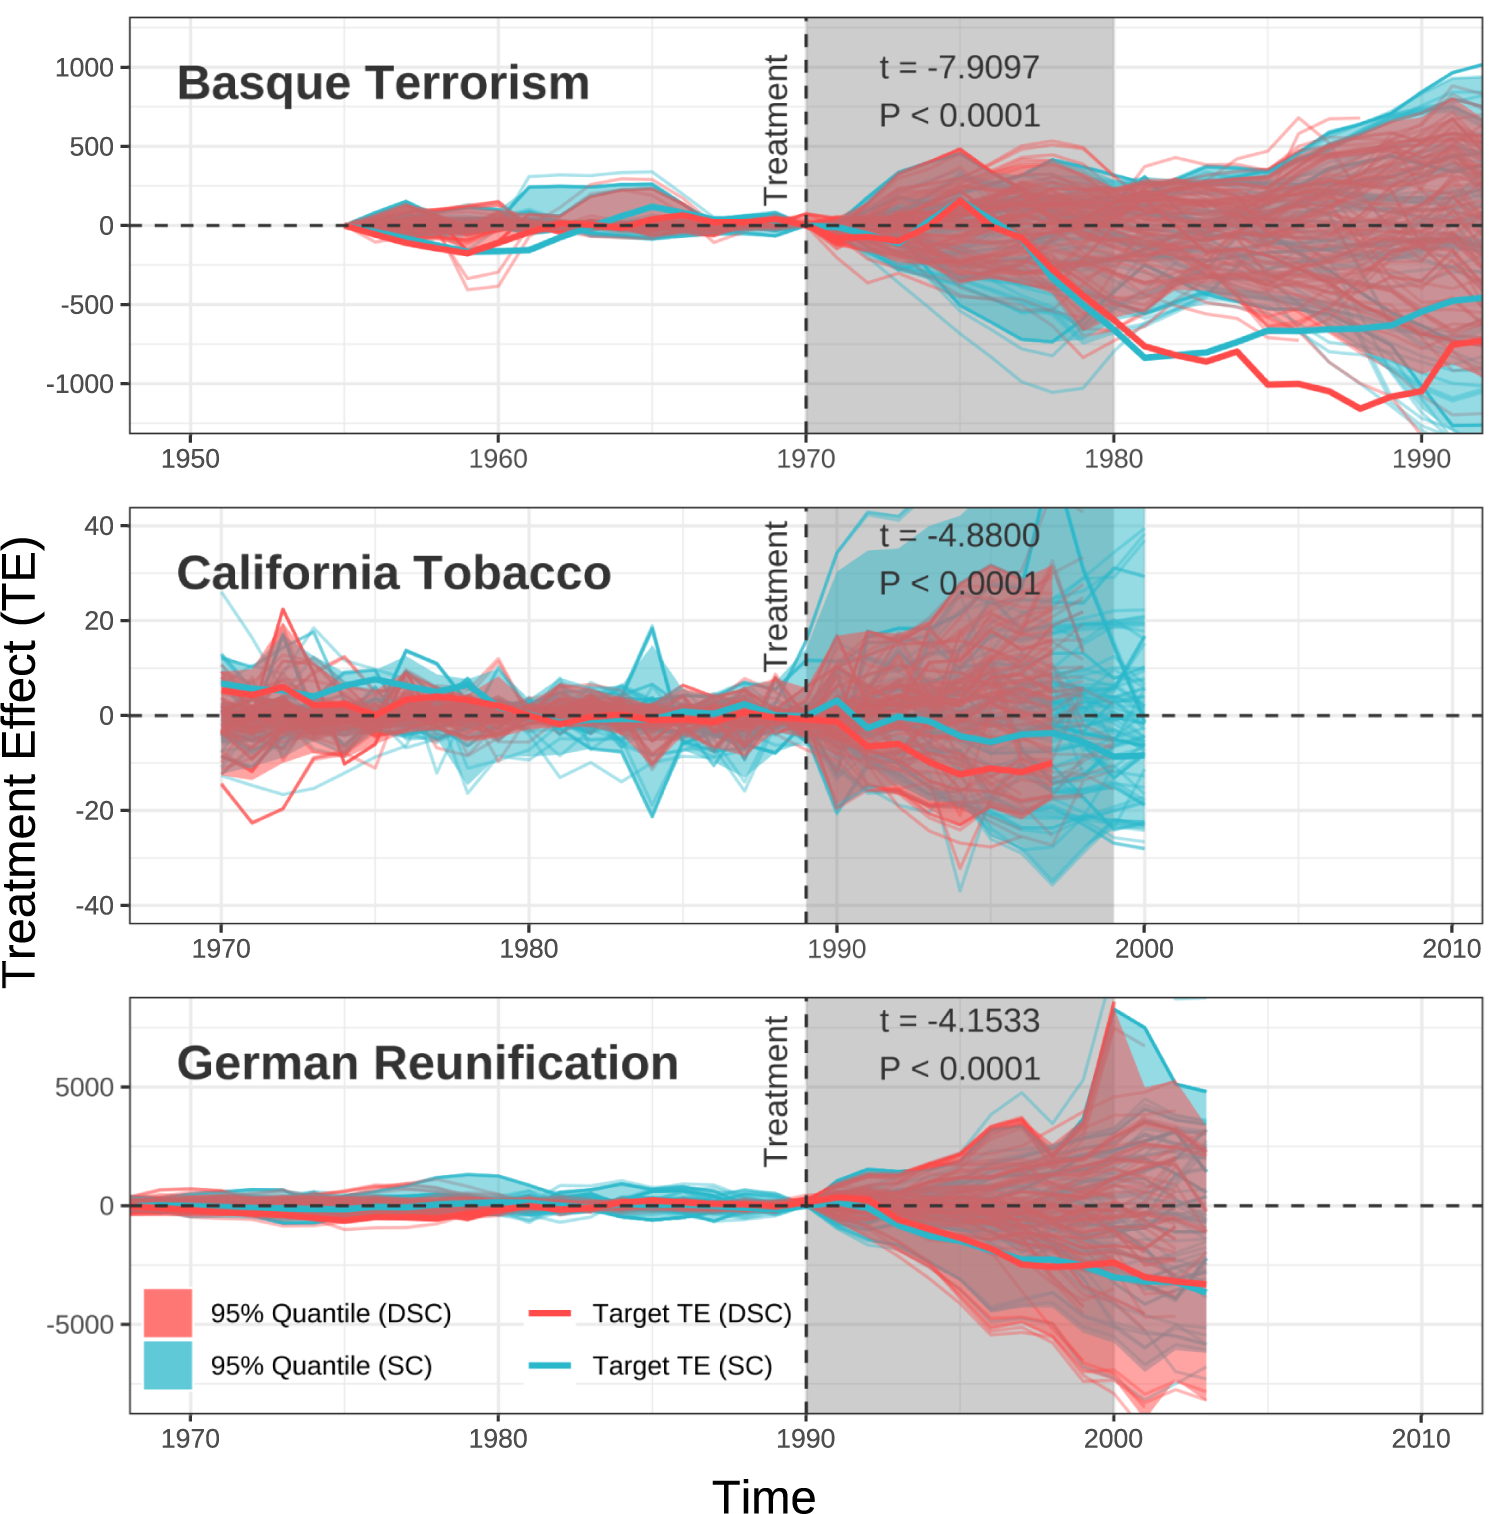
However, this plot does not capture the full extent of the true improvement, as we should be comparing the pairwise performance of each algorithm (instead of the pooled comparison shown here). To more formally demonstrate the improvement, we calculate the MSE for each SC compared to the unit of interest. We then calculate a t-test of $\log (\textrm {MSE}_{DSC}/\textrm {MSE}_{SC})$
. A negative value indicates that our MSE is smaller than the one obtained with the standard approach. We find that this is indeed the case. The log ratio of the MSEs is significantly less than zero (
$\log (\textrm {MSE}_{DSC}/\textrm {MSE}_{SC})$
. A negative value indicates that our MSE is smaller than the one obtained with the standard approach. We find that this is indeed the case. The log ratio of the MSEs is significantly less than zero ( $t=-7.91, p<0.0001$
).Footnote
21
$t=-7.91, p<0.0001$
).Footnote
21
In terms of our ability to make inferences, the observed reduction in MSE when employing the DSC method suggests its superior efficiency compared to traditional SC methods. In short, our DSC approach more closely approximates the true treatment effects and therefore enhances the robustness and reliability of our causal inference.
4.2.2 The Effects of Proposition 99 on Tobacco Sales in California
Abadie et al. (Reference Abadie, Diamond and Hainmueller2010) study the impact of Proposition 99, a large-scale tobacco control program implemented in California in 1988. They show that by 2000, California’s per-capita cigarette sales were 26 packs fewer than would have been expected without Proposition 99.
Our analysis suggests that the effect might in fact be greater, with an estimated reduction of about 31 packs in cigarette sales. Although it is impossible to definitively determine which estimate is more accurate, as the true treatment effect remains unknown, we do find that our estimates of the post-treatment behavior of states other than California is closer to the true path than is the standard SC, with smaller MSE ratios ( $t=-4.88,\ p<0.001$
).Footnote
22
$t=-4.88,\ p<0.001$
).Footnote
22
4.2.3 The Effects of the German Reunification on West Germany’s GDP per Capita
Finally, Abadie et al. (Reference Abadie, Diamond and Hainmueller2015) seek to estimate the economic impact of the 1990 German reunification on West Germany. They find that the per-capita GDP of West Germany was reduced by on average about 1,600 USD per year over the 1990–2003 period, which is approximately 8% of the 1990 level. In 2003, the last year of their study period, the estimated per-capita GDP in the synthetic data is about 12% higher than in the real data.
In this replication, our estimate of the treatment effect on West Germany is similar to the one of Abadie and Gardeazabal (Reference Abadie and Gardeazabal2003), and visually the $95\%$
quantile areas of the estimated treatment effect of two SC methods on the untreated countries are also close. But in the pairwise comparison, we find that the DSC method generally exhibits a reduced MSE in estimating treatment effects for control countries, compared to the standard SC approach (
$95\%$
quantile areas of the estimated treatment effect of two SC methods on the untreated countries are also close. But in the pairwise comparison, we find that the DSC method generally exhibits a reduced MSE in estimating treatment effects for control countries, compared to the standard SC approach ( $t=-4.15,\ p<0.001$
).Footnote
23
$t=-4.15,\ p<0.001$
).Footnote
23
Overall, our findings on all three empirical studies indicate that the DSC method offers significant advantages when compared to the standard SC approach. In particular, DSC achieves closer approximations to the true trajectories of non-treated units, as evidenced by the observed reduction in MSE. As a result, the DSC method provides a more accurate approximation of the true treatment effects. It is a more efficient estimator of the treatment effects and mitigates the risk of biased estimates.
5 Conclusion
In this study, we tackle the issue of varying reaction speeds across different units when estimating causal effects of treatments. This issue arises from the fact that units—such as states, cities, or people—may adjust and react at different speeds due to a multitude of factors, including legal constraints, institutional differences, and the nature of the treatment itself. Ignoring speed variations can bias estimates and conclusions, weakening the validity of treatment effect analyses.
We introduce the DSC method, which extends the SC approach by integrating a DTW algorithm to adjust for speed differences. By doing so, the DSC method enables researchers to construct counterfactuals that more accurately represent the hypothetical outcomes for treated units without the treatment, with improved precision and efficiency of treatment effect estimates compared to the standard SC method.
Through Monte Carlo simulations and real-world datasets, we show that DSC outperforms standard SC in treatment effect estimation. It reduces uncertainty and boosts test power, minimizing the risk of false conclusions. These results highlight the value of our approach in addressing the speed problem and improving the accuracy and precision of treatment effect estimates.
Future research will be needed to explore the applications of DSC in various settings, such as assessing the impact of policies, interventions, or shocks across multiple dimensions and over different time horizons. Additional research could also assess DSC’s sensitivity to unobservable variables and endogenous regressors.
Funding
This project has received funding from the European Research Council (ERC) under the European Union's Horizon 2020 research and innovation programme (grant agreement No 101002240).
Data Availability Statement
Replication code for this article has been published in Code Ocean, a computational reproducibility platform that enables users to run the code, and can be viewed interactively at https://codeocean.com/capsule/7670710/tree/v1. A preservation copy of the same code and data can also be accessed via Dataverse at https://doi.org/10.7910/DVN/DIUPUA (Cao and Chadefaux 2024).
Supplementary Material
For supplementary material accompanying this paper, please visit https://doi.org/10.1017/pan.2024.14.


 Open access