


1. Introduction
Packaging accounts for 40% of global plastic waste, some 142 million tons, contributing significantly to plastic pollution in natural environments like oceans and freshwater systems (Barnes et al., Reference Barnes, Galgani, Thompson and Morton2009; Samborska, Reference Samborska2024). Poor waste management in low- and middle-income countries has made them the leading contributors to global plastic pollution (Ncube et al., Reference Ncube, Ude, Ogunmuyiwa, Zulkifli and Beas2021). Food packaging – beverage bottles, bottle caps, food containers, cutlery, grocery bags, straws, food wrappers – is the most common plastic pollutant on beaches in Latin America and the Caribbean. In Central America, and specifically in Honduras, the daily plastic production per person is estimated at 0.28 and 0.19 kg, respectively (Geyer et al., Reference Geyer, Jambeck and Law2017; Ritchie and Roser, Reference Ritchie and Roser2018).
Food packaging is essential in the supply chain, ensures food quality and safety, protects food from damage, and reduces waste (Han et al., Reference Han, Ruiz-Garcia, Qian and Yang2018; Trajkovska Petkoska et al., Reference Trajkovska Petkoska, Daniloski, D’Cunha, Naumovski and Broach2021). The most common plastics used in the food and restaurant industry are polystyrene (P.E.), polypropylene (P.P.), and polyethylene terephthalate (P.E.T.). Although these materials can be recycled, most countries lack the infrastructure, so only P.E.T. is widely recycled (Geyer et al., Reference Geyer, Jambeck and Law2017). In Honduras, the recycling rate is just 10%, and single-use plastic is banned only in the Roatan islands (UNEP, 2018).
The rise of food delivery apps has increased the demand for takeout and delivery, a trend that shows no signs of reversing (Euromonitor International, 2025). In Honduras, the number of food and beverage establishments reached 2,885 in 2023 and is expected to grow. The Honduran restaurant delivery market is projected to reach US$4.82 million and 369,000 users by 2029, with a 7.9% annual growth rate (Statista, 2025). Weekly use of third-party delivery services like HUGO, Glovo, and UBER Eats continues to rise (USDA-FAS 2023).
Given the projected increase in food takeout and delivery, and the limited capacity of many countries to manage post-consumer plastic waste, it is imperative to search for solutions in the early links of the value chain. Therefore, this study aimed to evaluate the effect of an educational intervention, specifically a 12-hour course on sustainable takeout and delivery packaging, on the sustainability of takeout and delivery packaging of Honduran restaurants. To accomplish this, we developed a sustainable packaging measure – a sustainability score – and designed a randomized controlled trial (RCT) to assess the effect of the educational intervention.
This study contributes to the limited body of literature using experimental methods to understand producer behavior, provides evidence of the limitations of information-only interventions under real-world structural constraints, introduces a novel metric for measuring the sustainability of takeout and delivery packaging, and serves as an example of how to analyze RCT data with issues of non-compliance and attrition. Experimental studies, in contrast to non-experimental research, allow for better identification of behavioral differences due to economic theory and those due to empirical model misspecification (Ferraro et al., Reference Ferraro, Messer, Shukla and Weigel2024). Nevertheless, research on behavioral economic questions related to producers is largely nonexperimental, with experimental studies remaining relatively scarce (Ferraro et al., Reference Ferraro, Messer, Shukla and Weigel2024). For sustainable takeout and delivery packaging, and plastic pollution overall, we find most experimental studies focus on consumers’ economic behavior (e.g., Borg et al., Reference Borg, Lennox, Kaufman, Tull, Prime, Rogers and Dunstan2022; Heidbreder and Schmidt Reference Heidbreder and Schmitt2020; Mundt et al., Reference Mundt, Carl and Harhoff2020), and only one study that focuses on producers’ economic behavior – plastic use and disposal in agriculture (Abadi, Reference Abadi2023). Experimental studies using producers as the sample are even scarcer when the area of study is Latin America.
2. Literature review
2.1. Sustainable packaging
Sustainability in food packaging can be accomplished at three levels (Peelman et al., Reference Peelman, Ragaert, de Meulenaer, Adons, Peers, Cardon, van Impe, Devlieghere, Peelman, Ragaert, de Meulenaer, Adons, Peers, Cardon, van Impe and Devlieghere2013). First is raw inputs: use of recycled materials and renewable assets to decrease CO2 emissions. Second is the production level: using more efficient forms of energy. And third is the waste management level: considering reuse and biodegradability. The Sustainable Packaging Coalition (2011) defines sustainable packaging as safe, beneficial, and healthy for individuals and communities throughout its life cycle. The goal is to reduce packaging’s environmental damage due to consumers’ behavior and industrial practices (Hage and Söderholm Reference Hage and Söderholm2008; Magnier and Crié Reference Magnier and Crié2015). Besides benefiting the environment, sustainable packaging can enhance business performance through economic gains (Gustavo et al., Reference Gustavo, Pereira, Bond, Viegas and Borchardt2018). The potential for economic gains is one driver of sustainable packaging adoption, but there are also many challenges. Concerns about the quality of the packaging and implementation costs may hinder small and medium-sized enterprises (SMEs) from adopting sustainable packaging. Past studies, however, find evidence that consumers are willing to pay a premium for sustainable packaging because of environmental concerns (Kitz et al., Reference Kitz, Walker, Charlebois and Music2021).
2.2. Consumer demand for sustainable packaging
Studies of consumers have demonstrated there is demand for sustainable packaging. Consumers are willing to pay for sustainable packaging not only in the food sector but also in other industries, from gardening (Yue et al., Reference Yue, Hall, Behe, Campbell, Dennis and Lopez2010) to household products (Van Winkle et al., Reference Van Winkle, Zhang, Yuan and Qian2013). In the food industry, evidence on the demand for sustainable packaging has been reported in experimental studies using information treatment. Hao et al. (Reference Hao, Yin and Dogot2024) conducted an RCT in which Chinese consumers received an information intervention targeting control and normative beliefs. The authors find that this knowledge increased the individuals’ willingness to pay for management of agricultural plastic waste by CNY400.5 and CNY307.2, if targeting control or normative beliefs, respectively. In another RCT, Mundt et al. (Reference Mundt, Carl and Harhoff2020) find that individuals subjected to a nudge treatment (cups without straws) were less likely to use straws. Novoradovskaya et al. (Reference Novoradovskaya, Mullan and Hasking2020) find that participants subjected to an information intervention treatment doubled their use of reusable cups. However, not all information treatments generate an increase in demand for sustainable packaging. Heidbrerder and Schmitt (Reference Heidbreder and Schmitt2020) applied an information treatment to participants online and found that the treatment had no statistically significant effect on their use of plastic. In fact, Borg et al. (Reference Borg, Lennox, Kaufman, Tull, Prime, Rogers and Dunstan2022), after reviewing RCT studies on sustainable packaging, find that individuals’ behavioral change alone has a limited effect and should therefore be complemented by actions from other stakeholders (e.g., businesses and government).
2.3. Producers’ behavior toward plastics and sustainability
Studies on behavioral economics concerning producers generally rely on non-experimental methods, with few experimental studies available (Ferraro et al., Reference Ferraro, Messer, Shukla and Weigel2024). Within the topic of sustainable packaging, it is no different. In a non-experimental study with 305 Indian companies, Choudhary et al. (Reference Choudhary, Jain and Panda2022) find that institutional pressures and resource availability can influence a company to reduce its use of single-use plastics. Abadi (Reference Abadi2023) uses informational interventions (e.g., training sessions and texting) to promote better practices for managing agricultural plastic waste among farmers in Iran and finds that how the information is presented matters. Presenting statistics and linking actions to consequences were the most effective in motivating farmers to adopt practices to improve waste management. In contrast, in an experimental study, Vu et al. (Reference Vu, Tran, Goto and Kawata2020) examine whether information received from their peers can motivate farmers to adopt organic fertilizer. The authors find that the information intervention increased the farmers’ likelihood of using organic fertilizer by 8.1%, whereas a 50% price subsidy increased the likelihood by 28%. Hence, while information can influence producer behavior, its effect can be enhanced when complemented by policy (e.g., a subsidy).
2.4. Can an educational intervention help the adoption for sustainable packaging?
The treatment in this study aims to inform restaurants about sustainable packaging, expanding on the drivers and barriers to sustainable packaging adoption (e.g., consumers’ preferences, lower cost of sustainable packaging, and environmental capabilities and resources). Education campaigns have been shown to reduce plastic waste by consumers. For instance, door-to-door campaigns in conjunction with a policy ban on single-use plastic in the Bay Islands, Honduras, resulted in 50, 80, and 100% reductions in plastic waste in Roatan, Utila, and Guanaja municipalities, respectively (UNEP, 2018). However, little is known about whether educating corporate managers could bring about a similar effect. Wandosell et al. (Reference Wandosell, Parra-Meroño, Alcayde and Baños2021) highlight the importance of training on all aspects related to sustainable packaging and implementation in all industries. However, the question remains whether increased knowledge about sustainable packaging can motivate SMEs to adopt sustainable takeout and delivery packaging.
2.5. Theory of change of research hypothesis
Managers and restaurant owners make decisions about packaging materials to meet their needs based on their motivations and the resources available to them. Their motivation is to provide food service to consumers conveniently. The decision to use single-use plastics is influenced by suppliers and market availability. Although managers and restaurant owners might be aware of the pollution caused by single-use plastics, they often do not realize that they can help reduce this harm.
The theory of change in this study draws from Petty and Cacioppo’s (Reference Petty and Cacioppo1986) seminal conceptual framework, termed the elaboration likelihood model (ELM), which explores how persuasion mechanisms can influence behavioral change. In our study, the training course was implemented as a persuasion mechanism to instill positive attitudes toward sustainable practices in the food service industry of Honduras. The framework suggests that the persuasion mechanism should be cognitively engaging to elicit long-lasting behavioral change, allowing participants to process the content and weigh the logic and quality of the shared information: this is persuasion via the ELM’s “central route.”
Accordingly, the training course was personalized for the regional food industry by including information relevant to sustainable packaging and applicable to managers’ everyday activities, enabling participants to evaluate its logic and quality. The course content addressed the consequences of positive and negative behaviors toward the environment. The expected result of the information intervention is dualistic. Primarily, it is expected to encourage participating restaurants to adopt sustainable packaging practices and products. Secondarily, it is anticipated that the intervention will promote behaviors in the food service industry more broadly, encouraging sustainable packaging and thereby reducing the use of single-use plastic and overpackaging. Therefore, the research hypothesis of this research project is as follows. Additionally, we assumed that participants had sufficient resources to complete the course and the decision-making power to adopt sustainable takeout and delivery packaging options, and a teaching assistant followed up on course completion.
Hypothesis: The information intervention (a sustainable packaging course) instills positive attitudes toward sustainable packaging in restaurant managers, encouraging the adoption of sustainable practices and products and increasing the sustainable takeout and delivery packaging score.
3. Methods
3.1. Recruitment of restaurants
Our study targeted restaurants that provided takeout and delivery in four cities – Tegucigalpa, San Pedro Sula, Comayagua, and Siguatepeque – chosen because of their commercial importance, high population, and connection to one of the country’s primary highways. Tegucigalpa, the capital city, and San Pedro Sula, the industrial capital, are the two largest cities in the country. Unlike the Bay Islands, none of the four regulates the use of single-use plastic.
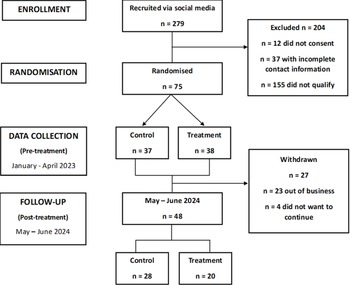
Participants were recruited via posts on the social media accounts (Facebook, LinkedIn, and Instagram) of Zamorano University and the Honduran National Chamber of Tourism’s (abbreviated CANATURH in Spanish) during January and February 2023. Of the 279 restaurants that signed up to participate, 204 were excluded: 155 did not meet the eligibility criteria, 12 registered to participate but declined to consent to data collection after the project was explained to them, and 37 provided incomplete contact information. The remaining 75 restaurants were randomly assigned to either the control or the treatment group. This recruitment strategy resulted in a convenience sample of eligible restaurants that followed one or more social media accounts and were willing to participate in the study.
3.2. Data collection and outcomes
Data were collected in two rounds, one before the information intervention (baseline) and one after the intervention (endline). The first round took place in March through May 2023, with in-person visits to the restaurants within two weeks after acceptance to participate in the study. The second round took place in May and June 2024, with in-person visits to the restaurants approximately nine months after treatment.
In the first-round visits, an enumerator visited each restaurant, and the restaurant’s owner or manager (hereafter, “the manager”) answered a questionnaire. Then, the enumerator collected data on the restaurant’s takeout and delivery packaging materials. The questionnaire included questions on the restaurants’ characteristics: business model, service type, years in business, participation in sustainability initiatives, share of takeout and delivery, average price of a main dish, average daily customers, and number of employees during low and high seasons. Data were also collected on the managers’ demographics: their ownership of the restaurant, education, training in the food or restaurant business, gender, age, and years of experience. The managers were also asked about their sustainability concerns: their knowledge and awareness of how to implement sustainable takeout and delivery packaging, the environmental benefits of sustainable packaging, and the expected effects on operating costs and revenue. The sustainability concern was estimated using the instrument proposed by Grunert et al. (Reference Grunert, Hieke and Wills2014), which consists of 14 statements regarding environmental and social sustainability issues with a five-point Likert scale. All answers were self-reported by the managers. In the second round of visits, the researcher gathered data only on takeout and delivery packaging.
In both rounds, the packaging materials data were collected using an instrument developed by the research team, a sustainable takeout and delivery packaging score (hereafter, “the sustainability score”). This score is the outcome variable of interest in our research project.
3.3. The sustainability score
The sustainability score measures the sustainability of packaging in three dimensions: packaging materials, overpackaging, and add-ons (e.g., cutlery and salsa containers). The first dimension, packaging materials, assesses the sustainability of the materials used in the main dish container: recyclable materials are preferred over nonrecyclable ones, and biodegradable and compostable materials are preferred over recyclable ones. The second dimension, overpackaging, assesses whether elements additional to the main dish container serve a purpose, such as grouping or ensuring quality and safety, rather than being redundant. Finally, the add-on dimension assesses the sustainability of the add-on materials and whether they are optional or always provided (e.g., takeout customers are asked whether they need cutlery, as they might be eating at home and not need it).
The sustainability score for a main dish ranges from 0 to 15. From the score, a sustainability category can be assigned (Table 1). For this research, only the scores of the main dish and its add-ons were used as the outcome variable. Beverage packaging sustainability scores were not used because restaurants have little to no control over the materials in bottles and cups, and the research team expected no change in the beverage scores attributable to the intervention. The sustainability categories were not used because they represented a loss of information on the outcome variable, as it would have meant going from an ordinal scale of 0 to 15 to a categorical variable with four levels. However, the research team strongly encourages using the categories for instructional and other practical purposes.
Sustainable take-out and delivery packaging scores and interpretation

To assign a score, the enumerator must accurately identify the packaging materials, following an identification guide developed by the research team (Appendix 1). Determining the score is relatively simple using an Excel workbook (Appendix 2). Figure 1 outlines the process for estimating the sustainability score.
Estimation steps for sustainable takeout and delivery packaging score.

Figure 1. Long description
The flowchart outlines the process for estimating a sustainable takeout and delivery packaging score. The first step involves selecting a representative main dish. Following this, all materials used in the packaging are identified. The identified materials are then recorded in an Excel workbook. Subsequently, a sustainability score is automatically estimated based on the recorded materials. Finally, the estimated score is reviewed. The flowchart visually represents these steps in a sequential manner, guiding the user through the process of assessing the sustainability of packaging materials.
During the pretreatment data collection, for which the manager was notified of the visit date in advance, the enumerator waited for a representative main dish to be ordered and prepared for takeout or delivery, and then estimated and recorded the sustainability score. For the second round, restaurants were not notified in advance of the visit. The enumerator again requested authorization to order a representative main dish and recorded its sustainability score. Because of high sample attrition, a special data collection protocol had to be followed for the second round (Appendix 3). This protocol provided a guide for contacting and visiting restaurants whose location and contact information had changed; the calculation of the sustainability score was unchanged.
3.4. Treatment: Information intervention
In the treatment group of this RCT, participants were offered a 12-hour online sustainable packaging course designed for the Honduran restaurant industry, focusing on takeout and delivery packaging. The course was made available to the treatment group on May 15, 2023, via Blackboard Ultra. The control group was not offered the course.
The Department of Food Science and Technology of Zamorano University developed the self-paced, online course with the following modules: (1) introduction, (2) traditional packaging materials, (3) environmental situations of packaging, (4) alternative packaging options, and (5) case study. The course included a preliminary section on how to complete an online course successfully.
The introduction reviewed the literature on environmental issues associated with single-use plastic packaging and overpackaging. The traditional packaging materials section provided a detailed description of the available packaging materials in Honduras and their applications in the food industry. The section on environmental aspects of packaging provided examples of materials’ life cycle and post-consumer disposition, as well as activities addressing environmental challenges related to plastic and overpackaging. The next section described alternative packaging materials and containers, trends in their use, and the costs and benefits of revalued and renewable materials. The last section presented a case study on the choice of packaging. After the final module, participants received a list of supplemental and optional resources.
3.5. Randomization of participants
Each of the 75 participating restaurants in the sample was assigned a random number using the function rand in Microsoft Excel. Then, restaurants were sorted in ascending order, and the first 38 were assigned to the treatment group, and the other 37 were assigned to the control group (Figure 2).
CONSORT flow diagram of participants. We could measure post-treatment outcomes for 28 restaurants in the control group and 20 restaurants in the treatment group. The four restaurants that did not want to continue participating were evenly split between groups.

Figure 2. Long description
The flowchart begins with the enrollment phase where 279 participants are recruited via social media. Out of these, 204 participants are excluded due to various reasons such as not consenting, incomplete contact information, or not qualifying. This leaves 75 participants who are randomized into two groups: control with 37 participants and treatment with 38 participants. Data collection occurs from January to April 2023. During the follow-up phase from May to June 2024, 27 participants withdraw, with 23 out of business and 4 not wanting to continue. The final follow-up includes 48 participants, with 28 in the control group and 20 in the treatment group.
3.6. Restaurants’ and managers’ characteristics
Most of the restaurants in the study had an independent business model; a small fraction belonged to a chain or franchise. The most common types of restaurants were specialty and family, in which specialty denotes restaurants that offer a single menu item or a very limited kind of food (e.g., ethnic). Most restaurants were either very new or well established, having been in business for one to five years or more than 15 years. About one in three restaurants had participated in or implemented sustainable initiatives, such as recycling and energy conservation. Finally, at the time of the baseline survey, an average of 45% of the restaurants’ sales were takeout or delivery (Table 2).
Observable characteristics of restaurants, by group

S.D. = standard deviation. *Restaurants are considered specialty if they sell a single item or a limited variety of foods (e.g., ethnic). Exchange rate USD 1 ∼ L25.
Regarding the managers’ observable characteristics, approximately 57% were restaurant owners, and most had completed an associate’s or bachelor’s degree. Additionally, most managers were female, with an average age of 40 and about 15 years of experience in the restaurant industry (Table 3).
Observable characteristics of managers, by group

S.D. = standard deviation.
We checked for balance between the treatment and control groups on the measures of the sustainability score and variables found to be correlated with it, specifically the average price of a main dish, the number of employees during the low season, and the manager’s gender. The average price of a main dish and the number of employees during the low season both had low negative and statistically significant correlation coefficients with the sustainability score (r < 0.4, p < 0.05).
All variables were found to be balanced between the control and treatment groups. The average pretreatment sustainability score of the treatment and control groups was checked using a two-sided t-test; no statistically significant difference between both averages was found (Table 5 t = 0.8618, p-value = 0.3916, 95% CI = [−0.3930, 0.9919]). The mean price of a main dish for the control group was L 204.69, versus L 187.39 for the treatment group. The difference was not statistically different from zero (t = 0.7661, p-value = 0.4462, 95% CI = [−27.74, 62.34]). The mean number of employees during the low season of the control group was 9.2, versus 7.6 for the treatment group. The difference is not statistically different from zero (t = 0.5188, p-value = 0.6063, 95% CI = [−4.6, 7.7]). The qualitative variable gender was found to be associated with the sustainability score, with restaurants with female managers having higher scores. A chi-square test of homogeneity failed to reject the null hypothesis that the proportion of female managers differs by treatment assignment (X-squared = 0.1667, p-value = 0.6831).
Odds ratio of compliance

“.” and “*” denote significance at the 10 and 5%, respectively.
Pretreatment sustainability scores in two rounds of data collection

3.7. Compliance
Participants were categorized as compliers if they were in the treatment group, finished the course, and received a passing grade. Of the 20 treated restaurants, 18 were compliers (approximately 47%). Also considered compliers were control group participants who did not take the course but finished the study. There was no evidence that participants in the control group took the course (always-takers), and so all the final participants in the control group were categorized as compliers.
Compliance was modeled using a logistic regression, with values of 1 for compliers and 0 for noncompliers. The model included the following predictor variables: pretreatment sustainability score, average price of a main dish, average number of customers per day, number of employees during the high season, number of employees during the low season, previous participation in sustainability programs, manager’s age, and years of experience in the restaurant industry. These variables were selected using stepwise regression and the researchers’ criteria.
The model results indicate that only the pretreatment sustainability score and prior participation in sustainability programs were strong predictors of compliance. Participants with higher pretreatment sustainability scores were more likely to be compliers, with a one-unit increase in the sustainability score resulting in an 88% increase in the odds of compliance. Those who previously engaged in sustainability initiatives were 10 times more likely to be compliers (Table 4). While the high predictive power of sustainability programs might suggest that our intervention largely reached sustainability-inclined participants, our descriptive statistics (Table 2) show that only 28% of the treatment group and 40% of the control group had previously participated in at least one sustainability initiative.
3.8. Attrition
Attrition in the control group was 24.3%, and attrition in the treatment group was 47.4%, resulting in an overall attrition rate of approximately 36% (Figure 1). Eighty-five percent of the attrition (27 restaurants) was due to the restaurants’ going out of business, an event that we would not expect to be correlated with the treatment assignment. Of the four restaurants that did not wish to continue participating in the study, two were treated. Although the attrition is substantial and differs across the two groups, the pretreatment sustainability scores for the participants who finished the study are nearly identical and not statistically different between control and treatment groups (t = 0.3296, p-value = 0.7436, 95% CI = [−0.8841, 1.2270]) (Table 5).
The similarity in the pretreatment outcome values, together with field knowledge that the information intervention was unlikely to have affected whether a restaurant went out of business, suggests that missing restaurants are missing independent of potential outcomes. Nonetheless, to improve precision and control for potential differential attrition bias, our econometric approach adds covariates to the estimation procedures for the Intent-to-treat (ITT) and Treatment-effect-on-the-treated (ATT) estimation. As a robustness check, we also applied Lee bounds to the ITT and ATT estimates (Lee, Reference Lee2009).
3.9. Econometric strategy
This study estimates the ITT and ATT effects of an information intervention on the packaging sustainability score of Honduran restaurants using ordinary least squares (OLS) for ITT and two-stage least squares (2SLS) for ATT. Because of the relatively small sample size (n = 48), bootstrapping with 2,000 replications was implemented to obtain standard errors, empirical p-values, and bias-corrected and accelerated (BCa) confidence intervals for ITT and ATT estimators. Furthermore, Lee bounds (Lee, Reference Lee2009) were applied as a robustness check to address possible attrition bias.
Intent-to-treat estimation using OLS. The ITT estimate measures the effect of being assigned to treatment, regardless of compliance. ITT was estimated using OLS, where the dependent variable was the posttreatment sustainability score. The ITT model is as follows: $S.{Score}_{i}=\beta _{0}+\beta _{1}{Group}_{i}+\beta _{2}P.S.{Score}_{i}+X_{i}\delta +\varepsilon _{i}$
where S.Score i is the posttreatment sustainability score, Group i is the treatment assignment (1 for treatment and 0 for control), P.S.Score i is the pretreatment sustainability score, and X i is a vector of control variables including average price of a main dish, employees during the low season, and gender of the manager, which were found to be correlated with the sustainability score. β i and δ are parameters to be estimated and ϵ i is the error term.
Treatment-effect-on-the-treated using 2SLS. Given that not all participants in the treatment group complied with the intervention, the ATT effect was estimated using instrumental variables via 2SLS, with treatment assignment as the instrumental variable for actual compliance. In the model, the first stage predicts compliance, and the second estimates the ATT effect.
First stage equation: ${Compliance}_{i}=\gamma _{0}+\gamma _{1}{Group}_{i}+v_{i}$
where Compliance i is compliance, Group i is the treatment assignment, γ i are parameters to be estimated, and v i is the error term.
Second stage equation: $S.{Score}_{i}=\beta _{0}+\beta _{1}{Compliance}_{i}+\beta _{2}P.S.{Score}_{i}+X_{i}\delta +\varepsilon _{i}$
where S.Score i is the posttreatment sustainability score, Compliance i is compliance, P.S.Score i is the pretreatment sustainability score, and X i is a vector of control variables including average price of a main dish, employees during the low season, and gender of the manager, which were found to be correlated with the sustainability score. β i and δ are parameters to be estimated and ϵ i is the error term.
Lee bounds estimation. To assess the robustness of the estimated treatment effects given the observed high attrition, the Lee bounds method (Lee, Reference Lee2009) was applied to obtain upper and lower bounds of the treatment effects by adjusting for differential attrition in the treatment and control groups. To address the higher attrition in the treatment group, the Lee bounds method trims the control group to match the lower retention rate observed in the treatment group, accounting for worst-case and best-case scenarios: the lower bound accounts for the worst-case scenario while the upper bound accounts for the best-case scenario.
The lower bound assumes that the missing observations in the treatment group would have had the lowest potential outcomes. Then, the control group’s highest values are trimmed until the retention rate matches the treatment group’s. The lower bound treatment effect is computed as follows: $LB_{{lower}}=E[S.{Score}| {Group}=1]-E[S.{Score}| {Group}=0,{trimmed}]$
The upper bound assumes that the missing observations in the treatment group would have had the highest potential outcomes. Then, the control group’s lowest values are trimmed until the retention rate matches the treatment group’s. The upper bound treatment effect is computed as follows: $LB_{{upper}}=E[S.{Score}| {Group}=1]-E[S.{Score}| {Group}=0,{trimmed}]$
3.10. Power calculations
The minimum detectable effect was calculated using a type 1 error of 5%, a type 2 error of 20% (i.e., 80% power), a sample size of 48 (after accounting for attrition), and a residual standard deviation of 2.757 (estimated from the 2SLS regression). Under these assumptions, the study can detect a treatment effect of at least 1.12 points in the sustainability score.
4. Results and discussion
Due to our relatively small sample size, attrition and compliance challenges, and low power, our results should be interpreted as exploratory rather than definitive evidence of the effectiveness of information interventions on restaurants in Honduras adopting sustainable takeout and delivery packaging.
4.1. Descriptive statistics
For the 48 restaurants at endline, the overall pretreatment and posttreatment sustainability score mean values were 9.2 (S.D. = 1.5) and 7.2 (S.D. = 3.1), respectively. That is, the sustainability score fell and became more dispersed. Both control and treatment groups experienced this negative trend and increased variability (Figure 3).
Sustainability score distribution, by group assignment.

Figure 3. Long description
A histogram showing sustainability score distribution by group assignment. The x-axis represents sustainability scores ranging from 0 to 15, while the y-axis represents density values from 0 to 0.25. The histogram includes two groups: control and treatment, each with pre-treatment and post-treatment data. The control group’s pre-treatment data is represented by a red shaded area, while the post-treatment data is shown in green. Similarly, the treatment group’s pre-treatment data is in red, and the post-treatment data is in green. The control group shows a higher density of sustainability scores around 10 pre-treatment, which shifts slightly post-treatment. The treatment group exhibits a more evenly distributed density pre-treatment, with a noticeable shift towards higher sustainability scores post-treatment. The data suggests an improvement in sustainability scores post-treatment for both groups, with a more pronounced change in the treatment group. All values are approximated.
4.2. Treatment effects
The ITT estimates the effect of being assigned to treatment, regardless of whether participants complied. In this study, the ITT analysis does not provide statistically significant evidence that assignment to the intervention influenced the sustainability score. The estimated effect is negative (−0.86), and the bootstrapped 95% BCa confidence interval includes zero, indicating uncertainty regarding the direction and magnitude of the effect. Additionally, the pretreatment sustainability score is positively associated with the posttreatment sustainability score (r = 0.712), suggesting that restaurants with higher initial scores tend to maintain higher scores over time (Table 6). Therefore, assignment to the information intervention did not result in a statistically measurable change in posttreatment sustainability scores.
Intent-to-treat effect estimation results

Standard errors are bootstrapped, and p-values are empirical from 2,000 replications. Confidence intervals are bias-corrected and accelerated.
Table 7 presents the results of the first-stage regression of the 2SLS estimation of the ATT, where treatment compliance is regressed on assignment to the treatment group. The F-statistic for the instrument is 30.17, above the conventional threshold of 10, indicating that the instrument is strong. Treatment assignment is a strong predictor of compliance: being assigned to the treatment group is associated with a 52.6% average decrease in the probability of compliance. The negative sign of the coefficient can be attributed to the fact that non-compliers were only present in the treatment group.
First-stage results from 2SLS estimation

R2/Adj. R2: 0.32/0.31, F-statistic: 30.17 (p < 0.001).
The ATT estimates the causal effect of the information intervention on the individuals who completed the course (i.e., compliers). However, compliance is not random. As shown in Table 4, compliers are positively determined. Restaurants with higher pretreatment sustainability scores and prior participation in sustainability initiatives were significantly more likely to complete the intervention. Consequently, the ATT should be interpreted as the effect of the intervention on a highly selected subgroup of already more sustainability-oriented and engaged restaurants, rather than as a population-wide effect. This selection implies that the ATT may not generalize to less engaged restaurants and may reflect outcomes among participants who were already closer to adopting sustainable practices.
The ATT analysis does not provide statistically significant evidence that the intervention raised the sustainability score, as intended. As with the ITT, although the estimate suggests a negative effect, the confidence interval includes zero, suggesting uncertainty regarding the direction and magnitude of the effect. According to the ATT model, the covariate of the pre-treatment sustainability score is the best predictor of the post-treatment sustainability score (Table 8).
Treatment-effect-on-the-treated estimation results

Standard errors are bootstrapped, and p-values are empirical from 2,000 replications.Confidence intervals are bias-corrected and accelerated.
As a robustness check, ITT and ATT effects were estimated using bootstrapped Lee bounds with 1,000 replications to obtain 95% confidence intervals. The upper bound of the ITT estimate suggests the effect of treatment assignment could be positive but modest in size, approximately equivalent to a 10.4% increase in the sustainability score relative to the control group mean, or approximately 0.21 standard deviations. In contrast, the upper bound of the ATT estimate is larger, suggesting that for compliers, the intervention could be associated with up to a 28% increase in the score, or about 0.60 standard deviations. (Figure 4).
Lee bounds for ITT and ATT effect estimates, with confidence intervals.

Figure 4. Long description
A horizontal box-and-whisker plot compares the effect size estimates for ITT and ATT. The x-axis represents the effect size ranging from -12 to 0, while the y-axis lists the categories: ITT Upper, ITT Lower, ATT Upper, and ATT Lower. Each box plot includes a median line, upper and lower quartiles, and whiskers indicating the range of data. The ITT Lower box plot extends from approximately -12 to -4, with a median around -8. The ITT Upper box plot ranges from around -2 to 0, with a median near -1. The ATT Lower box plot spans from approximately -12 to -4, with a median around -8. The ATT Upper box plot ranges from around -2 to 0, with a median near -1. The confidence intervals are represented by horizontal lines extending from the boxes. The plot highlights the variability and central tendency of the effect size estimates for both ITT and ATT.
The sustainability score unexpectedly fell from the first to the second round of data collection, suggesting less sustainable takeout and delivery packaging in both treatment and control groups. No major events or policies that could explain this decrease, such as trade disruptions limiting access to sustainable packaging alternatives, were identified during the period of study (White et al., Reference White, Wang and Li2015). Possible reasons include changes in packaging practices, such as switching from compostable or biodegradable materials to plastic or increasing overpackaging. In a systematic literature review by Afif et al. (Reference Afif, Rebolledo and Roy2022), availability and cost were identified as potential barriers to the adoption of sustainable packaging alternatives. In Honduras, it is likely that restaurants may have more limited control than anticipated over packaging supply and cost. Although a catalog of sustainable packaging suppliers was created by the research team and distributed as supplementary material during the course, small suppliers might have lacked the capacity to meet demand, leaving restaurants to choose less eco-friendly options. The lower sustainability score could be linked to these factors, combined with methodological issues like sample size and noncompliance, which likely hindered the detection of a positive effect from the intervention.
Our results, however, are similar to others in the literature. The lack of statistical significance in the reduction of plastic consumption from an online education treatment for consumers is found in Heidbreder and Schmitt (Reference Heidbreder and Schmitt2020). On the producer side, Vu et al. (Reference Vu, Tran, Goto and Kawata2020) find that the effect from farmers’ choosing to use organic fertilizer is increased when combined with policy. Borg et al. (Reference Borg, Lennox, Kaufman, Tull, Prime, Rogers and Dunstan2022) argue that change in individual behavior is limited and should be complemented with further actions by businesses and government. In our case, it would seem that the course by itself provided little if any influence on the decision to adopt more sustainable packaging. Government action, such as encouraging more options of sustainable packaging at an affordable price, may be needed.
5. Conclusion and policy implications
The objective of this study was to assess the effect of an information intervention (a course on sustainable takeout and delivery packaging) on the practices of Honduran restaurants. For this, an exploratory randomized control trial with two levels was designed, and ITT and ATT effects were estimated. The ITT and ATT analyses did not provide statistically significant evidence that the intervention improved the participating restaurants’ sustainable takeout and delivery packaging score, most likely because of low statistical power to detect small to moderate treatment effects.
From a policy perspective, it is important not to conclude that this is evidence that information interventions are not effective at positively influencing behavior towards sustainable practices by restaurant managers. As discussed, our study experienced attrition and compliance issues and was underpowered, limiting our ability to detect meaningful treatment effects. However, our results, paired with existing literature, suggest that information interventions alone are insufficient to influence the adoption of sustainable practices, especially among sustainability-inclined businesses. Thus, our findings support collaborative supply chain and policy approaches that complement informational interventions (e.g. subsidies) with actions that lower the structural barriers of cost, procurement, and regulation.
5.1. Recommendations for researchers
In future RCTs that evaluate information interventions to improve the environmental performance of Latin American firms, researchers and practitioners should plan for high non-compliance and attrition, in both the design and the analysis. Studies with low statistical power and small samples are common among published peer-reviewed studies in environmental and natural resource economics (Ferraro and Shukla, Reference Ferraro and Shukla2020) and ecology journals (Kimmel et al., Reference Kimmel, Avolio and Ferraro2023). For instance, case studies are a common approach in multi-country studies (Ferraro and Agrawal, Reference Ferraro and Agrawal2021).
Accumulating underpowered RCTs over time and then synthesizing them via meta-analyses has been an important path for advancing medicine but is less common in the field of environmental economics. In a recent special edition of PNAS, including only studies with a statistical power of 80% or more would have meant a loss in information on the potential effect of community monitoring (Ferraro and Agrawal, Reference Ferraro and Agrawal2021).
Supplementary material
The supplementary material for this article can be found at https://doi.org/10.1017/aae.2026.10048.
Data availability statement
The data that support the findings of this study are available from the corresponding author. The data is not publicly available because additional research is being conducted on the same dataset.
Acknowledgments
The authors would like to acknowledge the Honduran Chamber of Tourism, the Restaurants Association of Honduras, and Zamorano University for their support in participant recruitment, and Paul Ferraro and Nathan Fiala for their advice.
Author contribution
Conceptualization: LS, AS, SM. Data curation: LS, BM. Formal analysis: LS, AS. Funding acquisition: LS, AS. Investigation: LS, BM. Methodology: LS, AS, PF. Project administration: LS. Resources: LS, BM. Software: LS. Supervision: LS. Validation: LS, AS. Visualization: LS, AS. Writing original draft: LS, AS, SM, BM. Writing, review, and editing: LS, AS, SM, PF.
Financial support
Funding for this research was provided by the Inter-American Development Bank via technical cooperation RG-T4014 “Knowledge for Managing Local Pollution in LAC.”
Competing interests
The authors declare no competing interests.
AI contributions
AI, specifically Grammarly, was used to assist with the manuscript’s editing. ChatGPT was used to assist in correcting R code used for statistical analysis.




 Open access

