





GRONINGEN
While still a physics student in the Netherlands in 1972 I came upon a book entitled Inadvertent Climate Modification (Matthews Reference Matthews, Kellogg and Robinson1971). A crucial part of the book was the first decade of Dave Keeling’s CO2 record at Mauna Loa, which showed a clear increase every single year (still true today, 50 years later!). That book convinced me that CO2 emissions could become a serious global problem, and I decided to change my future career from physics to earth sciences!
Keeling started the modern atmospheric CO2 record in 1957 in several places: Antarctica, near the summit of the Mauna Loa volcano on Hawai’i, on the Scripps Pier in La Jolla, California, and on ships (https://keelingcurve.ucsd.edu/). He chose an infrared absorption method, thoroughly supported by very careful calibrations. With the wet chemical methods used before Keeling the measurement noise was so large that any interpretation of changes in the global CO2 content was hazardous. Before air bubbles trapped in ice cores became the method of choice, isotopic ratios in tree rings presented a possible alternative way to extend the modern CO2 record back in time, or to at least learn something about the carbon cycle. Wim Mook, the director of “Isotopenfysica”, the environmental isotope section in the physics lab of the University of Groningen, took me on as a PhD candidate in 1973 to measure and interpret isotopic ratios in tree rings. We scoured the Netherlands for old trees, but there were not many. Ship building in previous centuries had taken care of that. We could get slabs of four trees, felled by a wind storm, going back to the middle of the 19th century. Wim asked me to build a proportional counter with capacity for large samples, so that our 14C measurements could be very precise. After some experimentation I built a system of 7 identical proportional counters, about 1 m long and 4 cm diameter each, with 6 closely packed around the central one. Purified CO2 sample gas filled the counters at 6 bar of pressure. Each sample required a substantial bag of wood chips cut from one ring, to produce a counting rate of 240 14C counts per minute, and relative precision of 1.3 permil in 2 days of counting (Tans and Mook Reference Tans and Mook1979). We counted a few samples for 3 days, just so that we could reach 1.0 permil. The Suess effect stood out beautifully in our tree ring data up to 1950, and we also saw a hint of the 11-year solar cycle in the oldest samples. We used the 14C bomb spike in 1963 to confirm that there was no transport of carbon between adjacent rings after different chemical pre-treatments of the wood before combustion to CO2.
At the same time I was measuring 13C/12C and 18O/16O in the same tree rings to document the 13C/12C signature of the Suess effect. The isotope ratios turned out to be difficult to interpret. We found enormous variability between the years and between trees. There appeared to be a decrease of 13C/12C from 1850 to 1900, but in the 20th century the trend went in the “wrong” direction. Since we had large slabs of the four trees we could sample the entire circumference of each ring. Within-ring variations were up to ∼4.5‰, but correlated strongly between adjacent rings. Alas, our chosen (free-standing) trees had not evolved with our application in mind; there were clearly other and larger influences on the 13C/12C signature than the Suess Effect, at least up to 1970. In early 1978, a few months before my thesis defense, Wim Mook and I attended a climate conference in Vienna, at which H. Freyer showed results obtained from a few dozen trees (Freyer and Wiesberg Reference Freyer and Wiesberg1973; Freyer Reference Freyer1979). His average 13C/12C ratio declined by about 1‰ from 1900 to 1970. This decline was 2/3 of what he could expect when he took the estimated CO2 increase from 1900 to 1970, assigned the fossil fuel isotopic signature to it, and then diluted that in the atmosphere with an estimated pre-industrial isotopic signature.
I knew by then that the measured decrease shown by Freyer had to be too large as a global number. I was convinced of that because during the writing of my thesis I had developed a simple and intuitive way to deal with isotopic ratios and exchanges between reservoirs (Tans et al. Reference Tans, Berry and Keeling1993). In the following 12Ca, 13Ca, and Ca denote atmospheric abundances. Here we only consider exchange with the oceans in some detail, but other carbon reservoirs such as terrestrial plants and soils can be treated similarly. When writing abundance ratios not as Ra = 13Ca/12Ca but as the ratio of 13Ca to total carbon, Ra = 13Ca/(12Ca+13Ca) = 13Ca/Ca, one gets 13Ca = Ra Ca. The change in time of 13Ca can then be split into two components,
 $${\rm{d}}{(^{{\rm{13}}}}{{\rm{C}}_{\rm{a}}})/{\rm{dt}} = {\rm{d}}({{\rm{R}}_{\rm{a}}}{{\rm{C}}_{\rm{a}}})/{\rm{dt}} = {{\rm{C}}_{\rm{a}}}{\rm{d}}{{\rm{R}}_{\rm{a}}}/{\rm{dt}} + {{\rm{R}}_{\rm{a}}}{\rm{d}}{{\rm{C}}_{\rm{a}}}/{\rm{dt}}.$$
For air-sea gas exchange we have
 $$\matrix{
{{\rm{d}}{{\rm{C}}_{\rm{a}}}/{\rm{dt}} = {{\rm{F}}_{{\rm{fos}}}} + {{\rm{F}}_{{\rm{oa}}}} - {{\rm{F}}_{{\rm{ao}}}}{\mkern 1mu} {\rm{and}}} \cr
{{\rm{d}}{(^{{\rm{13}}}}{{\rm{C}}_{\rm{a}}})/{\rm{dt}} = {{\rm{R}}_{{\rm{fos}}}}{{\rm{F}}_{{\rm{fos}}}} + {\alpha _{{\rm{oa}}}}{{\rm{R}}_{\rm{o}}}{{\rm{F}}_{{\rm{oa}}}} - {\alpha _{{\rm{ao}}}}{{\rm{R}}_{\rm{a}}}{{\rm{F}}_{{\rm{ao}}}}.} \cr
} $$
$$\matrix{
{{\rm{d}}{{\rm{C}}_{\rm{a}}}/{\rm{dt}} = {{\rm{F}}_{{\rm{fos}}}} + {{\rm{F}}_{{\rm{oa}}}} - {{\rm{F}}_{{\rm{ao}}}}{\mkern 1mu} {\rm{and}}} \cr
{{\rm{d}}{(^{{\rm{13}}}}{{\rm{C}}_{\rm{a}}})/{\rm{dt}} = {{\rm{R}}_{{\rm{fos}}}}{{\rm{F}}_{{\rm{fos}}}} + {\alpha _{{\rm{oa}}}}{{\rm{R}}_{\rm{o}}}{{\rm{F}}_{{\rm{oa}}}} - {\alpha _{{\rm{ao}}}}{{\rm{R}}_{\rm{a}}}{{\rm{F}}_{{\rm{ao}}}}.} \cr
} $$
The symbol “F” stands for fluxes, with the subscript “ao” meaning “from atmosphere to oceans”, etc. Fao is governed by the partial pressure of CO2 at the air-water interface which closely follows Ca. Ro is the isotopic ratio of surface ocean carbon, and the alphas are kinetic isotopic fractionation factors, slightly different from 1, for air-sea gas exchange in both directions. The previous three expressions lead to
 $${{\rm{C}}_{\rm{a}}}\ {\rm{d}}{{\rm{R}}_{\rm{a}}}/{\rm{dt}} = {{\rm{F}}_{{\rm{fos}}}}({{\rm{R}}_{{\rm{fos}}}}-{{\rm{R}}_{\rm{a}}})-{{\rm{F}}_{{\rm{ao}}}}({\alpha _{{\rm{ao}}}} - {\rm{1}})\,{{\rm{R}}_{\rm{a}}} + {{\rm{F}}_{{\rm{oa}}}}({\alpha _{{\rm{oa}}}}{{\rm{R}}_{\rm{o}}}-{{\rm{R}}_{\rm{a}}})$$
If the oceans are (on average) in equilibrium with the atmosphere we have both Foa = Fao and αoaRo = αaoRa. We can define Ra eq as the isotopic ratio the atmosphere would have if it were completely determined by equilibrium with the surface oceans, Ra eq = (αoa/αao)Ro. The factor αoa/αao is the temperature dependent isotopic equilibrium ratio between the atmosphere and total dissolved inorganic carbon (DIC) in the surface oceans. Because we are talking here about the global average flux we need an average that is weighted by the product of area, dissolved CO2 (see below), and rate of air-sea gas exchange. The latter is correlated with wind speed for which we can take climatological averages. The factor Ro is very nearly the same almost everywhere in the surface oceans. We will come back to this later. Using Ra eq we can separate the effect of total carbon fluxes (Fao – Foa) and the pure isotopic fluxes in the last term of Equation (1):
 $$\matrix{
{{{\rm{C}}_{\rm{a}}}{\rm{d}}{{\rm{R}}_{\rm{a}}}/{\rm{dt}} = {{\rm{F}}_{{\rm{fos}}}}\left( {{{\rm{R}}_{{\rm{fos}}}} - {{\rm{R}}_{\rm{a}}}} \right) - {{\rm{F}}_{{\rm{ao}}}}\left( {{\alpha _{{\rm{ao}}}} - {\rm{1}}} \right){\mkern 1mu} {{\rm{R}}_{\rm{a}}} + {{\rm{F}}_{{\rm{oa}}}}\left( {{\alpha _{{\rm{ao}}}}{{\rm{R}}_{\rm{a}}}^{{\rm{eq}}} - {{\rm{R}}_{\rm{a}}}} \right),{\mkern 1mu} {\rm{and}}{\mkern 1mu} {\rm{after}}{\mkern 1mu} {\rm{some}}{\mkern 1mu} {\rm{regrouping}}} \hfill \cr
{{{\rm{C}}_{\rm{a}}}{\rm{d}}{{\rm{R}}_{\rm{a}}}/{\rm{dt}} = {{\rm{F}}_{{\rm{fos}}}}({{\rm{R}}_{{\rm{fos}}}} - {{\rm{R}}_{\rm{a}}}) - ({{\rm{F}}_{{\rm{ao}}}} - {{\rm{F}}_{{\rm{oa}}}}){\mkern 1mu} ({\alpha _{{\rm{ao}}}} - {\rm{1}}){\mkern 1mu} {{\rm{R}}_{\rm{a}}} + {{\rm{F}}_{{\rm{oa}}}}{\alpha _{{\rm{ao}}}}({{\rm{R}}_{\rm{a}}}^{{\rm{eq}}} - {{\rm{R}}_{\rm{a}}})} \hfill \cr
} $$
$$\matrix{
{{{\rm{C}}_{\rm{a}}}{\rm{d}}{{\rm{R}}_{\rm{a}}}/{\rm{dt}} = {{\rm{F}}_{{\rm{fos}}}}\left( {{{\rm{R}}_{{\rm{fos}}}} - {{\rm{R}}_{\rm{a}}}} \right) - {{\rm{F}}_{{\rm{ao}}}}\left( {{\alpha _{{\rm{ao}}}} - {\rm{1}}} \right){\mkern 1mu} {{\rm{R}}_{\rm{a}}} + {{\rm{F}}_{{\rm{oa}}}}\left( {{\alpha _{{\rm{ao}}}}{{\rm{R}}_{\rm{a}}}^{{\rm{eq}}} - {{\rm{R}}_{\rm{a}}}} \right),{\mkern 1mu} {\rm{and}}{\mkern 1mu} {\rm{after}}{\mkern 1mu} {\rm{some}}{\mkern 1mu} {\rm{regrouping}}} \hfill \cr
{{{\rm{C}}_{\rm{a}}}{\rm{d}}{{\rm{R}}_{\rm{a}}}/{\rm{dt}} = {{\rm{F}}_{{\rm{fos}}}}({{\rm{R}}_{{\rm{fos}}}} - {{\rm{R}}_{\rm{a}}}) - ({{\rm{F}}_{{\rm{ao}}}} - {{\rm{F}}_{{\rm{oa}}}}){\mkern 1mu} ({\alpha _{{\rm{ao}}}} - {\rm{1}}){\mkern 1mu} {{\rm{R}}_{\rm{a}}} + {{\rm{F}}_{{\rm{oa}}}}{\alpha _{{\rm{ao}}}}({{\rm{R}}_{\rm{a}}}^{{\rm{eq}}} - {{\rm{R}}_{\rm{a}}})} \hfill \cr
} $$
If desired, Equation (1) can be easily recast in terms of the customary delta notation by dividing every R by Rstd, where the standard is PDB and it has also been redefined as the ratio of 13Cstd to total carbon Cstd. Then Rx/Rstd = 1+δx. In this way the redefined numerical value of δ changes by a factor of 1-Rstd, which is very close to (1-0.011). The middle term of Equation (1) is the effect on the atmospheric isotopic ratio of a net total CO2 flux (Fao –Foa) into the oceans, and αao is ∼0.998, very close to 1, so that this contribution is close to zero. The case of exchange between the atmosphere and terrestrial ecosystems is different. Isotopic fractionation during photosynthesis is much larger, with α = ∼0.98, so then the middle term is important. The last term in Equation (1) describes pure isotopic equilibration that always takes place regardless of what the net total flux is.
Net exchange of total CO2 on the water side is controlled by fast equilibrium reactions between dissolved CO2 and HCO3 − and CO3 −2 ions, collectively called dissolved inorganic carbon (DIC). If the relative increase of atmospheric CO2 is 10%, chemical equilibrium between the atmosphere and oceans is restored when the relative increase of DIC is only about 1% and the pH is lowered. This difference of a factor of ∼10 is called the Revelle factor (Broecker et al. Reference Broecker, Takahashi, Simpson and Peng1979). Therefore the upper ocean mixed layer is equilibrated relatively quickly, and needs to be replaced by deeper waters to restart CO2 uptake. The Revelle factor does not apply to isotopic equilibration because a 12CO2 molecule is replaced by a 13CO2 or vice versa. As a result, an isotopic anomaly disappears from the atmosphere more quickly than a total CO2 anomaly. The last term of Equation (1) is proportional to the global one-way flux Fao (or Foa, they are almost the same) which in 1970 was estimated to be about 80 billion metric ton carbon (GtonC) per year, and today about 100 GtonC/yr because of higher atmospheric CO2 and dissolved CO2 in surface waters.
Because Freyer’s observed decrease of 13C/12C in tree rings appeared to be too large, as explained in the previous paragraphs, I questioned him, and it turned out that he had selected a subset of the trees that were sampled. All trees had been selected for location, not in a forest, but in places with good access to “clean” air, such as facing the ocean in the prevailing winds. However, when the measurement results of a tree showed features that appeared to contradict his expectations, he found reasons to not consider those results. I thought that was embarrassing. Minze Stuiver and colleagues, in a paper discussing many of the potential problems with the reconstruction of atmospheric CO2 from tree rings, also found it hard to reconcile Freyer’s record with atmospheric history going back a few centuries (Stuiver Reference Stuiver, Burk and Quay1984).
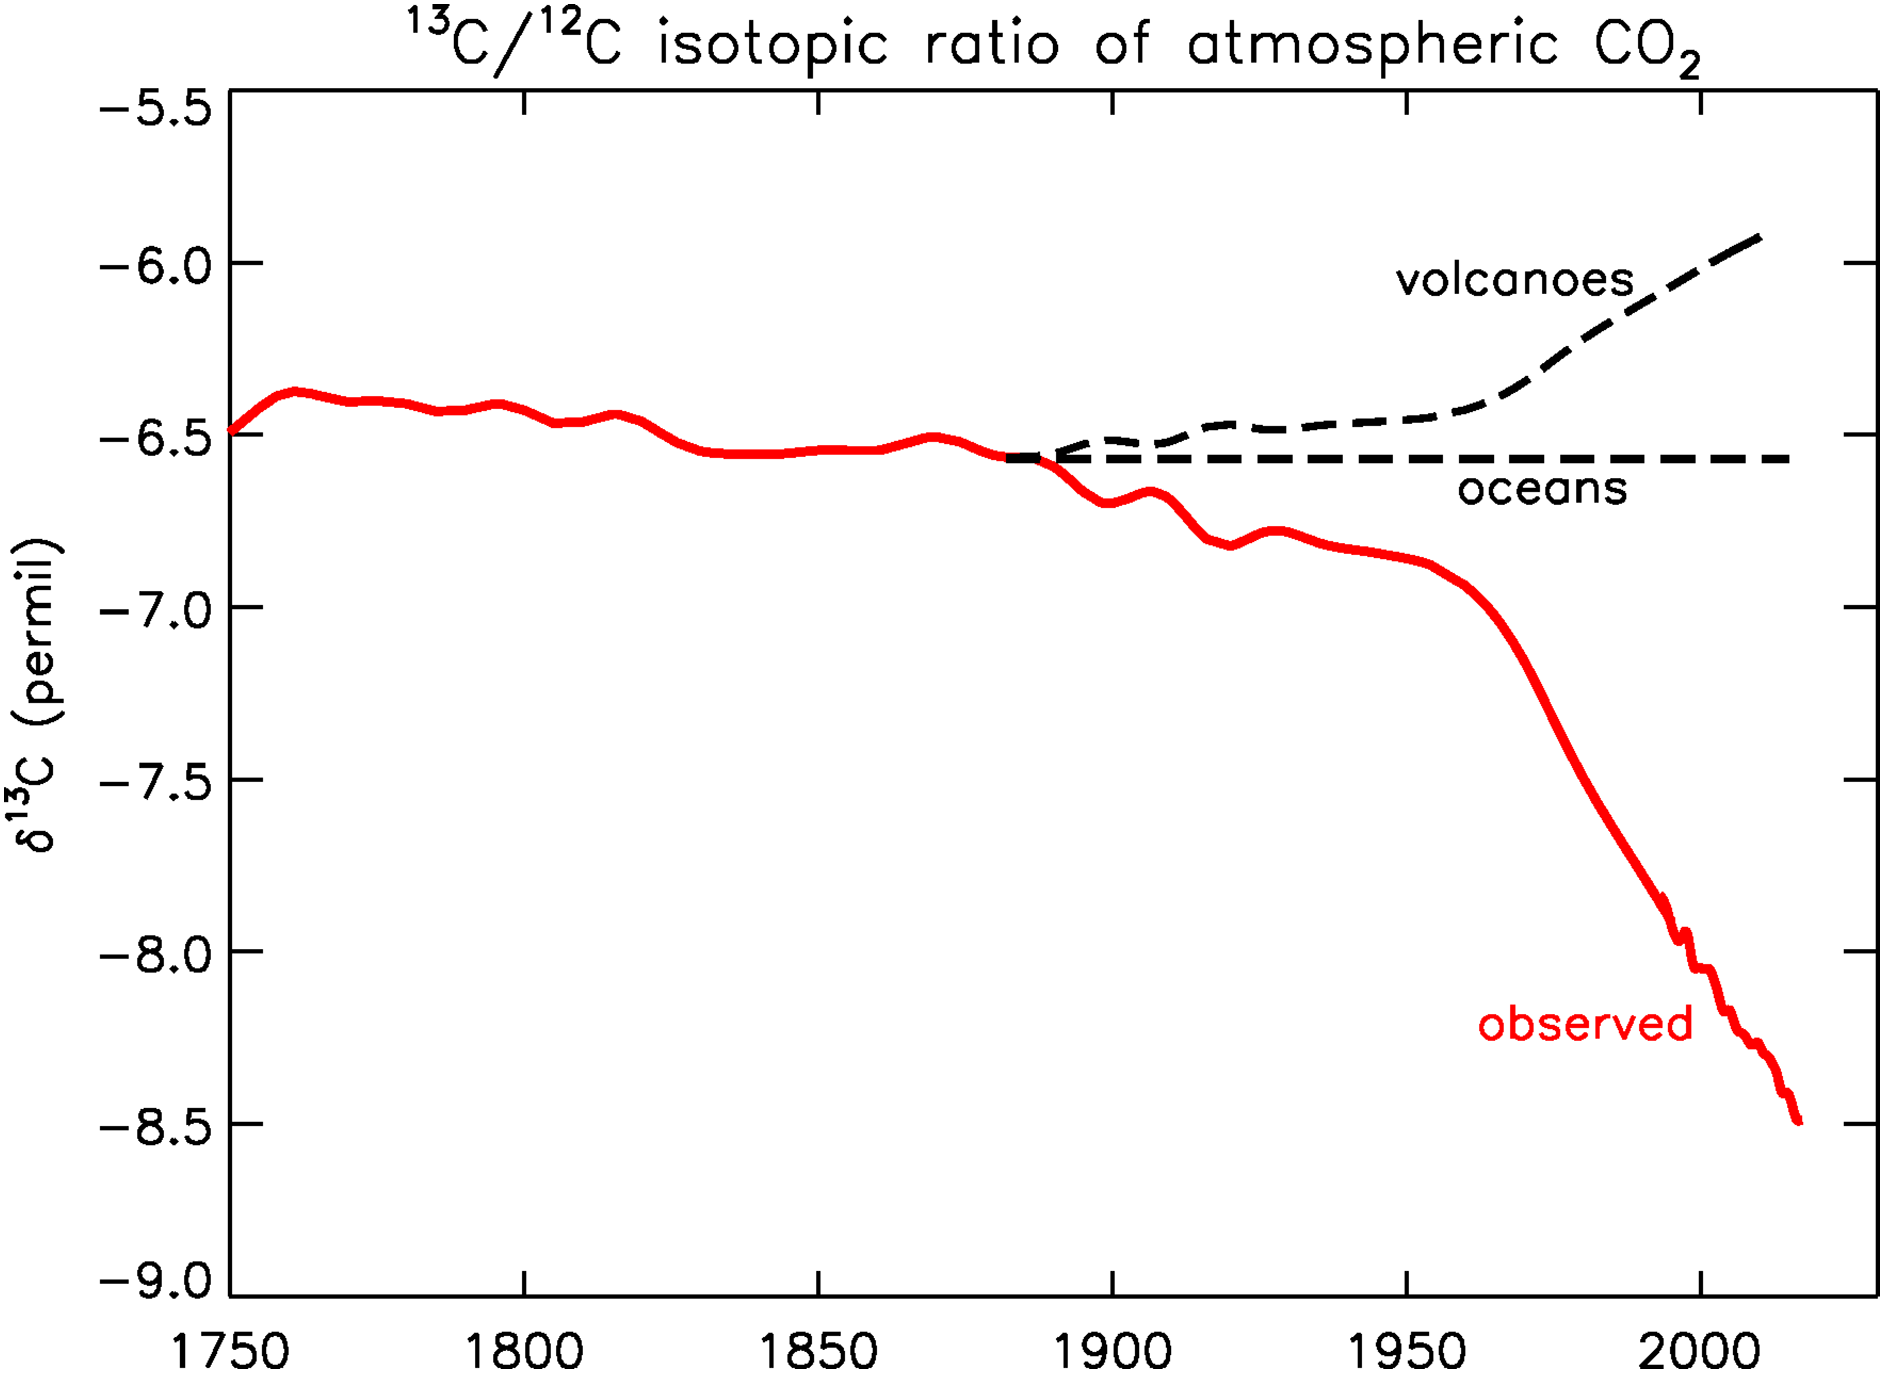
Today, many years later, we have obtained a good record of recent pre-industrial 13C/12C and CO2 from ice cores, especially the high-resolution record from Law Dome in coastal Antarctica (Francey et al. Reference Francey, Ellison, Etheridge, Trudinger, Enting, Leuenberger, Langenfelds and Steele1999). The ice core data show that δ13C decreased from –6.7 to –6.9‰ between 1900 and 1950. After 1950 the rate of decrease accelerated, in 1970 δ13C was –7.2‰, and in 2019 –8.5‰ (Figure 1). The Law Dome record matches well with NOAA/Global Monitoring Laboratory (GML)’s Global Greenhouse Gas Reference Network (GGGRN) for many gases and isotopic ratios (https://gml.noaa.gov/ccgg/trends/).
Observed 13C/12C ratio of atmospheric CO2 (red). After 1992, data from Inst. Arctic and Alpine Research (INSTAAR), U. of Colorado; Before 1992, Francey et al. (Reference Francey, Ellison, Etheridge, Trudinger, Enting, Leuenberger, Langenfelds and Steele1999). Dashed black lines, hypothetical atmospheric histories if the CO2 enhancement had been produced by volcanism or by ocean outgassing. (Please see electronic version for color figures.)
NOAA
After my PhD defense in Groningen in 1978 our family moved to the Scripps Institution of Oceanography for my postdoc with Dave Keeling. After Scripps I did a six-year stint with the astrophysics group in Lawrence Berkeley Lab in Berkeley, CA, where I worked on measurements of 14C with the 88” cyclotron, and on trying to develop extremely precise measurements of the O2/N2 ratio of atmospheric air, using Raman scattering. Neither project was successful. The O2/N2 project was done with NOAA funding, which led to my move to NOAA in 1985 at the invitation of Lester Machta, who was then director of NOAA’s Air Resources Laboratory.
We now come back to the globally weighted average Ra eq which exerts a major influence on the isotopic ratio of atmospheric CO2. We participated in the research cruise GasEx98, in the early summer of 1998, in the mid North Atlantic on the NOAA ship Ron Brown. The aim was to better quantify the process of air-sea gas exchange so that the atmosphere would tell us more about the oceans and vice versa. Two groups made independent atmospheric measurements using both eddy covariance and vertical gradients. One was a collaboration of Rik Wanninkhof and Wade McGillis (Reference Wanninkhof and McGillis1999), and the second group consisted of Jim Smith, Michael Hahn and myself of GGGRN. The measurements were very hard because average vertical gradients from the top of a mast near the bow to 1–2 m above the water were only a small fraction of 1 ppm. There were also many potential artifacts to avoid, caused by ship motion, flow distortion around the ship, salt and moisture in the air intake lines, and more. Eddy covariance relies on tiny differences in mole fraction between up- and down-going eddies. Jim thought he had a correlation signal until he shut down the flow through the analyzer—the signal remained! When the air in the analyzer cell does not change at all there should be no correlation with vertical wind velocity variations (which had already been corrected for ship motion). When he turned the orientation of the analyzer 90 degrees, the signal changed in magnitude but did not go away. He traced it to torques exerted by the ship motion on the optical beam chopper wheel which changed the on-off timing by small amounts. The other group also had an optical chopper, but they believed their data to be good enough to give them evidence to conclude that the air-sea gas transfer velocity depends on the third power of wind speed (Wanninkhof and McGillis Reference Wanninkhof and McGillis1999). I argued—in vain—that a cubic would upset the global Ra eq value by giving more weight to cold waters at southern high latitudes and less weight to warm waters at low latitudes. δa eq (as in Ra eq = 1+δa eq) increases with temperature by 0.114‰/K. δa eq over 0oC waters is –9.8‰, over 26oC waters −6.8‰. The cubic relationship would have pushed pre-industrial global δ13C to become lower, well outside the observed range of –6.5 to –6.3‰ (Francey et al. Reference Francey, Ellison, Etheridge, Trudinger, Enting, Leuenberger, Langenfelds and Steele1999) assuming that other factors remain equal. As far as I can tell, the cubic has quietly disappeared by now. This story also illustrates how difficult it can be to get reliable observational data for the very small differences that drive carbon exchange on large spatial scales.
FOSSIL FUELS AND THE GLOBAL CARBON BUDGET
The observed atmospheric history of 13C/12C tells us in a qualitative way that the sources of the CO2 enhancement must be of an organic nature, either modern or old, as shown in Figure 1. Photosynthesis depletes 13C/C by about 20‰ relative to its atmospheric source, and the observed atmospheric history reflects that. It has been argued by fossil fuel apologists that the CO2 explosion observed in the atmosphere is not caused by the burning of coal, oil, and natural gas. No, they say that it comes from the oceans, or from volcanoes. If a sustained ocean “burp” is the cause, the 13Ca/Ca ratio would not have changed, as is sketched in Figure 1, because the atmospheric ratio has been (nearly) in equilibrium with the ocean surface over geologic times. In fact, the total amount of carbon in DIC was ∼60 times larger than in the atmosphere during the Holocene, so the oceans “dictate” the 13Ca/Ca ratio in the long term. If the cause is volcanic, the recent atmospheric ratio would have become more enriched because volcanic CO2 has a 13C/C ratio close to that of the standard PDB, which is a limestone, or ∼0 ‰. It has been sketched in Figure 1 as a scaled mirror image (w.r.t. the constant level labeled “oceans”) of the red curve.
Also in the case of 14C the Revelle factor does not apply, but the nuclear bomb 14C peak’s observed decay in the atmosphere has nevertheless caused much confusion for the climate debate. It has been used to argue, especially in circles receiving money from the coal and oil/gas industry (Oreskes and Conway Reference Oreskes and Conway2010), that the CO2 increase from fossil fuel burning cannot be a problem because the 14C history shows that the residence time of CO2 in the atmosphere is only a few years (e.g., Starr Reference Starr1993; Essenhigh Reference Essenhigh2009). They typically are not aware of the Revelle factor and/or have CO2 effectively disappear as if a chemical lifetime applies as with CH4 or N2O. Also, they typically have to postulate sources other than fossil fuels to match observations, and that’s exactly what they are looking for.
In the last two decades atmospheric 14CO2 has become diluted enough by 14C-free fossil CO2 for its 14Ca/Ca ratio to drop below 14Co/Co in the subtropical ocean gyres (e.g., Guilderson Reference Guilderson, Schrag and Cane2004; and for the atmosphere, Lee Reference Lee, Dlugokencky, Turnbull, Lee, Lehman, Miller, Petron, Lim, Lee, Lee and Park2020), so that the atmosphere is pulling back out of the gyres some of the excess bomb 14C that entered in earlier decades. Again, it’s the isotopic ratio disequilibrium term (Ra eq – Ra) in Equation (1), but in this case Ra eq is regional, limited to the gyres. Although the equivalent of Equation (1) for 14C looks different because of corrections for isotopic fractionation and nuclear decay, the isotopic disequilibrium term works the same. Since total carbon in the oceans, Co, is so much larger than Ca, globally averaged isotopic equilibrium between the two reservoirs (14Co/Co = 14Ca/Ca), forces almost all bomb 14C to eventually end up in the oceans. That split is very different for the total carbon anomaly (see below). Incidentally, a situation where ocean surface waters have higher 14Co/Co than 14Ca/Ca has probably not existed for hundreds of millions of years, except perhaps when geomagnetic reversals could have caused large cosmic ray anomalies. It does show, qualitatively, that the emissions creating today’s CO2 excursion must come from very old carbon.
CLIMATE POLICIES AND SCIENCE
We cannot assume that people who think that CO2 emissions just disappear, in a few years or more slowly in a century or so, constitute a small minority. We should remember that in the early days of Integrated Assessment Models (combining physical and socio-economic models) CO2 was often given a residence time as if it simply disappeared. No wonder that the optimal economic strategy to deal with climate change often came out as “Wait, it will be cheaper to tackle it later when we are so much wealthier and technology has advanced further” (e.g., Nordhaus Reference Nordhaus1992; for a critique, Dietz Reference Dietz and Stern2015). Economists do not know whether we will indeed be wealthier in the future, even by their own definition of wealth. It is an assumption, coded into the models as a “future discount factor” that is ultimately based on a belief that exponential growth can continue indefinitely which appears quite common in mainstream economics. Estimates of desirable growth rates tended to come down in recent decades, from ∼5% to ∼2% per year. Two percent is still absurd, it corresponds to a doubling time of 35 years. Any sustained exponential growth on our finite earth turns into a guaranteed disaster, which we can now clearly see the onset of, and not only in the realm of climate change.
Furthermore, we actually know that CO2 does not disappear at all. The emissions anomaly is shared with the oceans and terrestrial ecosystems. When equilibrium with the full oceans is restored in a thousand years or so after the fossil CO2 pulse, about 17% of the excess CO2 remains in the atmosphere “forever”, and 83% in the oceans when we only consider chemistry, implicitly assuming that ocean circulation and marine biology remain unchanged. Here we have also ignored carbon stored in terrestrial ecosystems, which lost carbon from land use change in the 19th and early 20th centuries, but regained it after 1950 when widespread fertilizer use took off and when higher CO2 may have also fertilized terrestrial ecosystems. Any lifetime choice I have seen for the CO2 anomaly ignored the “permanent” airborne fraction of ∼17%. It could be larger, or less, depending on ocean circulation and marine biology but those are hard to predict at this point. “Permanent” is in quotation marks because on a time scale of 3–7 thousand years the dissolved CO2 (CO2 + H2O ⇔ H2CO3, Arrhenius Reference Arrhenius1896) will be neutralized (H2CO3 + CaCO3 ⇒ Ca2+ + 2HCO3 −) by the dissolution of CaCO3 sediments and coral reefs (Archer et al. Reference Archer, Eby, Brovkin, Ridgwell, Cao, Mikolajewicz, Caldeira, Matsumoto, Munhoven, Montenegro and Tokos2009). Even then the CO2 would still be there, in the oceans, but at least not in the atmosphere any more.
The mistaken residence time or lifetime of CO2 emissions is still with us to this day. To assist policy makers the Intergovernmental Panel on Climate Change (IPCC) introduced a measure, Global Warming Potential (GWP) in their Second Assessment Report (IPCC Reference Schimel1996), to compare the climate impact of emissions of different gases with each other. What matters are the strength and location of optical absorption/emission lines and the amount of time each gas remains in the atmosphere. These comparisons work well for gases that are photochemically destroyed and a lifetime can be defined. CO2 was picked as the reference, so that the climate impact of each gas is expressed as CO2 equivalents, often denoted as CO2e or CO2eq. But which lifetime do we assign to CO2? It simply does not apply. The chosen solution was to implement a “time horizon”, let’s call it H, and only estimate the cumulative heat retained in the atmosphere from the time of emissions until H years later. IPCC (Reference Schimel1996) chose three values of H, 20, 100, and 500 years of which 100 was widely adopted by governments for reporting emissions, but 20 has also been used, while 500 did not get any traction. Obviously, H=100 and even more so H=20 understate the real impact of longer lived gases. It worked as an invitation to create a bias toward short-term policies, effectively ignoring the long-term effects, notwithstanding the known fact that our global climate (and ocean acidification) problem is very long-lived (Tans Reference Tans1997). It is effectively irreversible by natural processes on time scales of human civilizations. It is essentially a moral issue; our generation refusing to take responsibility for our own actions. Later IPCC assessments tried to remedy the misperception by adding a discussion of CO2’s very long tail, but it was too late. At the time of this writing I have requests from three different journals to review papers claiming to define improved lifetimes for CO2. One of those papers I have seen already three times, submitted to one journal after another.
The CO2 Seasonal Cycle and Annual Variations
When CO2 and its δ13C ratio are studied together we can immediately see that the seasonal cycle in the Northern Hemisphere is almost entirely caused by terrestrial ecosystems (Figure 2). We use low-pass smoothing (in the frequency domain) filters to remove high frequency variability (Thoning et al. Reference Thoning, Tans and Komhyr1989). The seasonal cycles of δ13C very nearly mirror those of total CO2, including the little pause in January–February, and they show that on average the isotopic signature of the seasonal source/sink is −18.8‰ relative to the atmospheric reservoir over 2010–2015. The pause in January–February occurs because respiration from soils and vegetation is at a minimum at the lowest temperatures in winter. The signature of −18.8‰ is close to the measured isotopic discrimination during photosynthesis in C3 plants. The addition or removal of 1 ppm of CO2 depleted by 18.8‰ is mixed into 394 ppm, making a change of the atmospheric isotopic ratio of −0.0477‰/ppm. The amplitude of the seasonal cycle in the Southern Hemisphere is much smaller, is out of phase with the Northern Hemisphere, and lacks the tight correlation shown in Figure 2.
Five years of CO2 and δ13C measurements in the same air samples at the Mauna Loa Observatory at 3.4 km altitude, near the summit of the volcano. The long-term trend has been removed from both records, leaving the seasonal cycle. Black diamond symbols, individual flask air samples; red smooth curves are drawn using a low-pass filter removing high frequency variability.

To extract the long-term trend from the data we set the low-pass cutoff low enough that we effectively have a smoother with a full width at half maximum (FWHM) of 1.00 year, which strongly suppresses the seasonal cycle. We call this the (de-seasonalized) long-term trend, or “trend” for short. It has been subtracted from the data to produce the (de-trended) seasonal cycles in Figure 2. Next, we make similar plots for the growth rate (time derivative) of the trends of CO2 and δ13C, but over a longer time span (Figure 3). Dave Keeling’s collaborator Bob Bacastow (Reference Bacastow1976) discovered a correlation between these interannual variations of the CO2 growth rate and the El Niño Southern Oscillation (ENSO). They are primarily caused by seasonal and annual anomalies of precipitation, temperature, insolation, etc. affecting the terrestrial biosphere. The center points of El Niño and La Niña episodes are indicated by arrows.
Time derivative of the long-term trends of CO2 and δ13C at the Mauna Loa Observatory. Upward arrows are at the center points of major El Niño episodes, and downward dashed arrows indicate the center points of major La Niña episodes.

There is now a large body of literature on the subject, but I want to draw attention to the average growth rate of CO2 at Mauna Loa. Over 1995–2015 it is 2.00 ppm/year, and −0.026‰/year for δ13C. If we (mistakenly) were to dilute 2.0 ppm/year at −19‰ (a rough average for the depletion of fossil fuels and cement relative to the atmosphere) into a reservoir of 381 ppm (an approximate atmospheric average during 1995−2015), we would predict a rate of decrease for δ13C of −0.100‰/year, four times larger than we observed. Isotopic exchange is large enough sometimes to have the d(δ13C)/dt growth rate go in the “wrong” direction, whereas the dCa/dt growth rate is always positive. The figure suggests that terrestrial variations are the largest component of the observed annual variability but that the oceans also contribute.
Some Regional Modeling Applications of Atmospheric 13C and 14C Data
We started our very close collaboration with the Institute for Arctic and Alpine Research (INSTAAR) at the Univ. of Colorado in 1990 when Jim White arrived. Our labs were literally across the street from each other. Jim continued to be involved in ice core work, but he started up stable isotope measurements in almost all the air samples of our global network. First 13C and 18O in CO2, and later 13C and deuterium in CH4. We focused first on separating terrestrial from ocean sources/sinks. During his postdoc Philippe Ciais (now at Laboratoire des Sciences du Climat et de l’Environnement, Paris) added isotopic ratios to a global two-dimensional (latitude, altitude) atmospheric transport model we were using to infer sources/sinks at the surface as a function of time and latitude from observed CO2 and δ13C, enabling the partitioning between oceans and land (Ciais et al. Reference Ciais, Tans, Trolier, White and Francey1995). We used the difference from the atmosphere of ∼–20‰ for plants and ∼1‰ for oceans, while accounting for the pure isotopic exchange terms. The large-scale north-south gradient of δ13C confirmed the hypothesis (Tans Reference Tans, Fung and Takahashi1990), based on total CO2 data, of very large terrestrial net uptake of CO2 at mid latitudes in the Northern Hemisphere.
Much development in this field was started around this time, by many groups, to improve full three-dimensional atmospheric transport models that could also represent longitude. Then the air samples from our global network could be placed properly on land, on the coast, and the oceans. This would diminish, but not eliminate, our need to use 13C/12C data for inferring land or ocean sources. Spatial gradients of CO2 and δ13C resulting from recent sources, such as a seasonal drought or other “anomalies” are very small compared to the global burden of CO2, so that the measurements need to be very precise. Wouter Peters (now at Wageningen University, the Netherlands) developed our version of data assimilation (also called inverse modeling), culminating in the launch of CarbonTracker in 2007 (Peters et al. Reference Peters, Jacobson, Sweeney, Andrews, Conway, Massarle, Miller, Bruhwiler, Pétron and Hirsch2007). CarbonTracker predicts spatiotemporal patterns of CO2 by feeding emissions of fossil fuel burning, fires, and terrestrial and oceanic sources/sinks (positive and negative emissions) into a global atmospheric transport model. When predicted CO2 is compared with the observations the terrestrial and oceanic sources/sinks are tweaked to get a statistically optimal match of the emissions with the CO2 observations. After his return to the Netherlands he continued a closely related version, CT-Europe, also a global model. In our lab Andy Jacobson (GML) further developed the original version, while also producing annual updates (see https://gml.noaa.gov/ccgg/carbontracker/).
The next, very demanding, step is to make use of variations of the fractionation factor caused by climate anomalies such as droughts. Ashley Ballantyne (now at Univ. of Montana) (Reference Ballantyne, Miller, Baker, Tans and White2011) and Ivar van der Velde (now at Vrije Universiteit, Amsterdam) (Reference Van der Velde, Miller, Schaefer, Masarie, Denning, White, Tans, Krol and Peters2013) did exploratory work in this direction. Peters et al. (Reference Peters, van der Velde, van Schaik, Miller, Ciais, Duarte, van der Laan-Luijkx, van der Molen, Scholze and Schaefer2018) used inverse modeling with CT-Europe and GGGRN δ13C data and found relationships between 13C/12C fractionation and water use efficiency over very large spatial scales during droughts, based on atmospheric measurements. Isotopic fractionation (∼–30‰) occurs during photosynthesis when the RuBisCo enzyme assimilates CO2 into organic compounds. CO2 transport from outside air through the leaf stomates to the chloroplasts where RuBisCo is located also fractionates, but much less, by 4.4‰. The overall fractionation is between these two values. Plants lose water through the stomates, and during a drought they conserve water by partially closing them, leading to both lower net CO2 uptake and less isotopic discrimination. Ecosystem models simulate this effect, but we found the observed responses of ecosystems to drought to be stronger than predictions based on simulations with coupled climate-vegetation models that did not consider δ13Ca observations.
A Supporting Role for 13C/C in the CO2 Calibration Scale
Since 1995, NOAA/GML has maintained the international CO2 calibration scale for the Global Atmosphere Watch (GAW) program of the World Meteorological Organization. The scale is propagated to participating labs, including ourselves, in high pressure cylinders filled with dry natural air in which the CO2 mole fraction has been calibrated relative to a set of “primary” mixtures we maintain (Hall et al. Reference Hall, Crotwell, Kitzis, Mefford, Miller, Schibig and Tans2021). At a GAW meeting in 2009 we were “accused” of biased CO2 numbers in some cylinders. What happened? Normally we fill all cylinders with clean natural air at Niwot Ridge, Colorado, at an altitude of 3040 m. At the request of one user we calibrated a few cylinders that had been filled by others. It turned out that the CO2 they had used came from fossil fuels, which was depleted in 13C by about 45‰ relative to the atmosphere, but we did not know. For a cylinder with 400 ppm that is a deficit of 0.011*0.045* 400 = 0.20 ppm in total CO2. Our reproducibility of transfer calibrations was 0.03 ppm for natural air. In a situation like this the calibration depends on how sensitive your analyzer is for different isotopologues such as 12C16O2 and 13C16O2. We have fixed this now with our new calibration scale (Hall et al. Reference Hall, Crotwell, Kitzis, Mefford, Miller, Schibig and Tans2021) by providing information numbers for δ13C and δ18O at moderate precision for each cylinder. The user can then make appropriate corrections, if necessary, when that cylinder is used to calibrate natural air measurements (Tans et al. Reference Tans, Crotwell and Thoning2017). Calibration transfers from our new scale to standards used in other labs have a reproducibility of 0.01 ppm, which is actually needed(!) for a useful interpretation of extremely small spatial gradients over the Southern Oceans and Antarctica of 0.1–0.2 ppm.
14C is Crucial for the Objective Quantification of Emissions Reductions
Since 2003 we have had another ongoing close collaboration with INSTAAR, with Scott Lehman, to make 14C measurements on a subset of our air samples, and through Scott with John Southon of the AMS facility at UC Irvine. We were able to subtract the fossil fuel caused enhancement of CO2 along the US East Coast (typically a few ppm) from total CO2, which improved our quantification of the seasonal cycle and net annual uptake caused by plants and soils (Turnbull et al. Reference Turnbull, Miller, Lehman, Tans, Sparks and Southon2006). Furthermore, when we correlated the Cfos component of CO2 with other species, the emissions estimates of most of them were improved because the fossil CO2 emissions are better known than most industrial species (Miller et al. Reference Miller, Lehman, Montzka, Sweeney, Miller, Karion, Wolak, Dlugokencky, Southon, Turnbull and Tans2012). John Miller is in GML, Jocelyn Turnbull is now with GNS Science in New Zealand, leading the Rafter Radiocarbon Lab.
But what about the emissions of fossil CO2 themselves? The global tropospheric 14C budget has significant uncertainties, due to isotopic exchange, variations in 14C production, in stratosphere-troposphere exchange, and 14C produced in the nuclear industry. However, on a regional and urban scale the 14C depletion of total CO2, caused by the addition of 14C-free CO2 emissions from fossil fuels, is a conserved quantity. On the other hand, respiration and photosynthesis by the terrestrial biosphere have almost the same Δ14C signature as the atmosphere. That makes the lowering of Δ14CO2 between upwind and downwind of an area a very good measure of how much fossil CO2 has been added to the air mass (Turnbull Reference Turnbull, Karion, Fisher, Faloona, Guilderson, Lehman, Miller, Miller, Montzka, Sherwood, Saripalli, Sweeney and Tans2011, Reference Turnbull, Sweeney, Karion, Newberger, Lehman, Tans, Davis, Lauvaux, Miles and Richardson2014). Then we need accurate meteorology to turn it into an emission rate. We like to always specify that 14C gives a measure of recent (less than a few weeks) emissions. Basu (now at Univ. of Maryland) et al. (2021) used a dual tracer (CO2 and Δ14CO2) inverse modeling system to estimate US fossil emissions for 2010. There were ∼900 Δ14CO2 measurements per year over North America at that time. The 14C based estimate gave 1.653 ± 0.03 GtonC, 9–10% higher than three widely used emissions inventories, 4.6% higher than the official inventory of the US EPA, but the same as the Vulcan 3.0 inventory (within the ±0.03 uncertainty). The value of an objective (transparent and reproducible) estimate is that it gives realistic feedback, independent of any wishful thinking, to the public and policymakers on how well emissions reductions are in fact working, and it could help to create confidence in international agreements. Basu’s study focused on 2010, but such studies could be done in near real time, whereas inventories are typically several years behind.
Another Global Isotopic Exchange Reservoir?
I was very fortunate in 1987 to participate in an expedition of the National Geographic Society to investigate a large tomb next to Khufu’s Pyramid near Cairo (El-Baz Reference El-Baz1988). It was one of two such tombs, the other one had been opened in 1954 and contained a large ship made from ancient imported Lebanon cedar that is on display in a specially built museum next to the pyramid. We were to drill a hole through one of the 1.5 m thick capstones of the second tomb, take photographs, and seal it back up. It was my job to take air samples from the tomb before the photos would be taken. The drill assembly had an air tight seal. What we found were all the parts of a similar ship, neatly laid out, but unfortunately in an advanced state of decay. The ancient Egyptians had tried hard to seal the tomb from the outside because they had poured gypsum in between adjacent cap stones that were themselves remarkably flat. The seal was probably never air-tight, but in 1987 it was very far from tight. We measured concentrations of modern chlorofluorocarbon gases inside the tomb identical to those in outside air. The latter exhibited a diurnal pressure swing. We tried to measure any differential pressure between the inside of the tomb and the outside but the difference was “stuck” at zero. We did measure enhanced CO2 in the tomb because the wood was rotting, and since we knew the age of the wood we could predict the 14C depletion of the CO2 enhancement. I had met Doug Donahue in 1980 when I applied for a job in the Department of Physics at the Univ. of Arizona in Tucson, to work on accelerator 14C measurements. I did not get the job, but we stayed in touch. So I sent some samples of the tomb air to Doug, to measure Δ14C. It turned out to be significantly too “old”…. Could there be isotopic exchange with the limestone? Even though we were in a desert environment, a few cm beneath the surface the limestone was saturated with water, something that we saw when drilling through the capstone all the way down. CO2 and water imply the presence of carbonic acid. Could the walls of the tomb dissolve and re-precipitate, creating a mechanism for the exchange of carbon? Back in Boulder we drilled some holes in a limestone outcrop, discarded the outermost 1 cm, but kept the next cm, which we also sent to Tucson. Δ14C in the rock was ∼1% of modern, not zero. We did not have resources to pursue this any further, but perhaps it hinted at a potentially very large (but slow) global carbon exchange reservoir, thus far not considered (except on million-year time scales), that could affect today’s global 14C budget estimates.
ACKNOWLEDGMENTS
I am grateful that NOAA gave me the opportunity to develop its Global Greenhouse Gas Reference Network, especially Dr. Lester Machta who was responsible for hiring me in 1985. The GGGRN is a collaborative and sustained project, and I thank all previous and present colleagues for their dedication and expertise that made it happen. I thank reviewer 1, Piet Grootes, for his extensive and helpful comments.
DISCLAIMER
The contents of this paper are the sole responsibility of the author and do not necessarily reflect the position of NOAA, the Department of Commerce, or the federal government.


 Open access

