


1. Introduction
Fisheries sector is experiencing a transition period in the past two decades globally (Naylor et al., Reference Naylor, Hardy, Buschmann, Bush, Cao, Klinger, Little, Shumway and Troell2021). This sector is crucial for addressing food and nutrition security challenges in developing countries (Belton and Thilsted, Reference Belton and Thilsted2014). Fish is a vital source of high-quality animal protein, essential micronutrients, and fatty acids in many parts of the global south where poverty and undernourishment are main concerns (Kent, Reference Kent1987; Tacon and Metian, Reference Tacon and Metian2013). Resource poor households in these vulnerable regions often depend on fish as an affordable primary source of animal protein (World Bank, 2006; Thilsted, Reference Thilsted2013). However, the recent decline in capture fish production poses significant concerns for both human health and food security (Golden et al., Reference Golden, Allison, Cheung, Dey, Halpern, McCauley, Smith, Vaitla, Zeller and Myers2016).
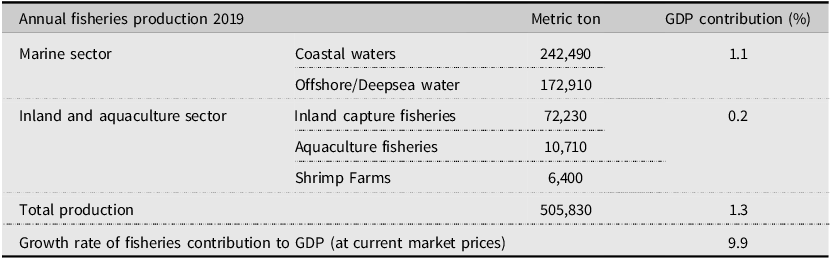
Sri Lanka is an island with 1,620 km of coastal areas and another 517,00 km 2 exclusive economic zone in the Indian Ocean (CBSL, 2023) that supports nearly 1 million fishers, workers, and their families (World Bank, 2022). The overall growth rate of fisheries contribution to GDP is 9.9% at 2019 market price (Ministry of Fisheries, 2020). Fisheries industry is therefore a crucial component that provides solution for food insecurity, malnutrition, unemployment, and low-resource income generation. However, in recent years the sector has experienced stagnation due to the global lockdown measures imposed during the COVID-19 pandemic and the subsequent economic crisis in the country. Although the fisheries sector provides almost 55% of the total domestic protein supply, marine capture fisheries production has shown a declining trend with a 21.3% decrease recorded in 2020 (Amaralal et al., Reference Amaralal, Edirimanna, Lakmini, Chamodi, Kuragodage, Sanuja and Bandara2023).
One primary concern of the Sri Lankan fisheries industry is incomplete price transmissionFootnote 1 across spatial markets, an issue prevalent in many developing countries. Such incomplete price transmission among geographic markets can arise due to structural and operational inefficiencies. These include inadequate transportation and storage infrastructure (Getnet et al., Reference Getnet, Verbeke and Viaene2005; Lutz et al., Reference Lutz, Tilburg and Kamp1995; Heien, Reference Heien1980), perishability of aquatic products, limited market information, and imbalanced market power among regional stakeholders (Asche et al., Reference Asche, Dahl, Gordon, Trollvik and Aandahl2011; Fofana and Jaffry, Reference Fofana and Jaffry2008; Deb et al., Reference Deb, Dey and Surathkal2022a). Additionally, factors such as regional disparities in infrastructure, seasonality of fish supply, local consumer preferences, and inadequate financial and technical support to small-scale traders and fishers further contribute to uneven price adjustments across markets. Investigating the dynamics of spatial market integration provides valuable insights into these inefficiencies and aids in formulating targeted policies to enhance nationwide market efficiency and equitable fish distribution.
A considerable body of research has been conducted on fish price transmission and market integration (Deb and Li, Reference Deb and Li2024; Deb et al., Reference Deb, Dey and Surathkal2022a; Asche et al., Reference Asche, Bremnes and Wessells1999, Reference Asche, Gordon and Hannesson2004, Quagrainie et al., Reference Quagrainie and Engle2002; Fernández-Polanco and Llorente, Reference Fernández-Polanco and Llorente2019; Hossain et al., Reference Hossain, Nielsen, Ankamah-Yeboah, Badiuzzaman and Huda2021; Pham et al., Reference Pham, Meuwissen, Le, Bosma, Verreth and Lansink2018; Thong et al., Reference Thong, Ankamah-Yeboah, Bronnmann, Nielsen, Roth and Schulze-Ehlers2020; Simioni et al., Reference Simioni, Gonzales, Guillotreau and Le Grel2013; Goa et al., Reference Gao, Bagnarosa, Dowling, Matkovskyy and Tawil2022; Acharjee et al., Reference Acharjee, Gosh, Alam, Haque, Sayem and Hossain2023; Hoshino et al., Reference Hoshino, Schrobback, Pascoe and Curtotti2021; Mulazzani et al., Reference Mulazzani, Camanzi and Malorgio2012) along the vertical and horizontal value chain for better understanding of the global seafood market. However, as of our best knowledge, there is no study conducted so far to understand the price pass-through effect along the spatial fish markets in Sri Lanka. Appendix Table A1 provides review of literature on Sri Lankan fisheries sector. We find the majority of the studies are focused on the descriptive level of fish production and socio-economic conditions of fishers. Hence, there is a significant gap in comprehensive research on fish price dynamics that is crucial for addressing challenges related to seafood market efficiency and fairness, economic resilience, policy and governance, support for small-scale fishers, and overall food security in the country.
The main objective of this study is to investigate fish price pass-through and spatial market integration in Sri Lanka. From an economic perspective, examining how prices disseminate across different geographical markets provides insights into market integration and price discovery processes. Efficient price discovery occurs when one market quickly incorporates information, setting benchmark prices that other markets follow. Understanding these relationships is crucial as it highlights the efficiency with which information is transmitted across markets, affecting price stability and responsiveness to market shocks. Investigating the extent of price integration and the dynamics of price discovery among key geographic markets enables targeted policies aimed at improving market efficiency, reducing regional disparities, and ensuring equitable fish distribution nationwide. This analysis ultimately helps safeguard consumer welfare and food security by fostering competitive and integrated fish markets.
Our study provides several contributions to the existing literature on Sri Lankan fisheries value chain. First, it provides empirical evidence on fish price pass-through and spatial market integration in Sri Lanka. Second, the geography of Sri Lanka with its extensive coastline, creates unique challenges for fish distribution and price formation across regions. This study helps identify areas or markets that are vulnerable to price shocks and need targeted interventions. Third, this is the first study on Sri Lankan fisheries sector that utilizes a reduced-form econometric model with high frequency (weekly) retail price data of mostly consumed fish species across four important geographical markets. Finally, the findings of this article offer valuable insights to government officials, policymakers, and economists, enabling them to formulate and implement effective policies to maintain long-term fish price stability in the country.
2. Sri Lankan fisheries sector – an overview
2.1. Fish production and consumption
Figure 1 indicates the fish production trend of offshore, coastal, and inland and aquaculture in Sri Lanka over the last two decades. We can see two major setbacks in marine fish production trend as mentioned earlier, the first was in 2005 and the other after 2019. Sri Lanka experienced the infamous Tsunami at the end of 2004 which completely wiped-out marine infrastructure and resources. Also, civil conflict resumed in 2005 after a temporary cessation of ceasefire (Lunn et al., Reference Lunn, Taylor and Townsend2009). These two events are the probable factors for the dramatic decline of marine fish production in the country during 2005. The second setback after 2019 was likely to coincide with the outbreak of the COVID-19 pandemic and thereafter the economic crisis. Sri Lanka was under complete lockdown condition during the COVID period which created a major supply chain disturbance. Moreover, the country experienced economic crisis just after the end of lockdown (George et al., Reference George, George and Baskar2022). The crisis increased fuel price substantially which had a devastating impact on the fisheries sector. Fuel is the primary input factor for operating boats and transporting fish to markets. Sector-wise fish production in 2019 and the contribution to GDP is provided in Table 1.
Sector-wise fish production trend in Sri Lanka.


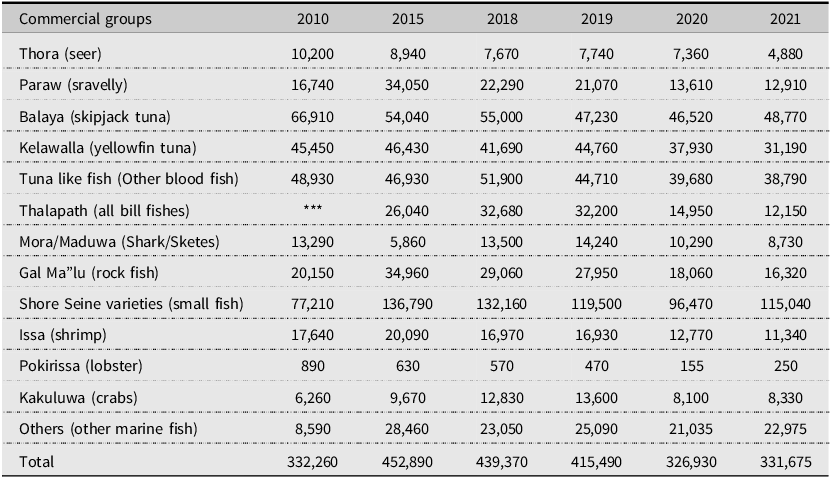
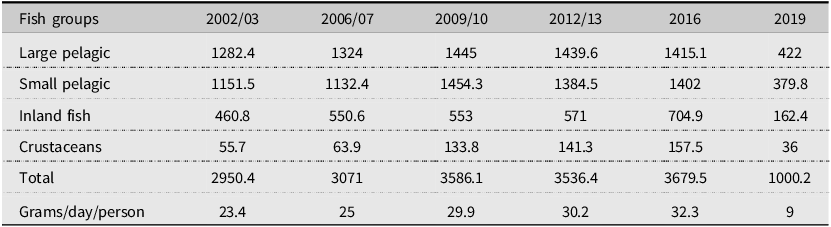
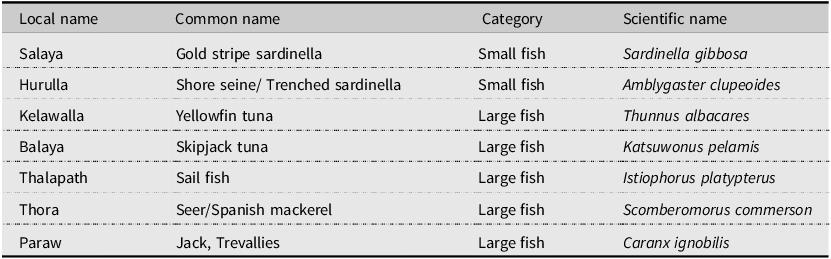
The main marine commercial fish species/groups in Sri Lanka include Thora (Scomberomorus commerson), Balaya (Katsuwonus pelamis), Salaya (Sardinella gibbosa), Hurulla (Amblygaster clupeoides), Kelawalla (Thunnus albacares), Thalapath (Istiophorus platypterus), Paraw (Caranx ignobilis), and shore seine varieties. Table 2 shows the production per metric ton of major commercial fish groups. In general, the production of shore seine varieties (small fish) substantially outnumbers other fish groups. There are two main demand side reasons for higher small fish production. Firstly, small or assorted fish offer an economically viable option for resource-poor households without incurring a heavy financial burden. Low-income individuals can purchase smaller quantities of affordable staples, making these essential foods more accessible in the diets of economically disadvantaged communities. Secondly, the nutritional value of small fish species stands out as a significant driver of their demand. As small fish species are eaten whole with bones and head, all the nutrients and bioavailable calcium become utilized entirely (Thilsted, Reference Thilsted2012). Table 3 provides average monthly household fish consumption since 2002.
Production of major commercial fish groups (Metric tons)

Source: MFAR (2022).
***Included in other blood fish group.

2.2. Value Chain
Fisheries value chain in Sri Lanka operates in a very complex system that involves numerous intermediaries along the value chain nodes and the entire operation is controlled by both private and government sectors. An increasing number of actors are observed due to the mechanization and commercialization of this business (Arunatilake et al., Reference Arunatilake, Gunawardena, Marawila, Samaratunga, Senaratne and Thibbotuwawa2008; Rosales et al., Reference Rosales, Pomeroy, Calabio, Batong, Cedo, Escara and Facunla2017)Footnote 2 . Fish production from the marine sector can be divided into two groups: coastal fisheries and offshore or deep-sea fisheries. Coastal fish production is marketed through diverse channels and ends up in consumers plate via numerous rural and urban fish outlets, small mobile vendors, supermarket chains, and the state-owned Ceylon Fisheries Cooperation (CFC) outlets (Arunatilake et al., Reference Arunatilake, Gunawardena, Marawila, Samaratunga, Senaratne and Thibbotuwawa2008). St. Johns Fish Market near capital and Kandy wholesale fish markets plays a vital role to distribute coastal fishery outputs. The deep-sea fisheries value chain is crucial for foreign exchange earnings and has been undergoing significant improvements, including an increase in the number of modern large vessels equipped with cold storage and advanced navigation systems, as well as the establishment of fish processing plants and quality testing facilities (Arunatilake et al., Reference Arunatilake, Gunawardena, Marawila, Samaratunga, Senaratne and Thibbotuwawa2008). Although Sri Lanka has many fishing ports throughout the coastal areas, given the civil war in North and Eastern parts of the country till 2009, most of the ports still have primitive infrastructure and lack facilities for storage and transportation. Inappropriate fish handling equipment, insufficient cold storage facilities, and lack of appropriate transportation facilities has resulted in 50% post-harvest loss of deep-sea/offshore fisheries in Sri Lanka according to FAO (2024) food loss index.Footnote 3 The reasons of post-harvest losses in marine fish value chain is illustrated in figure 2.
Reasons of post-harvest loss.

2.3. Infrastructure and governance
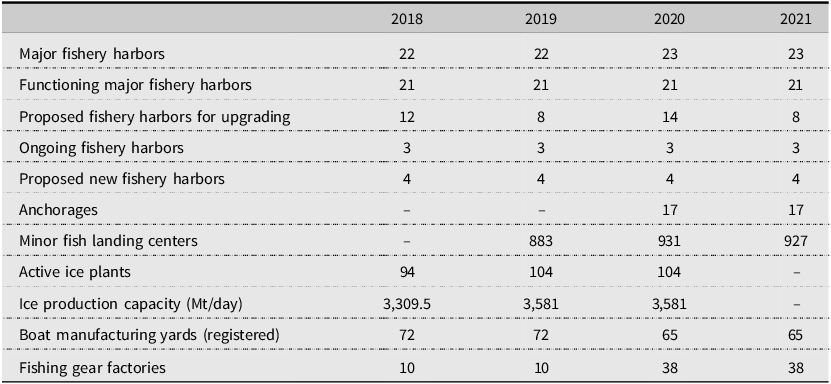
The government of Sri Lanka has made a continuous effort to efficiently manage the existing 23 major fishery harbors and allocated sufficient resources to build new harbors (Ministry of Fisheries, 2022). Also, there are 927 minor fish landing sites that include both offshore and coastal multi-day boats, single-day boats, outboard motor fiberglass reinforced plastic boats (OFRP), motorized and non-motorized traditional boats (NBRB), and non-motorized traditional beach seine boats. There are 48,776 (83.35%) marine fleets and 9,940 (16.64%) inland fleets. Among the marine fishing fleets, the most common fishing fleets are OFRP (48.99%) and NBRB (31.33%), followed by different types of multi-day boats. Also, the country is significantly investing in establishing fishing gear factories and cold storage facilities to reduce post-harvest loss. Most of this ice production infrastructure is located closer to the fisheries harbors or dedicated fish markets. Table 4 provides the infrastructure facilities in the marine fisheries sector from 2018 to 2021.

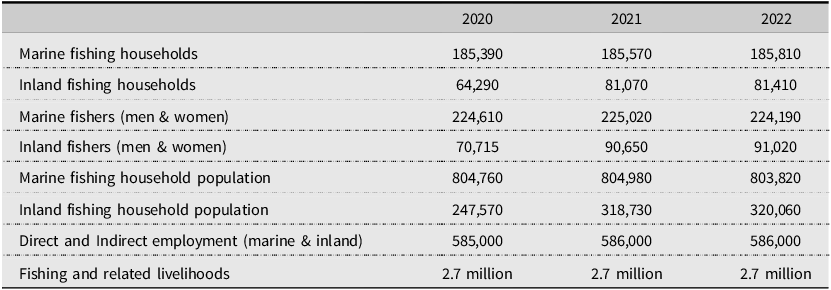
The main governing body of Sri Lankan fisheries sector is the Ministry of Fisheries and Aquatic Resources (MFAR). As fisheries sector provides the main source of livelihood for most of the people living around the coastal areas, this sector is significant in terms of economic, social, and political contexts. Table 5 provides the social indicators of fishing population. Under MFAR, the Department of Fisheries and Aquatic Resources (DFAR) has the responsibility to formulate programs and implement and evaluate fish-related activities. The DFAR has district offices across all 25 administrative districts to implement the district-level programs and regulate and manage the fisheries and aquatic resources at the local level. The National Aquatic Resources Research and Development Agency (NARA) is responsible for conducting research and development activities related to aquatic resources. Furthermore, the National Aquaculture Development Authority (NAQDA) is mandated to manage and develop aquaculture and inland fisheries in Sri Lanka. NAQDA provides the necessary training and facilities for inland fisheries. Under MFAR there are two cooperations namely, Ceylon Fisheries Corporation (CFC) and Ceylon Fisheries Harbor Cooperation (CFHC). CFC is engaged in selling and transporting fish across the country. Whereas CFHC is responsible for providing fishery harbor-related services to the stakeholders. It also supports the development and adoption of new technologies in the fisheries sector. The Cey-Nor Foundation limited is the only government entity which is entrusted to build boats in Sri Lanka.

3. Materials and methods
3.1. Data
The data for this study was obtained from the Hector Kobbekaduwa Agrarian Research and Training Institute (HARTI), which is responsible for conducting policy analysis related to Sri Lanka’s agricultural sector. HARTI maintains comprehensive price statistics for all agricultural commodities, including those from fisheries markets and dedicated economic centers across the country. The institute collects daily price data for most agricultural products and compiles weekly fish price data from major coastal and inland fish markets in Sri Lanka.
For this study, we compiled weekly retail prices for seven of the most commonly consumed fish species in Sri Lanka from January 2013 to February 2020. Detailed information on the selected fish species is provided in Table 6. Our analysis focuses on four key markets: Colombo, Kalutara, Kandy, and Hambantota, due to their significance in the fish trade and the consistency of their reported data. Colombo (the capital) and Kandy serve as major domestic trading hubs. Kalutara is the fourth largest, and Hambantota is the second largest fish producing district in the country. Together these two districts account for 25% of national marine fish production (Ministry of Fisheries, 2020).
Selected fish species local, common, and scientific names

Other markets exhibited inconsistencies in price reporting, often influenced by factors such as data submission practices, regional variations, and seasonal or weather-related disruptions. Some markets regularly update their prices while others rely on intermediaries, leading to irregular data availability. Although HARTI collects data from markets nationwide and for a wide range of fish species, we restricted our study period to 2013–2020 and four key markets due to inconsistencies in prior data records. This selection ensures a more reliable dataset for analyzing spatial market integration.
Retail prices represent the final node in the value chain that directly interfaces with consumers. Analyzing retail prices allows us to assess the effectiveness of price transmission mechanisms in ensuring that benefits or costs are appropriately passed down to the end-users without disproportionate markups by intermediaries. It sheds light on potential inefficiencies or exploitations within the market that may not be evident when examining wholesale or farm gate prices alone. Retail price is also more sensitive to local demand and supply conditions, seasonal variations, and regional consumer preferences, making it invaluable for studying price pass-through across different geographic markets.
3.2. Empirical method
To investigate fish price transmission, we conduct bivariate Johansen cointegration test (Johansen, Reference Johansen1988, Reference Johansen1991) to identify long-run equilibrium relationships between each pair of markets. Then for market pairs that exhibit cointegration, we estimate a Vector Error Correction Model (VECM) to analyze long-run adjustment mechanisms (Amatov and Dorfman, Reference Amatov and Dorfman2017; Awokuse and Bernard, Reference Awokuse and Bernard2007). We first need to perform a stationary test which is the fundamental aspect of modeling time series data to avoid spurious regression. We follow the standard approach of making time series data stationary: log returns, R t = ln (P t ) − ln (P t − 1). Here, P t is the price at t time period and P t − 1 is the price of one period previous time (t − 1). The log returns R t thus exhibits almost zero mean and time varying variance (Deb et al., Reference Deb, Dey and Surathkal2022b)Footnote 4 .
There are numerous statistical tests to determine stationarity property of a time series, among which Augmented Dickey Fuller (ADF) test and Kwiatkowski–Phillips–Schmidt–Shin (KPSS) test is the most popular (Dickey and Fuller, Reference Dickey and Fuller1981; Kwiatkowski et al., Reference Kwiatkowski, Phillips, Schmidt and Shin1992). The main difference between ADF and DF is the selection of optimum lag length to account for autocorrelation of the residual. Hence, in this article we use Akaike Information Criterion (AIC) for choosing the optimum lag length. The null hypothesis of ADF (H 0): there is no unit root in the series; and KPSS (H 0): the series is stationary.
Cointegration is essential for non-stationary price series (Asche et al., Reference Asche, Bremnes and Wessells1999, Reference Asche, Gordon and Hannesson2004) and thus we implement Johansen cointegration test on log price series that are stationary at first difference. Johansen cointegration is a likelihood ratio test that provides information on the number of cointegrating vectors based on two test statistics: maximum eigenvalue test and trace test (Winarno et al., Reference Winarno, Usman and Kurniasari2021). For both test the null hypothesis (H 0): there is no cointegration. If there are n variables, then we may find at most n − 1 cointegrating vectors. We use the bivariate Johansen cointegration test because it allows for clear identification and interpretation of pairwise market relationships. Given the specific geographic and economic significance of each market, the bivariate approach offers focused insights into direct bilateral market dynamics, simplifying interpretation and policy formulation. The Johansen cointegration test identifies cointegrating relationships by estimating the following system:
 $$\Delta P_{t}=\Pi P_{t-1}+\sum _{i=1}^{I}\Gamma _{i}\,\Delta P_{t-i}+\mu +\varepsilon _{t}$$
Here, P t is a vector of price series at time t, Π indicates the long-run relationship matrix, Γ i captures short-run adjustments, μ is a constant term, and ε t represents the residuals. The presence of cointegration implies Π has reduced rank, reflecting stable long-run relationships among the price series.
Following confirmation of cointegration using Johansen test, we specify the VECM to examine short-run dynamics and long-run equilibrium adjustments:
 $$\Delta P_{i,t}=\gamma _{0}+\gamma _{1}ECT_{t-1}+\sum _{l=1}^{L}\gamma _{2l}\Delta P_{i,t-l}+\sum _{l=1}^{L}\gamma _{3l}\Delta P_{j,t-l}+u_{t}$$
Here, Δ is the first difference operator, P i and P j are two spatial markets, ECT t − 1 is the lagged error correction term representing deviations from the long-run equilibrium, γ 1 is the speed of adjustment coefficient, γ 2l and γ 3l capture short-run market dynamics, and u t is the error term. Lag length L is determined by AIC.
4. Results
4.1. Descriptive statistics results
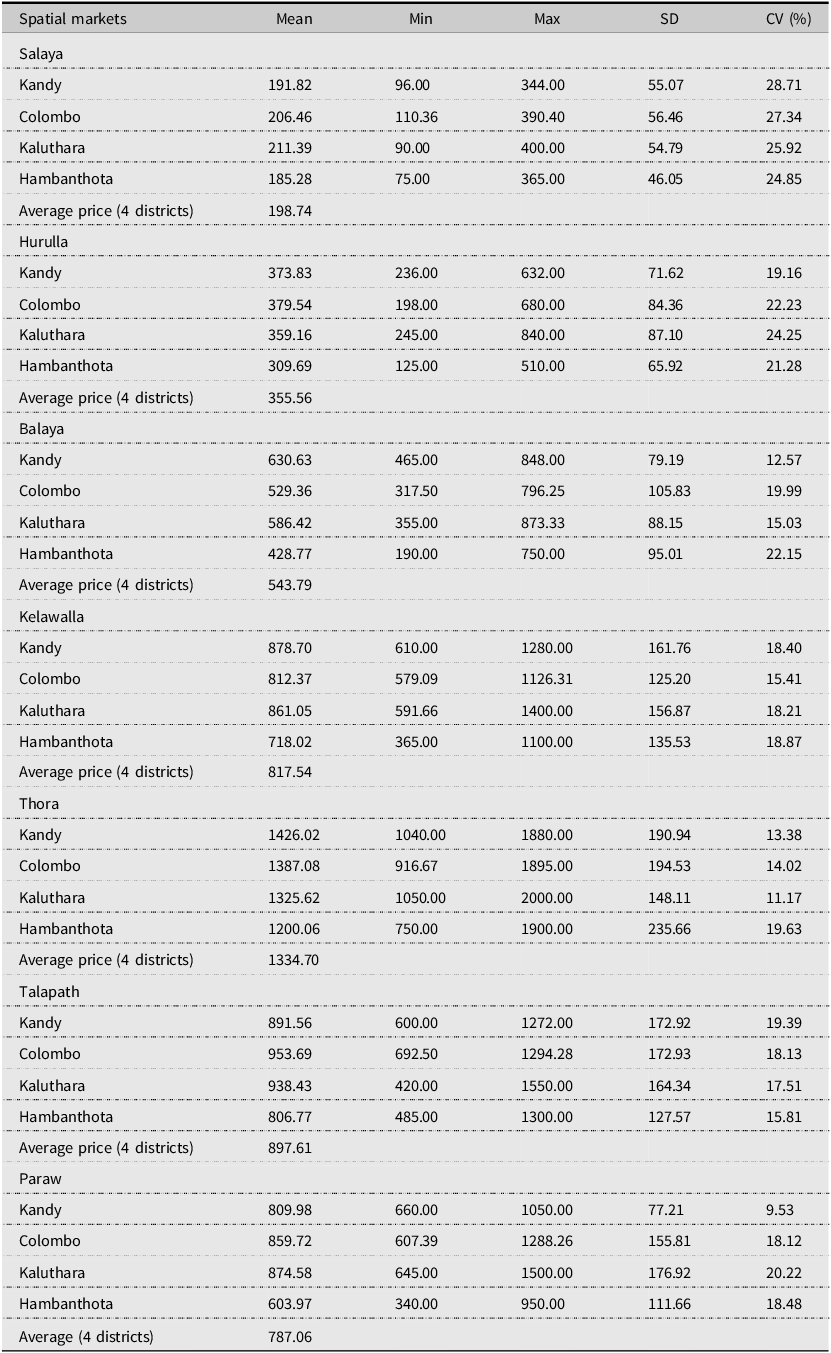
Table 7 presents the descriptive statistics of selected fish species. We find salaya and hurulla, two small fish species, are the least expensive with an average price of 198.74 rupee/kg and 355.56 rupee/kg, respectively. Thora is the most expensive fish species with an average price of 1334.70 rupee/kg. Hambantota experiences the lowest average price regardless of fish species and spatial markets. We cannot find a consistent pattern of overall price fluctuations that is represented by coefficient of variation (CV). In general, we can see that salaya fish price in Kandy market has the highest overall price volatility with CV of 28.71% while paraw fish price in Kandy market has the lowest CV of 9.53%.
Descriptive statistics on nominal prices (rupee/kg)

Notes: SD means standard deviation. CV means coefficient of variation. ${\rm CV}={{\rm SD} \over {\rm Mean}}\times 100$
.
${\rm CV}={{\rm SD} \over {\rm Mean}}\times 100$
.
Several factors may account for the significantly lower fish prices observed in the Hambantota market. Hambantota is renowned for having extensive coastline and favorable fishing zones with total land and water area of 2,609 square kilometers that is comparatively higher than other three selected markets (MFAR, 2020). This geographical advantage combined with large fisher communities naturally leads to higher fish production. For instance, in 2019 Hambanthota produced 65,480 metric tons of fish while Colombo, Kaluthara, and Kandy combined produced only 50,990 metric tons (MFAR, 2020). Also, the fish produced in Hambanthota is predominantly supplied to nearby markets in the southern region that enhances local accessibility and affordability.
Moreover, the economic status of Hambanthota may exert a significant influence on fish prices. The region’s average household income is relatively lower than Colombo and Kandy, thereby impacting the purchasing power of the local population. Hence, sellers adjust fish prices to align with local economic conditions to ensure a timely sale of this highly perishable commodity. In addition, the inland and aquaculture production in Hambanthota is significantly higher than other selected regions. Recent studies in Bangladesh indicate that intensifying aquaculture production can have significant influence on capture fish prices (Deb and Li, Reference Deb and Li2024; Hossain et al., Reference Hossain, Nielsen, Ankamah-Yeboah, Badiuzzaman and Huda2021). Hambanthota has a well-established inland and aquaculture market which includes riverine or reservoir-based fisheries that may increase overall fish supply, leading to lower capture fish prices due to substitution effect.
Figure 3 illustrates fish species prices at nominal level for the selected markets. We can see Hambanthota consistently exhibits lower fish prices over time but experiences noticeably higher price fluctuations. Kaluthara market demonstrates a relatively stable pricing pattern prior to 2018, followed by a significant increase in volatility across all fish species. Both Colombo and Kandy markets also experienced higher fish prices after 2018. This upward price trajectory is likely to be the outcome of declining fish production from marine sources that is represented in figure 1.
Nominal price trend of fish species in selected spatial markets.

4.2. Empirical model results
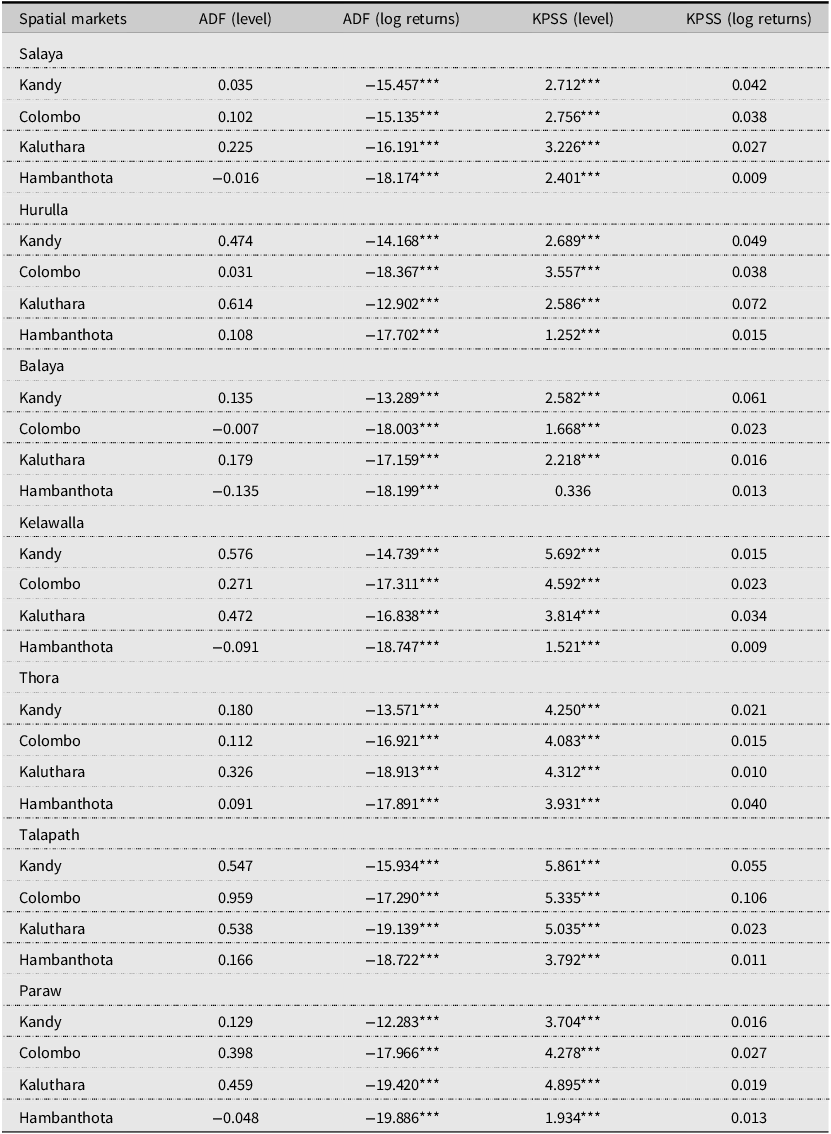
To avoid spurious regression, we need to work with non-stationary data (at level) that is stationary at log returns (or first difference) while investigating market integration. Table 8 represents the ADF and KPSS test results for both level and log returns series of all the selected fish species in four regional markets. The ADF test rejects the null hypothesis for all log returns series regardless of species and locations at 1% level of significance but cannot reject the null at level price. This indicates that the price series are non-stationary at level but stationary at log returns. The KPSS test also indicates the same suggesting stationarity of price series at log returns. Hence, both tests support to perform the Johansen cointegration test of level price series to investigate the existence of long-run market integration.
Stationarity test results

Notes: ***indicates rejecting null hypothesis at 1% level of significant.
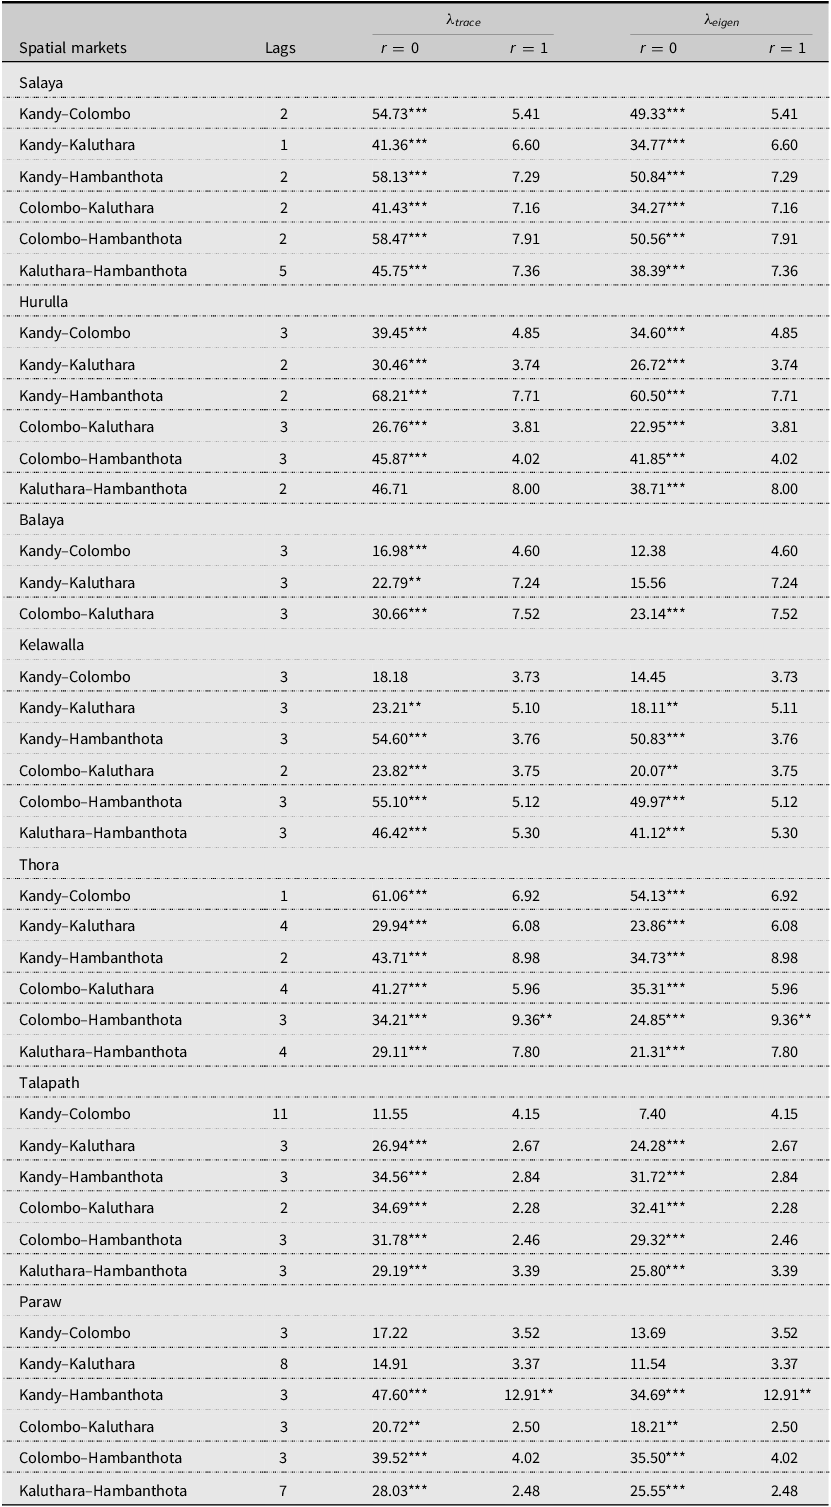
The bivariate Johansen cointegration test results are included in Table 9. The first column indicates the market pair and the second column for selected optimum lag length based on AIC. For both Trace and Max-eigen tests r = 0 indicates there is no evidence of long-run cointegrating vectors while for r = 1 indicates there exists at least one long-run cointegrating vector. For salaya and thora we find all the market pairs significantly reject the null hypothesis at r = 0 but fail to reject at r = 1. This indicates there is evidence of long-run market integration between all the spatial markets for salaya and thora fish species. However, we can see there is no evidence of long-run price cointegration between Kaluthara-Hambanthota for huralla, Kandy-Colombo for kelawalla, talapath, and paraw fish species. The existence of long-run market integration justifies the implication of VECM to understand the direction of price pass-through.
Johansen cointegration test results

Notes: *** and **indicate rejecting null hypothesis at 1 and 5% level of significant, respectively.
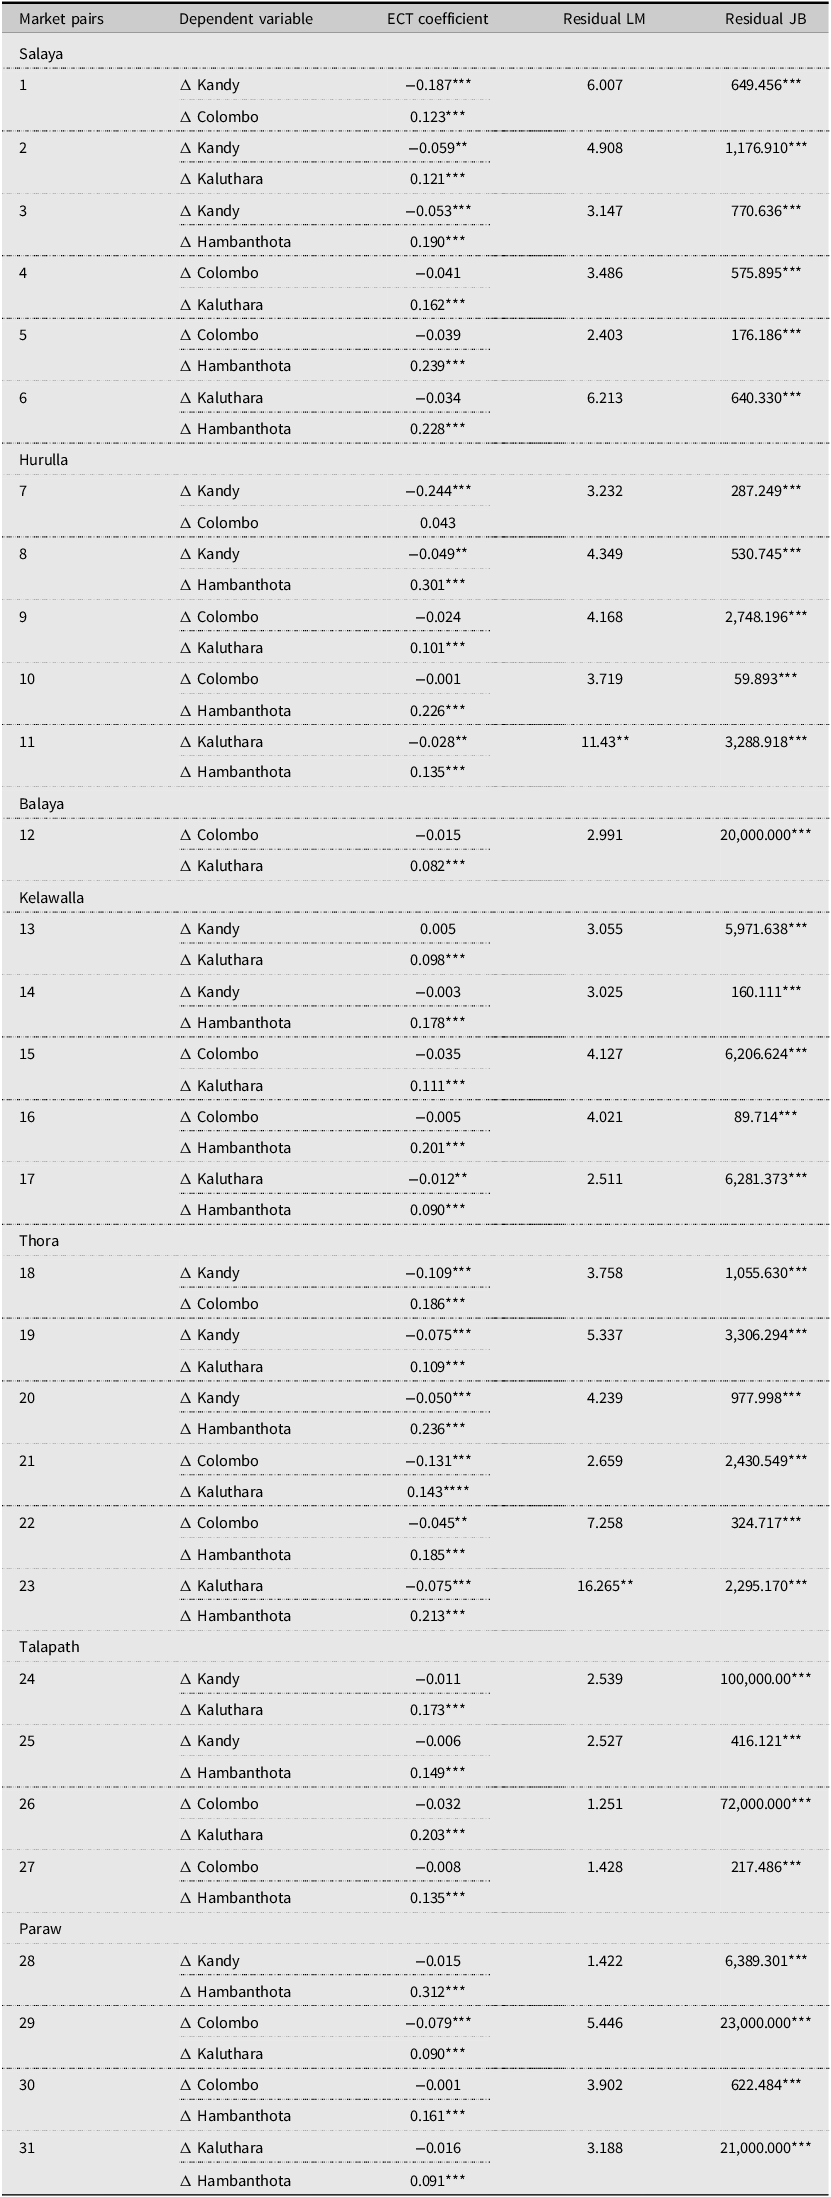
Table 10 represents the ECT coefficient for all the spatial market pairs that indicates significant market correlation in the Johansen cointegration test. The ETC coefficient indicates the speed of long-run adjustment towards the equilibrium. We also reported the model misspecification tests: residual autocorrelation (residual LM) and residual normality (Residual Jarque–Bera). The null hypothesis of residual LM test: there is no residual autocorrelation. The null for residual JB test: the residual follows normal distribution. For all cases we fail to reject the null hypothesis for residual LM test (except market pairs: Kaluthara–Hambanthota for Hurulla and Thora) while we reject the null hypothesis for residual JB test. This indicates our implemented VECM passes the model misspecification tests.
Vector error correction model results

Notes: *** and **indicate rejecting null hypothesis at 1 and 5% level of significant, respectively.
For salaya fish species, all the market pairs that include Kandy have significant bidirectional ECT coefficient while Colombo–Kaluthara, Colombo–Hambanthota, and Kaluthara–Hambanthota have unidirectional effect. For instance, market pair 1 shows both Kandy and Colombo have significant speed of adjustment coefficients, suggesting that the price of both markets have long-run dependency. However, Colombo ECT coefficient is not significant for Kaluthara and Hambanthota. This indicates the Colombo market does not react to price shocks from Kaluthara and Hambanthota. However, both Kaluthara and Hambanthota significantly respond to long-run price shocks from Colombo market. Also, Hambanthota market price is dependent on Kaluthara market (market pair 6). This indicates Hambanthota market follows the price set by the other market for salaya fish species.
For hurulla, we can see that the ECT coefficients of market pairs that include Colombo indicate unidirectional speed of adjustment. This mean Colombo is the market leader and all the other regional markets follow the price set by the Colombo market. For instance, market pairs 7, 9, and 10 all have significant ECT effect for Kandy, Kaluthara, and Hambanthota, respectively. However, both Kandy–Hambanthota and Kaluthara–Hambanthota markets indicate bidirectional speed of adjustment towards the equilibrium. Again, Kaluthara market follows the price set by Colombo market for balaya fish species.
Kelawalla, talapath, and paraw fish species prices are almost similar ranging from 603 rupee per kg to 953 rupee per kg and mostly consumed by middle class people. For almost all the spatial market pairs we find that Kandy and Colombo markets are influencing the price of other regional markets. For instance, both Kaluthara and Hambanthota markets ECT coefficients are significant when paired with Kandy and Colombo markets. Thora is the most expensive fish species and generally consumed by rich people. We can see that all the market pairs for thora indicate evidence of significant bidirectional price pass-through effect. This means when the average price of thora in any of the spatial market changes, it quickly falls back towards the other regional market level.
Moreover, the rate of adjustment is highest for market pair Kandy and Hambanthota for paraw fish species with significant ECT coefficient 0.313. Hence, paraw price in Hambanthota market can revert back to the long-run equilibrium quickly when the short run price deviates from the long-run equilibrium. The lowest significant ECT coefficient is found for Kaluthara hurulla market in market pair 11 with ECT coefficient value -0.028. This indicates the rate of adjustment for hurulla price in Kaluthara market is slower compared to other markets.
To have a better understanding of the impact of price changes in regional markets, we perform an impulse response function analysis that is represented in Figure 4. Each panel indicates different market pair relationships that showed significant ECT coefficient in VECM. The horizontal axis depicts 12 weeks forecast horizon following a standard deviation shock of response market in the vertical axis. The price response is visualized by a solid red line surrounding a shaded gray area that illustrates the 95% confidence interval. In general, the impulse response function indicates the dynamic relationship between two markets and the time varying price shock in one market can have on another market.
In almost all cases we find a one standard deviation positive shock in the Colombo and Kandy markets has an immediate significant impact on both the Kaluthara and Hambanthota markets. This is because the price response (red line) of Kaluthara and Hambanthota remains above the gray horizontal zero line at the initial period, indicating an immediate price pass-through effect. However, positive shocks originating from the Kaluthara and Hambanthota markets take a few months to transmit to the Colombo and Kandy markets, suggesting a lagged spillover effect in the reverse direction.
The findings highlight the critical roles of Kandy and Colombo in Sri Lankan spatial market fish price transmission. These two locations serve as pivotal hubs influencing the price dynamics in other regions, largely due to their strategic locations and advanced infrastructure. Kandy is the center of the country and acts as a natural convergence point for fish transportation system. Hence, this market can facilitate efficient distribution channel to other regional markets. Colombo is the capital and the largest urban center. Thus, it not only serves as a primary market but also a crucial node in the Sri Lankan fish trade network. This dual role of Kandy and Colombo bolster their significant influence on price pass-through mechanism.
5. Discussion and conclusion
This study investigates fish price transmission and spatial market integration among key geographic markets in Sri Lanka. The empirical analysis using Johansen cointegration tests and VECMs reveals significant long-run equilibrium relationships among these markets. Notably, Colombo and Kandy emerge as primary markets for price discovery, influencing price formation and adjustments in Kalutara and Hambantota.
Colombo and Kandy wholesale fish market act as domestic trading hub. Every day the nationwide distribution of fish begins from Colombo and the Kandy wholesale fish market (Arunatilake et al., Reference Arunatilake, Gunawardena, Marawila, Samaratunga, Senaratne and Thibbotuwawa2008). Their strategic locations, advanced infrastructure, and connectivity enable them to exert significant influence over other regional fish markets. As the national capital, Colombo benefits from extensive road development projects, while Kandy is connected by five class-A roads linking it to major districts in the south, southwest, northwest, and southeast, along with 24 class-B roads spanning a total of 247 km (Lowe et al., Reference Lowe, Herath, Edirisinghe, Dharmarathna and Wickramasinghe2022). These robust road networks facilitate the rapid movement of goods, ensuring that fish are transported swiftly and efficiently to all parts of the country. Such efficient logistics minimize delays and spoilage which is an essential consideration for perishable commodities like fish.
Efficient price transmission among the spatial markets plays a critical role in ensuring stable and responsive pricing that may directly impact both producers and consumers. Strong integrated markets facilitate rapid adjustment to market information and mitigate the adverse effects of supply and demand shocks. Markets with weaker integration may experience delayed price responses and lead to persistent price volatility. Producers in these markets set prices that inadequately reflect true market conditions, and consumers may face higher prices and reduced accessibility to fish products. However, both producers and consumers in strong integrated markets benefit from efficient price adjustments, contributing to more predictable market outcomes, and reduced economic vulnerability.
To address these disparities and enhance market efficiency, targeted policy interventions are necessary. Prioritizing investment in transportation infrastructure, cold storage, and logistical support systems in less integrated markets such as Hambantota and Kalutara can significantly improve market connectivity and responsiveness. Additionally, implementing advanced market information systems (i.e., digital platforms to connect fishers directly with buyers) can further strengthen price transparency, enabling more effective market participation and decision-making by local fishers, traders, and consumers. Policy efforts should also include capacity-building initiatives and financial assistance focusing on small-scale stakeholders, equipping them to better respond to market signals and actively engage in the broader fish market economy. Such measures will not only promote equitable economic outcomes but also ensure consistent access to affordable fish products across all regions.
Building on the insights gained from this study, we encourage future investigations including all the major fish producing districts in the country at different value chain levels (such as farm gate, wholesale, and retail) to have better understanding of fish value chain in Sri Lanka. Future studies can explore market power dynamics among different stakeholders such as the influence of intermediaries, wholesalers, and retailers on price setting and transmission could provide critical insights. Also, analyzing the inter-regional and international trade dynamics of Sri Lankan fish markets by including the impact of imports and exports on local prices can provide a comprehensive view of the market integration. The findings of this study can be applicable to other South Asian countries that are more dependent on capture fisheries. By utilizing the findings of this study, other South Asian countries with similar fisheries market structure can enhance their understanding of market dynamics, improve policy and infrastructure, and ultimately support the sustainable development of their fisheries sectors.
Impulse response function.

Acknowledgements
The authors sincerely thank the Data Management Division of the Hector Kobbekaduwa Agrarian Research and Training Institute (HARTI), Colombo, Sri Lanka, for providing the data used in this study.
Author contribution
Conceptualization, P.D., and P.S.; Methodology, P.D.; Formal Analysis, P.D.; Data Curation, P.S., and P.D.; Writing – Original Draft, P.D., P.S., N.B.; Writing – Review and Editing, P.D., P.S., N.B.; Supervision, P.D.
Financial support
This research received no specific grant from any funding agency, commercial or not-for-profit sectors.
Data availability
Data will be available upon request.
Competing interests
The authors declare that they have no known competing financial interests or personal relationships that could have appeared to influence the work reported in this paper.
Declaration of generative AI in scientific writing
The authors utilized generative AI to proofread only. After using this tool/service, the authors reviewed and edited the content as necessary and take full responsibility for the publication’s content.






 Open access

