


Introduction
Over the past two decades, studies have demonstrated that spontaneous brain activity organizes into specific patterns that reflect the functional architecture of the brain.Reference Gusnard and Raichle 1 These functional patterns, known as resting-state networks (RSNs), are typically measured using functional magnetic resonance imaging (fMRI), through spontaneous fluctuations in the blood-oxygen-level-dependent signal observed during rest, that is, in the absence of task engagement.Reference van den Heuvel and Hulshoff Pol 2
In clinical neuroscience, the ability to accurately characterize brain functional connectivity patterns is of crucial importance. The detailed mapping of RSNs is particularly valuable for understanding complex disorders like schizophrenia (SZ), where dysconnectivity has been identified as a core mechanism.Reference Schmitt, Hasan, Gruber and Falkai 3 –Reference Harikumar, Solovyeva and Misiura 7 Starting with the seminal works of Friston and Andreasen,Reference Friston and Frith 4 , Reference Andreasen, Paradiso and O’Leary 5 SZ has increasingly been conceptualized as a disorder of abnormal anatomical and functional connectivity, affecting key networks involved in perceptual, cognitive, and emotional processing.Reference Pettersson-Yeo, Allen, Benetti, McGuire and Mechelli 6 , Reference Harikumar, Solovyeva and Misiura 7 Resting-state fMRI (rs-fMRI) has proven to be a powerful tool for identifying baseline disruptions in large-scale brain networks without the confounding effects of task-based constraints.Reference Karbasforoushan and Woodward 8 Moreover, the absence of tasks during scanning provides a key advantage for clinical applications, as it facilitates the use of rs-fMRI in patients with limited cooperation or difficulty performing tasks.Reference Fox and Greicius 9
Among the pioneering research on the role of spontaneous brain activity,Reference Biswal, Yetkin, Haughton and Hyde 10 –Reference Fox and Raichle 12 the study by Mantini et al. was pivotal in revealing how RSNs support brain function.Reference Mantini, Perrucci, Del Gratta, Romani and Corbetta 13 This study demonstrated that RSNs are characterized not only by specific anatomical correlates but also by unique electrophysiological signatures, providing the first evidence of a link between fast neural processes and RSNs. This finding offered new insights into their role in sensory, motor, and cognitive functions, independent of task-evoked activity.Reference Mantini, Perrucci, Del Gratta, Romani and Corbetta 13 Since then, the resting-state approach has been increasingly employed to investigate how RSNs contribute to brain function in healthy individuals and how they are altered in pathological conditions.Reference Rosazza and Minati 14 , Reference Barkhof, Haller and Rombouts 15
The default mode network (DMN) is among the most extensively studied RSNs. This network includes brain regions primarily involved in internally focused cognitive processes, such as self-referential thinking, autobiographical memory retrieval, and mind-wandering.Reference Menon 16 The DMN plays a central role in spontaneous brain activity, emerging during restful, task-free states, and diminishing during attention-demanding tasks.Reference Raichle 17 Alterations in the DMN have been widely implicated in various neurological disorders, including Alzheimer’s disease, Parkinson’s disease, and epilepsy,Reference Mohan, Roberto and Mohan 18 as well as psychiatric conditions such as SZ, mood disorders, and anxiety disorders.Reference Doucet, Janiri, Howard, O’Brien, Andrews-Hanna and Frangou 19
Beyond the DMN, several other RSNs support a wide range of sensorimotor and higher-order cognitive functions. Mantini et al. identified 14 RSNs using independent component analysis (ICA), a data-driven statistical method that extracts maximally independent patterns of synchronized fMRI activity.Reference Mantini, Corbetta, Romani, Orban and Vanduffel 20 , Reference Calhoun, Adali, Pearlson and Pekar 21 These RSNs encompass distinct functional domains, including sensory-motor functions, language, attention, and associative cognitive processes like salience processing, self-referential thinking, and emotional regulation.Reference Mantini, Corbetta, Romani, Orban and Vanduffel 20
For example, the visual network (VN) is divided into the parafoveal and peripheral components, which together underlie visual sensory experiences and their integration into attention, memory, learning, and behavior.Reference Vaidya and Gordon 22 The somatomotor network (SMN), comprising dorsal and ventral subdivisions, integrates sensory and motor inputs for movement programming and execution and supports complex cognitive functions such as spatial navigation.Reference Russ, Mack, Grama, Lanfermann and Knopf 23 The auditory network (AN) supports auditory functions, from the processing of acoustic stimuli to their higher-level integration.Reference Zatorre and Gandour 24 The language network (LN) facilitates language production and comprehension, including phonological, lexical, semantic processing, and linguistic memory.Reference Fedorenko and Thompson-Schill 25 The dorsal attention network (DAN) and ventral attention network (VAN) interact to allocate attentional resources: the DAN is primarily involved in goal-directed, top-down attention, while the VAN is responsible for stimulus-driven, bottom-up attention.Reference Corbetta and Shulman 26 Additionally, the left and right frontoparietal networks (lFPN and rFPN, respectively) are crucial for executive functions, such as working memory, inhibitory control, and planning.Reference Ptak 27 The lateral and medial prefrontal networks (PFNs) are associated with executive control and self-referential thinking, respectively.Reference Beckmann, DeLuca, Devlin and Smith 28 , Reference D’Argembeau, Collette and Van der Linden 29 Finally, the cingulo-insular network (CIN) integrates cognition and emotion, monitoring interoceptive states and detecting salient stimuli.Reference Downar, Blumberger and Daskalakis 30
In the context of SZ, studies have primarily focused on alterations in the DMN, attention networks, and perceptual networks.Reference Hu, Zong and Mann 31 , Reference Dong, Wang, Chang, Luo and Yao 32 However, a fine-grained spatial comparison of RSNs between SZ patients and healthy controls (HCs) is still lacking.
To address this gap, we employed a single-subject ICA approach,Reference Calhoun, Adali, Pearlson and Pekar 21 which allows for the extraction of RSNs at an individual level while preserving unique functional patterns and accounting for across-subject variability, a crucial aspect for heterogeneous conditions like SZ.Reference Dong, Wang, Chang, Luo and Yao 32 In this context, single-subject ICA preserves the uniqueness of each patient’s neural characteristics, providing a potentially clinically relevant depiction of RSN alterations.Reference Esposito, Scarabino and Hyvarinen 33
Using this approach, we analyzed rs-fMRI data from SZ patients and HCs to explore differences in the spatial distribution of RSNs. Given the cognitive impairments associated with SZ,Reference Fioravanti, Bianchi and Cinti 34 we hypothesized that significant alterations compared to controls would be observed in networks related to cognitive functions.
Methods
Participants
The fMRI data used in this study were extracted from COINS (https://coins.trendscenter.org), an online, open-access database designed for research purposes that integrates data from multiple sources, including the Center for Biomedical Research Excellence (COBRE), MCIC (via the COINS database), the Functional Biomedical Informatics Research Network, XNAT Central, and the NUNDA and REDCap frameworks from Northwestern University. Access to these diverse data allows for large-scale studies with multisite, multidimensional, and multimodal analyses. The present study focused on a sample of SZ patients and HC who met the following requirements: (1) availability of rs-fMRI images, (2) availability of T1 structural MRI (sMRI) images, and (3) availability of the complete Positive And Negative Syndrome Scale (PANSS) scores for the SZ sample.Reference Kay, Fiszbein and Opler 35 Data from the COBRE project were used, collected from psychiatric patients at the UNM Psychiatric Center, the Raymond G. Murphy Veterans Affairs Medical Center, and other clinics in the Albuquerque metropolitan area (USA). The criteria for SZ patient inclusion were: (1) a diagnosis of SZ, confirmed by two psychiatrists using the DSM-IV Structured Clinical Interview for Axis I disorders (SCID)Reference First, Gibbon, Hilsenroth and Segal 36; (2) clinical stability assessed both 3 months prior to and during the MRI sessions; (3) age between 18 and 65 years old.
Healthy participants were also recruited in Albuquerque, with the following exclusion criteria based on the Structured Clinical Interview (SCID)-Non-Patient edition: (1) diagnosis of past or current Axis I psychiatric disorder, (2) head trauma with loss of consciousness lasting more than 5 minutes, (3) recent substance abuse or antidepressant use within the past 5 months, and (4) having a first-degree relative with a psychotic disorder. All participants provided written informed consent in the original study. Data access was facilitated by the Collaborative Informatics and Neuroimaging Suite Data Exchange (COINS, http://coins.mrn.org/dx), and COBRE-funded data collection occurred at the Mind Research Network, subject to the licensing procedures (5P20RR021938/P20GM103472) from the National Institutes of Health to Dr. Vince Calhoun. All data were anonymized before access to protect participants’ privacy. Structural and resting-state images were visually inspected to ensure the suitability of the sample.
MRI data acquisition
MRI data were acquired using a 3 T Siemens MR scanner (Trio, Siemens Healthcare, Erlangen, Germany). The acquisition protocol included sagittal-gradient echo scout images through the midline to obtain image slices that were axial, oblique, and parallel to the antero-posterior commissure line; in particular, oblique slices were used to minimize orbitofrontal susceptibility artifacts. rs-fMRI data were collected over 5 minutes using a single-shot, gradient echo-planar pulse sequence with lipid suppression, with the following parameters: number of volumes = 150, repetition time (TR) = 2000 ms, echo times (TE) = 29 ms, flip angle = 75°, field of view (FOV) = 240 mm, matrix size = 64 × 64, 33 slices, voxel size = 3.75 × 3.75 × 4.55 mm3. High-resolution T1-weighted sMRI images were collected using a multiecho MP-RAGE sequence (five echoes) with parameters: TE = 1.64, 3.5, 5.36, 7.22, 9.08 ms, TR = 2.53 seconds, Inversion Time) = 1.2 seconds, flip angle = 7°, number of excitations = 1, slice thickness = 1 mm, FOV = 256 mm, resolution = 256 × 256. The first image from each acquisition was removed to account for T1 equilibrium effects. Detailed scanning parameters are available at the COINS website. To control for head motion, we calculated the framewise displacement,Reference Power, Barnes, Snyder, Schlaggar and Petersen 37 computed as the sum of the absolute values of the derivatives of the translational and rotational realignment estimates at each timepoint. We used a cut-off score of 0.5 (mean ± standard error: FDHC = 0.36 ± 0.0023, FDSZ = 0.43 ± 0.0026).
fMRI data preprocessing
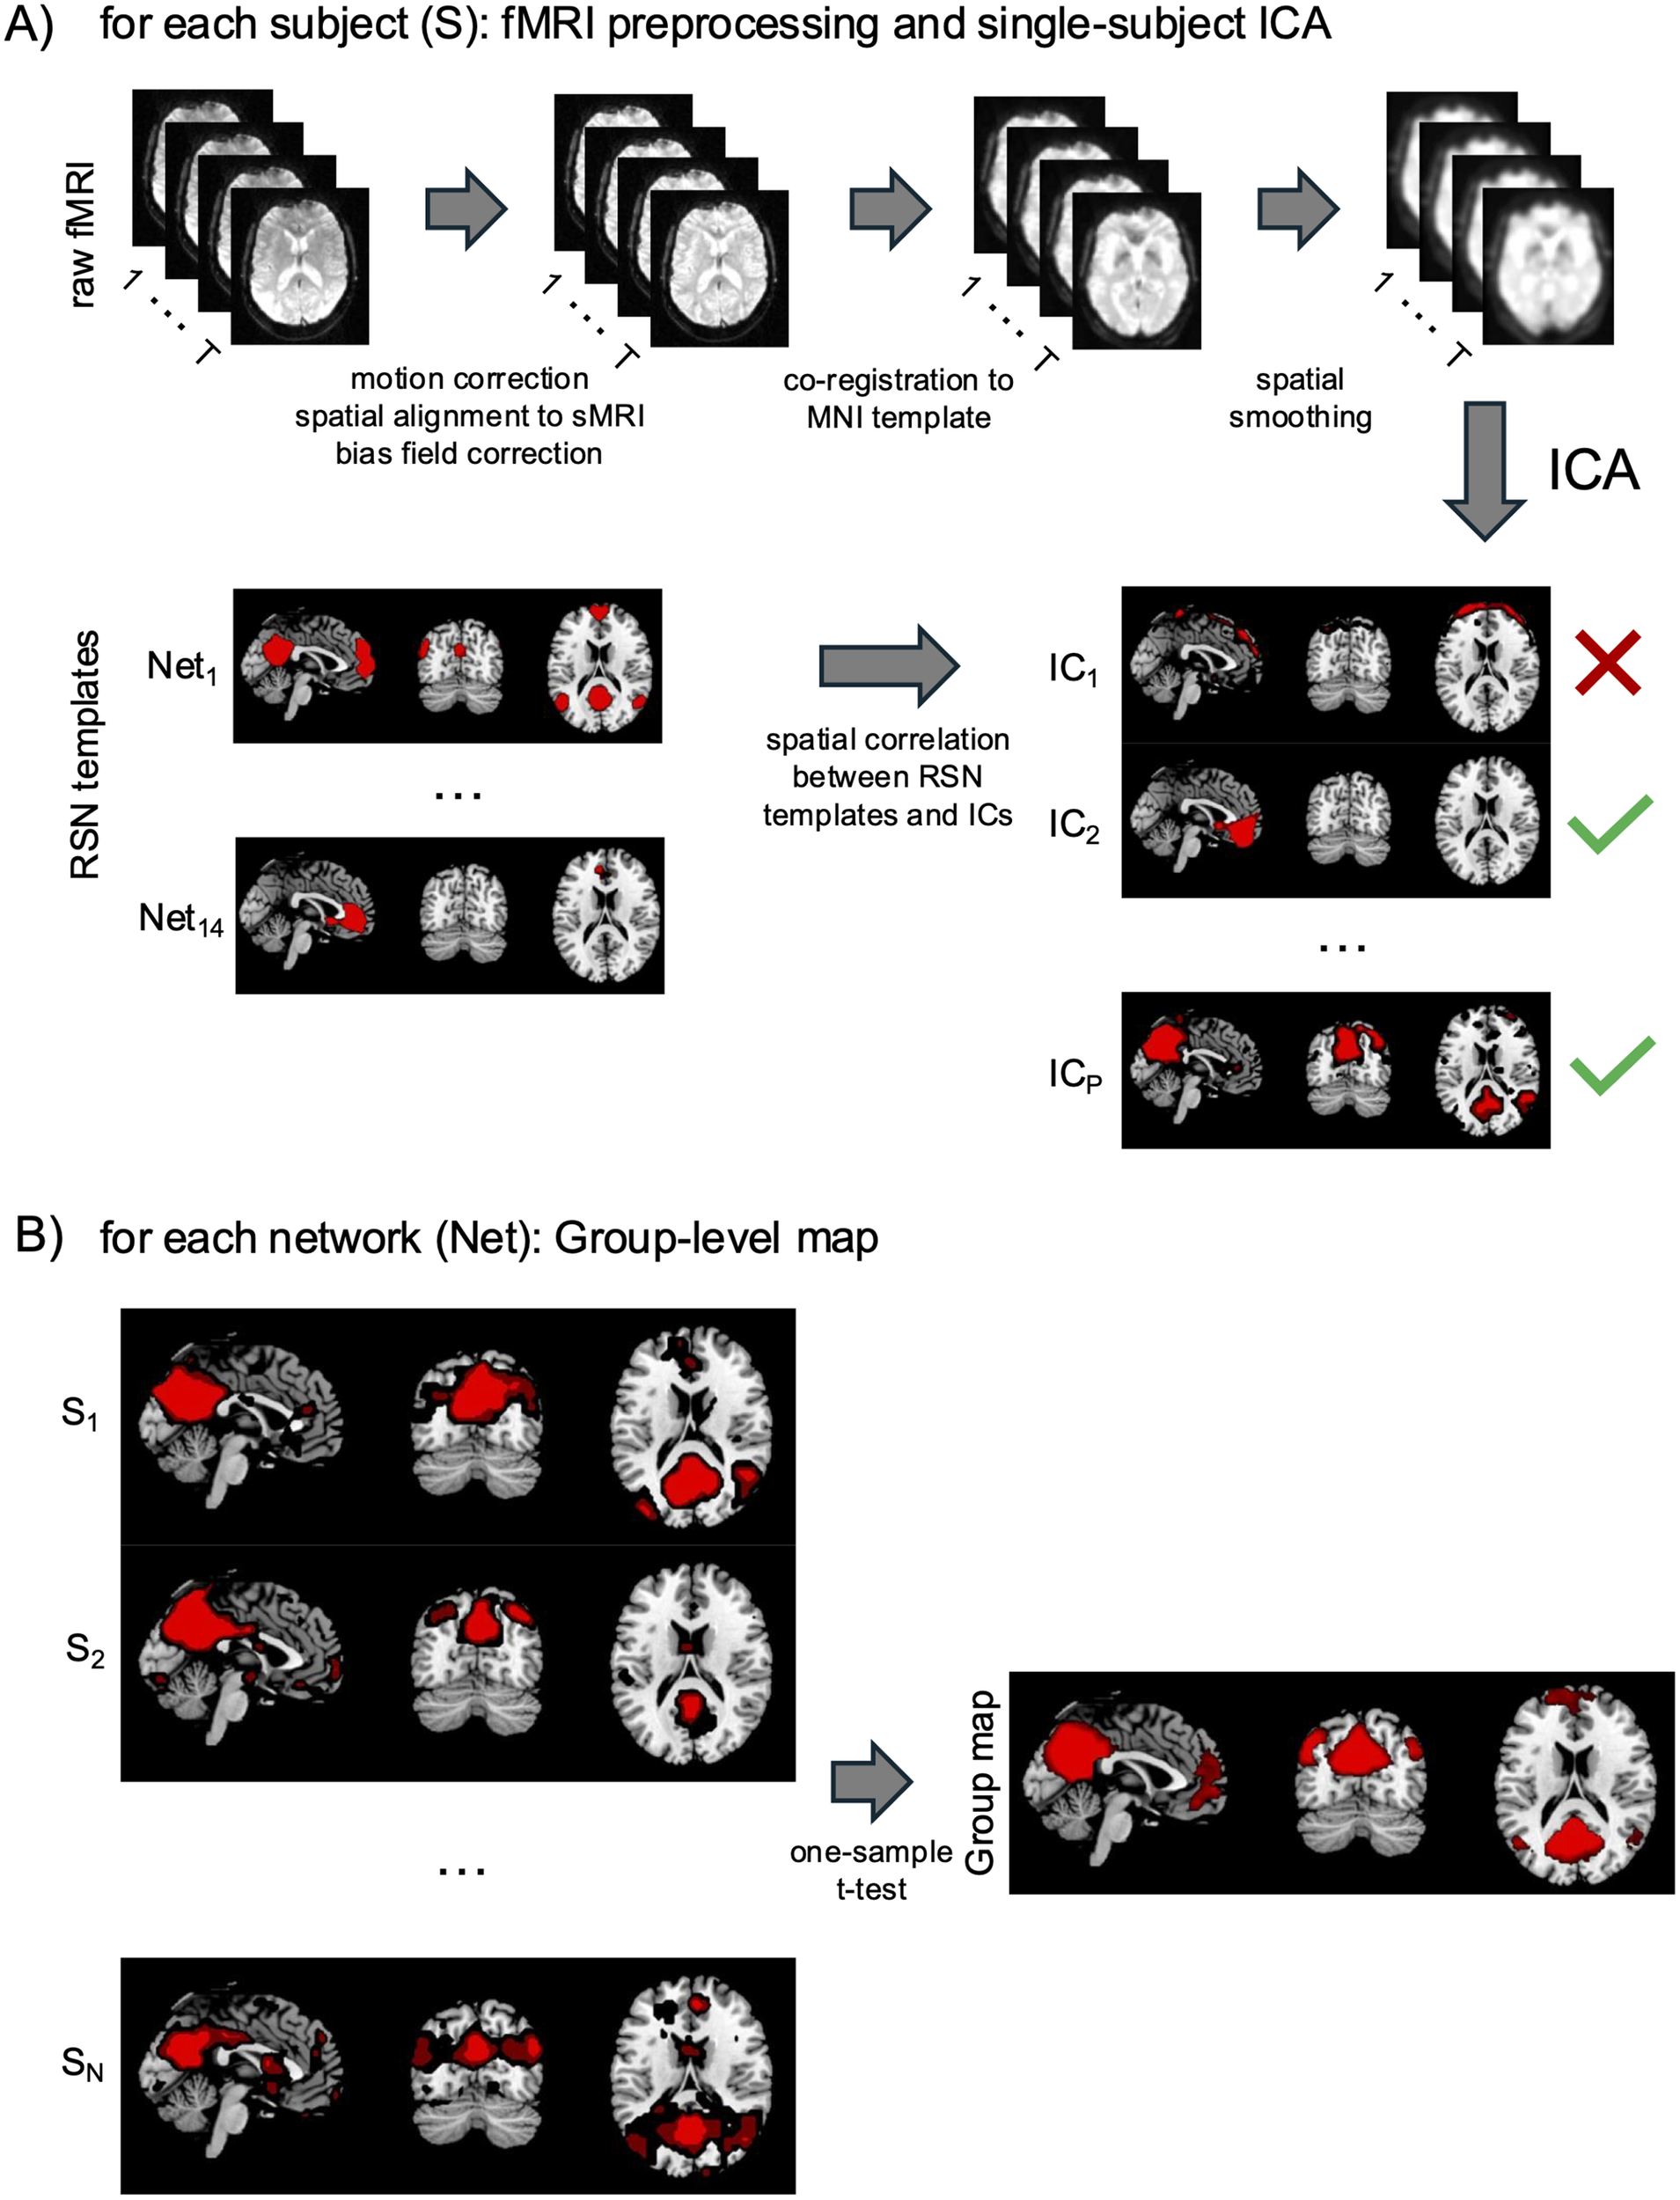
fMRI data preprocessing was carried out using built-in MATLAB (MathWorks, Natick, MA, United States) functions and the SPM12 software (http://www.fil.ion.ucl.ac.uk/spm/software/spm12/). sMRI data preprocessing included intensity nonuniformity correction and image segmentation. These steps were performed using the unified segmentation algorithm implemented in SPM12,Reference Calhoun, Adali, Pearlson and Pekar 38 with a regularization parameter of 0.0001 and a bias-field smoothing parameter of 40 mm full-width at half-maximum (FWHM). fMRI data preprocessing included motion correction, spatial alignment to sMRI, nonlinear normalization to standard space, and spatial smoothing with a 6 mm FWHM Gaussian kernel.Reference Mantini, Corbetta, Romani, Orban and Vanduffel 20 , Reference Ashburner and Friston 39 These steps were performed using an automated pipeline created using SPM12 (Figure 1a).
Automated workflow to obtain RSNs from fMRI data. This procedure is performed separately for each subject and includes the following steps: (A) fMRI data preprocessing and single-subject ICA. Raw fMRI data (with T representing the number of acquired volumes) are motion-corrected and spatially aligned to the individual sMRI. After bias field correction, the fMRI images are co-registered to the MNI template to transition from individual to standard space. The images are then spatially smoothed with a 6-mm full-width at half-maximum kernel. Independent component analysis (ICA) is performed, and the number of independent components (ICs, P) is estimated using the minimum description length criterion.Reference Marino, Arcara, Porcaro and Mantini 40 Some ICs represent artifacts (indicated by red crosses), while others reflect neural contributions and are associated with distinct RSNs (green checkmarks). This study considers 14 well-known RSNs. To identify neural ICs, spatial correlations between RSN templates and ICs are calculated. ICs with the highest correlation to a specific RSN template are matched, and the RSN name is assigned to the IC. For example, in this figure, Net 1 corresponds to the default mode network (DMN) template and shows the highest correlation with IC 2 , making IC 2 the single-subject DMN map. Similarly, Net P corresponds to the medial prefrontal network (PFN) template and is matched with IC P , representing the single-subject PFN map for the same subject. (B) Group-level correlation maps. Group maps for each network (Net) are obtained by combining the single-subject RSN maps. First, single-subject RSN maps are scaled to Z-scores for inter-subject comparison. Then, a one-sample t-test is applied to generate the group-level map.
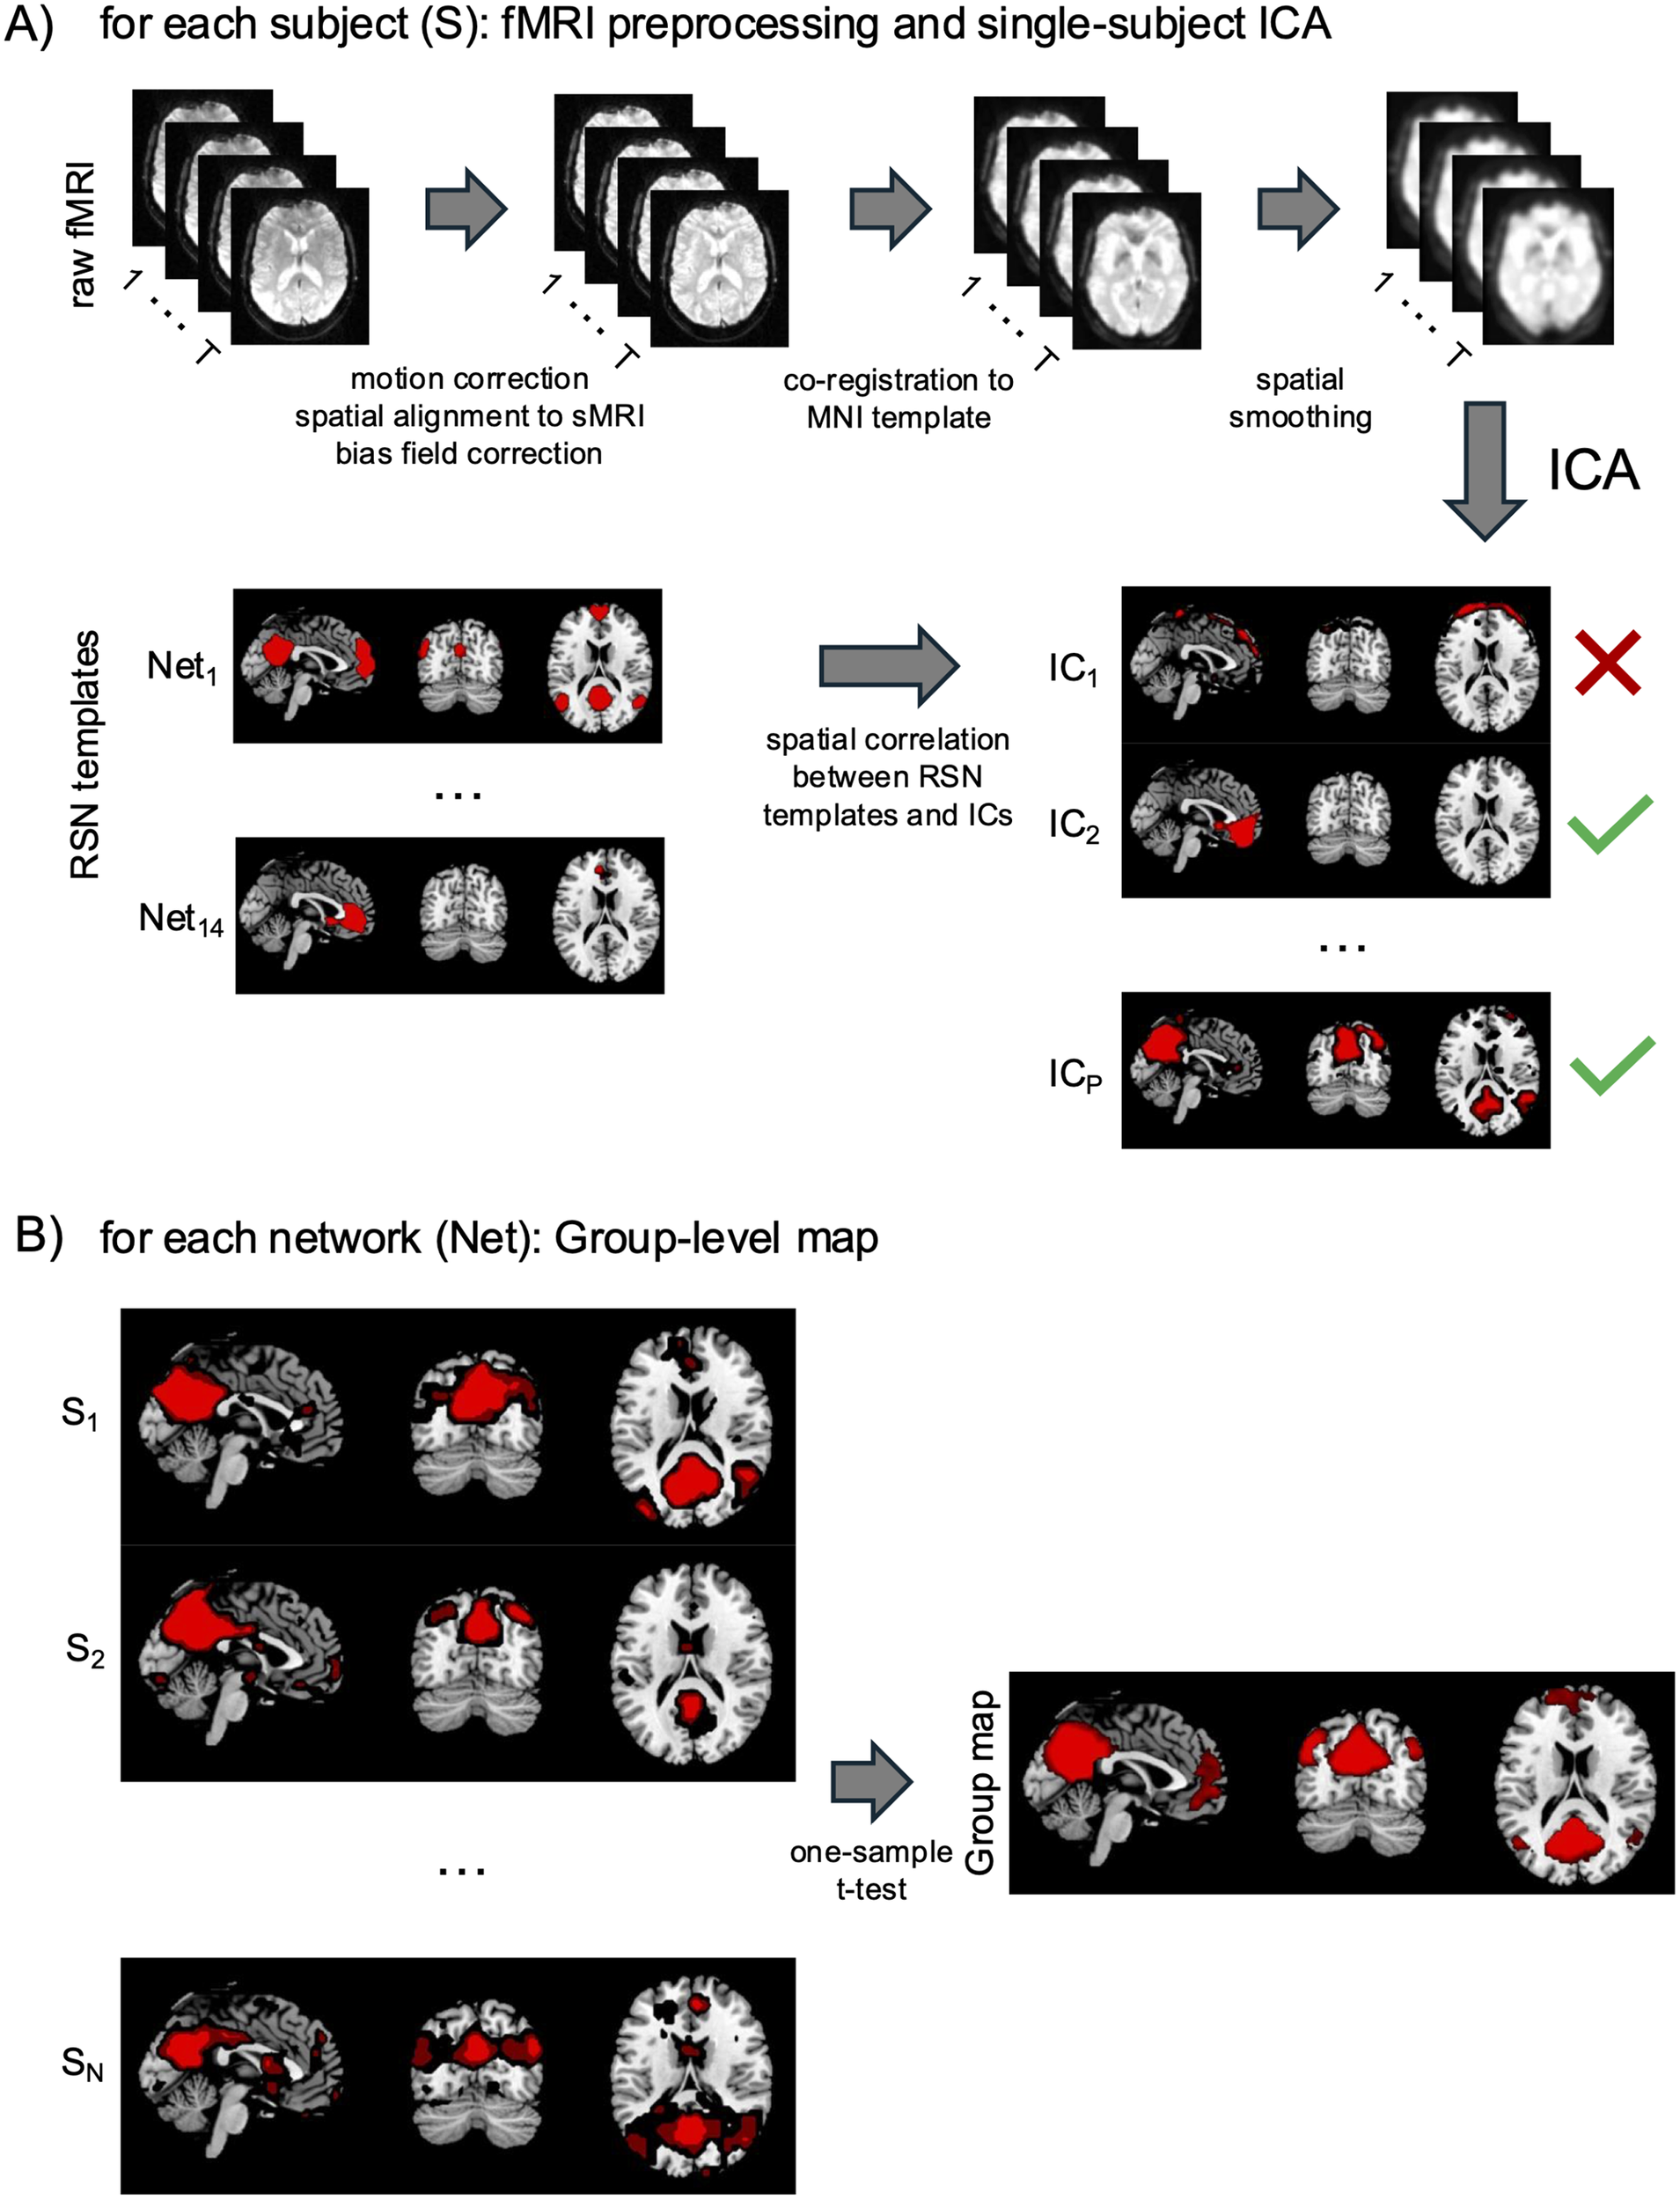
Figure 1 Long description
Figure 1 is a two-panel diagram illustrating the workflow used to derive RSNs from fMRI data. Panel A - fMRI preprocessing and single-subject ICA for each subject: The top portion of the panel shows a sequential left-to-right pipeline applied to each subject. A stack of raw fMRI brain images (grayscale axial slices, labeled with T to indicate the number of acquired volumes) is the starting point. A rightward arrow leads to the first processing stage, labeled "motion correction, spatial alignment to sMRI, bias field correction," followed by a new stack of processed images. A second arrow leads to "co-registration to MNI template," again followed by an updated image stack. A third arrow indicates "spatial smoothing," followed by a final preprocessed image stack. A large downward arrow labeled "ICA" indicates that Independent Component Analysis is then applied to the fully preprocessed data. Below the preprocessing pipeline, two columns of brain images are displayed side by side. On the left, RSNs templates are shown: Net₁ at the top (displaying a brain activation pattern in red overlaid on grayscale sagittal, coronal, and axial slices) through Net₁₄ at the bottom, with an ellipsis indicating intermediate RSNs. On the right, the independent components (ICs) derived from ICA are shown: IC₁ through ICP, with ellipses indicating intermediate components. A horizontal arrow between the two columns is labeled "spatial correlation between RSN templates and ICs." Each IC is marked with either a red cross, indicating an artifactual component to be discarded, or a green checkmark, indicating a neural component matched to a RSN. In the example shown, IC₁ is marked with a red cross (artifact); IC₂ is marked with a green checkmark (matched to Net₁, the DMN template, making IC2 the single-subject DMN map); ICp is marked with a green checkmark (matched to Net₁₄, the PFN template, making ICP the single-subject PFN map for the same subject). Panel B - Group-level map for each network: The bottom panel illustrates how individual subject maps are combined into a group-level RSN map. On the left, three rows of brain images represent individual subjects S₁, S₂, and SN (each row showing three brain slices, sagittal, coronal, and axial, with red activation overlays on a grayscale background). An ellipsis between S₂ and Sn indicates additional subjects not explicitly depicted. A rightward arrow labeled "one-sample t-test" leads to a single panel labeled "Group map" on the right, showing three brain slices with a red activation overlay representing the final group-level RSN.
fMRI connectivity analysis
Connectivity analysis was performed using ICA, a technique that extracts maximally independent patterns of coherent fMRI activity.Reference Calhoun, Adali, Pearlson and Pekar 21 This technique was applied separately to each dataset. The estimation of the number of independent components (ICs) was performed using the minimum description length criterion.Reference Calhoun, Adali, Pearlson and Pekar 21 ICs were retrieved using the FastICA algorithm, with a deflation approach and hyperbolic tangent (tanh) nonlinearity.Reference Esposito, Scarabino and Hyvarinen 33 For each IC, a spatial map and an associated time series were extracted (Figure 1a). The spatial map represented the intensity of the activity across the voxels of that pattern, whereas the time series reflected its course over time.Reference Mantini, Corbetta, Perrucci, Romani and Del Gratta 41 To display the voxels contributing most strongly to a given IC and to allow inter-subject comparison, the intensity values in each map were scaled to Z-scores. This was done by subtracting the average intensity across voxels and dividing the resulting map by the standard deviation across voxels. The ICs corresponding to 14 known RSNs, including DMN, CIN, DAN, VAN, dorsal SMN, ventral SMN, early AN, LN, lateral PFN, medial PFN, left FPN, right FPN, parafoveal VN, and peripheral VN were identified using an automated template-matching procedure, in which each considered RSN-template was derived from our previous fMRI study.Reference Mantini, Corbetta, Romani, Orban and Vanduffel 20 Each RSN was identified as the IC showing the highest spatial correlation with its corresponding template map in Montreal Neurological Institute (MNI) space. To extend the ICA analysis from the single subjects to the group, a group-level map was obtained by performing a one-sample, one-sided t-test, using a mass-univariate analysis on the individual RSN maps (Figure 1b). In this approach, each voxel identified as significant in the results indicates that its mean z-score across subjects was significantly greater than zero at the group level. The resulting statistical maps were corrected for multiple comparisons across voxels using the Benjamini–Hochberg false discovery rate (BH-FDR) procedure.Reference Benjamini and Hochberg 42 The significance threshold for each RSN group-level map was set to q < 0.01, BH-FDR corrected. Comparison between the SZ and HC groups was performed, separately for each RSN, by using a two-sample t-test for the individual RSN maps to detect regional differences between the two groups. The significance threshold for each RSN comparison was set to q < 0.01, BH-FDR corrected.
Results
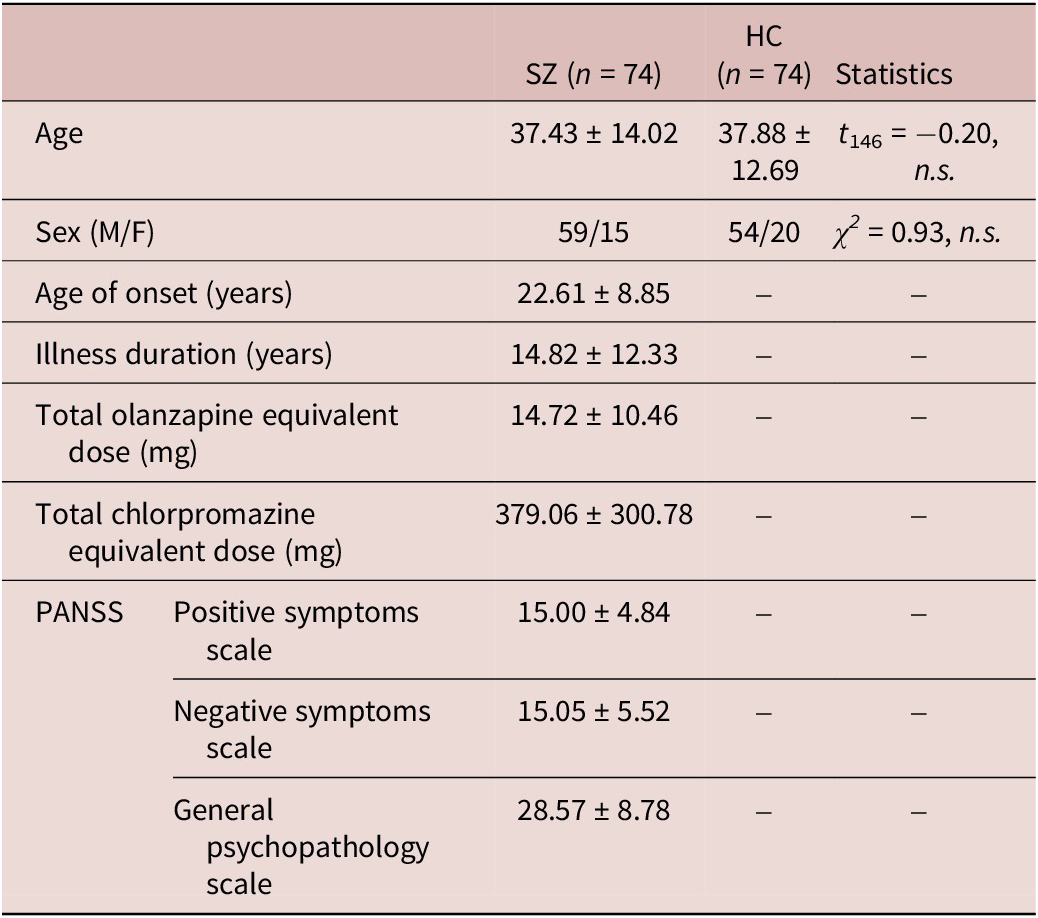
The final dataset included 74 SZ patients and 74 HC, with similar age and sex distribution (Table 1). Clinical characteristics of the SZ patients, including average age of onset, illness duration, antipsychotic treatment (converted to olanzapine and chlorpromazine equivalents), and PANSS scores are also reported in Table 1. All patients were in the chronic phase of the disease and were receiving antipsychotic treatment.
Demographic and clinical characteristics of the studied sample
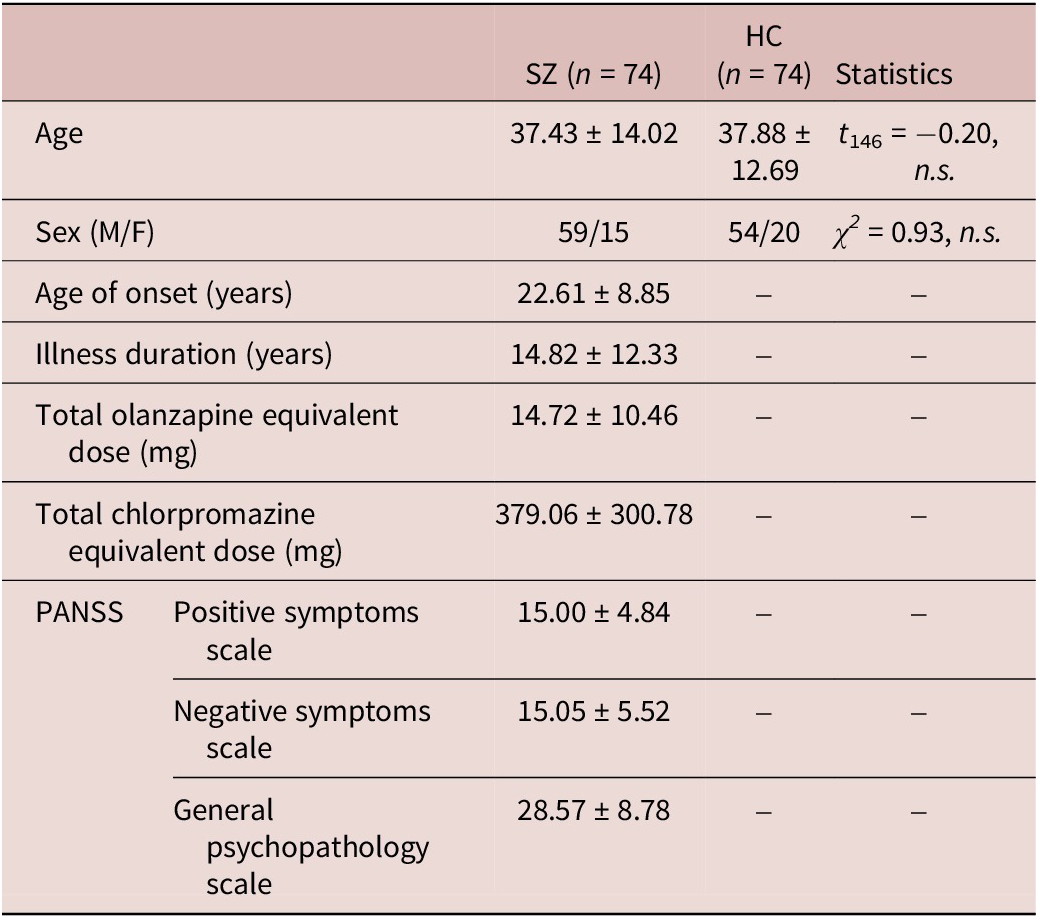
Table 1. Long description
Table 1 presents demographic and clinical characteristics of the study sample, organized in a four-column layout. The first column lists the variable names; the second and third columns report values for the two groups schizophrenia patients (SZ, n=74) and healthy controls (HC, n=74) respectively, expressed as mean ± standard deviation unless otherwise noted; the fourth column reports the between-group statistical test result. A dash (-) indicates that a variable was not applicable or not assessed for that group. The table then contains the following rows: Age: SZ = 37.43 ± 14.02; HC = 37.88 ± 12.69; Statistics: t₁₄₆ = −0.20, n.s. Sex (M/F): SZ = 59 males / 15 females; HC = 54 males / 20 females; Statistics: χ² = 0.93, n.s. Age of onset (years): SZ = 22.61 ± 8.85; HC = -; Statistics = - Illness duration (years): SZ = 14.82 ± 12.33; HC = -; Statistics = - Total olanzapine equivalent dose (mg): SZ = 14.72 ± 10.46; HC = -; Statistics = - Total chlorpromazine equivalent dose (mg): SZ = 379.06 ± 300.78; HC = -; Statistics = -PANSS - Positive symptoms scale: SZ = 15.00 ± 4.84; HC = -; Statistics = - PANSS - Negative symptoms scale: SZ = 15.05 ± 5.52; HC = -; Statistics = - PANSS - General Psychopathology scale: SZ = 28.58 ± 8.78; HC = -; Statistics = - The two groups were matched for age and sex, as indicated by the non-significant statistical tests (n.s.). Clinical variables (age of onset, illness duration, medication doses, and PANSS subscale scores) were only available for the SZ group and therefore have no corresponding HC values or between-group statistics.
Note: Mean ± standard deviation of age, age of onset, illness duration, pharmacological treatment, and PANSS scores were considered.
We analyzed the spatial maps of 14 RSNs extracted with single-subject ICA for SZ patients and HC, followed by statistical comparison to identify voxel-wise differences between the two groups. Statistical maps showed significant differences (q < 0.01, BH-FDR corrected) between the two groups in each network in terms of increased or decreased connectivity patterns.
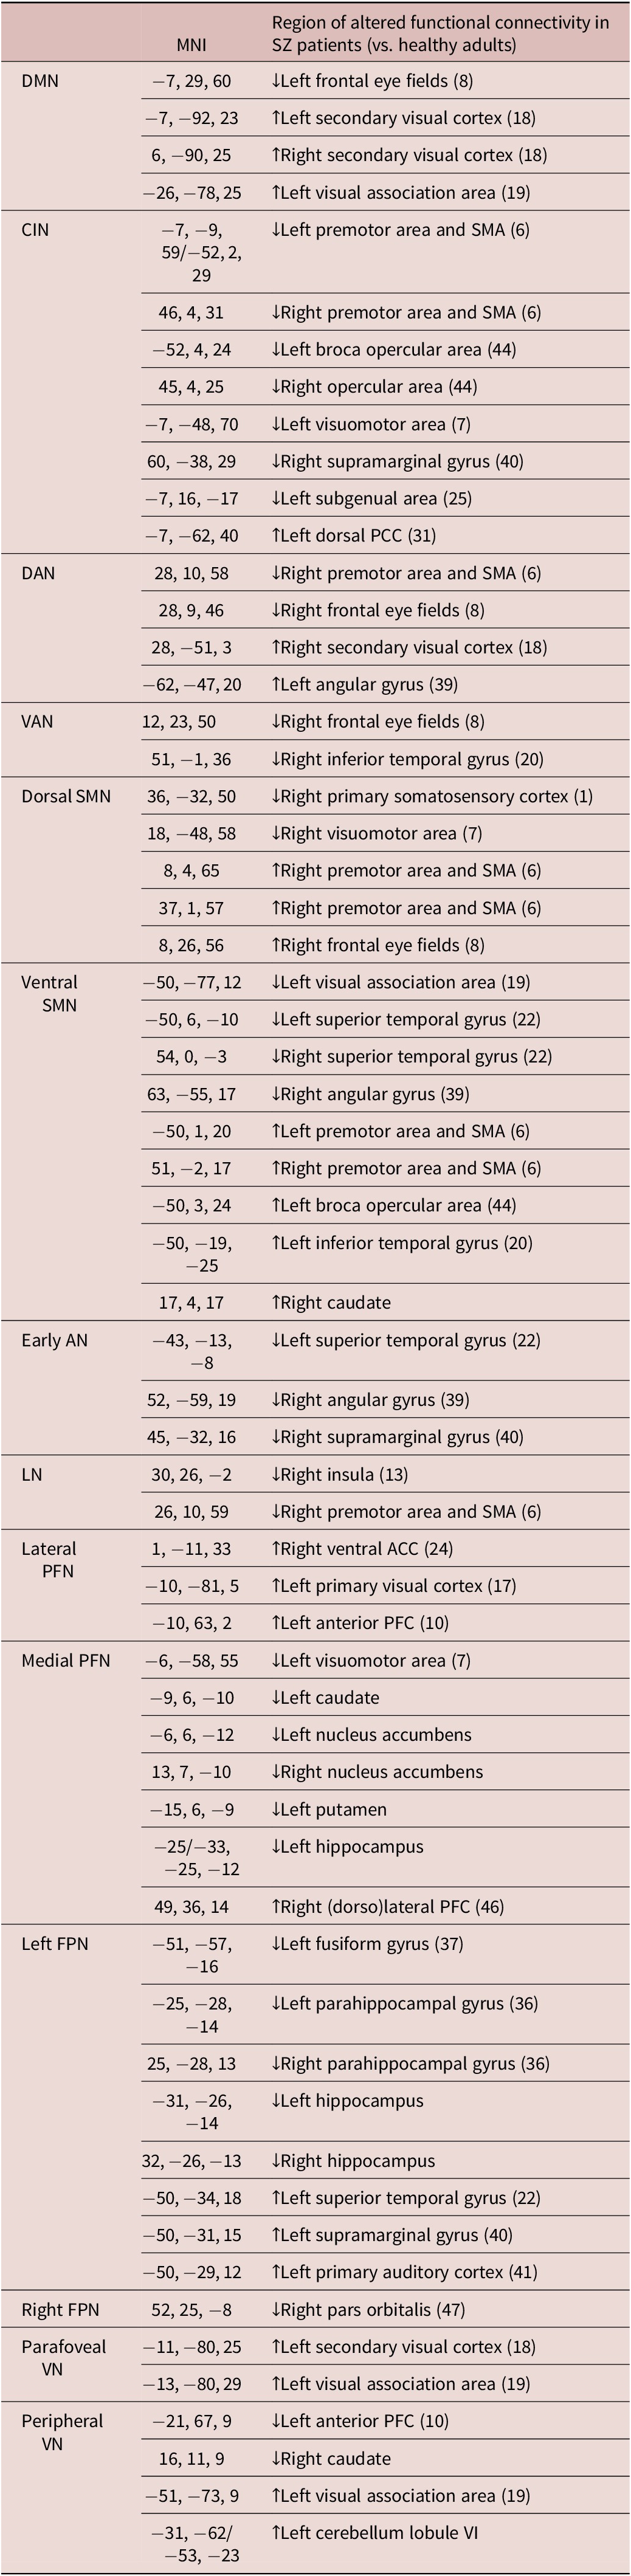
The complete list of the altered RSN connectivity patterns in SZ patients compared to HC is summarized in Table 2.
Summary of the fMRI RSN altered pattern in SZ patients compared to HC
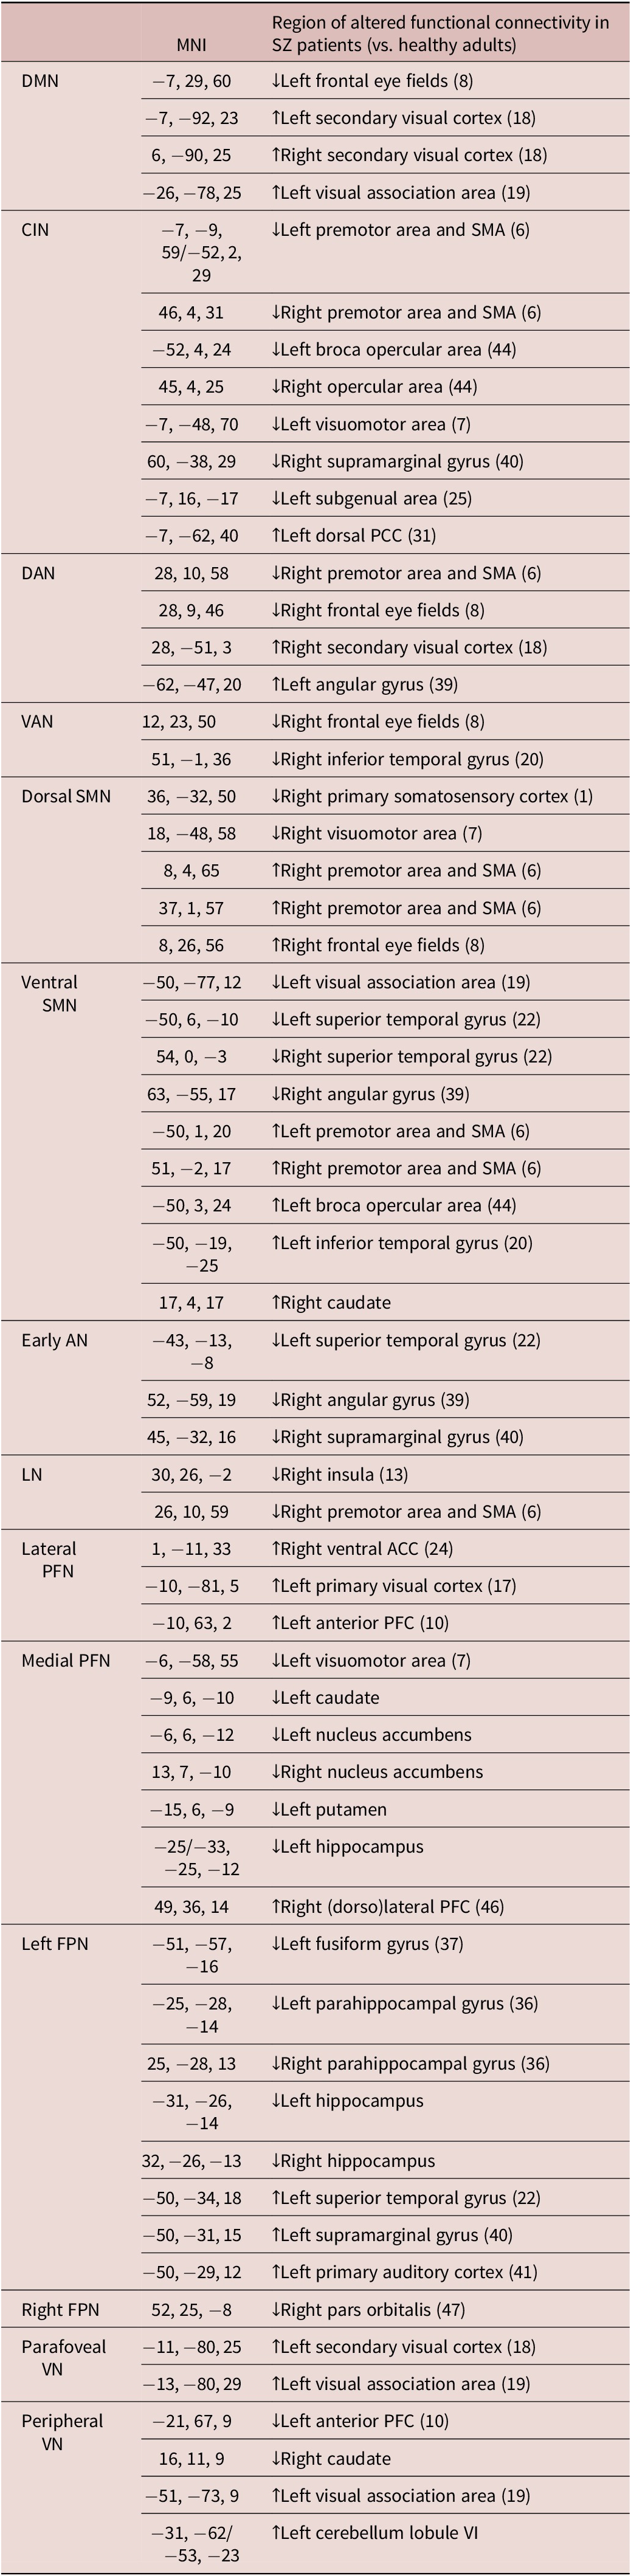
Table 2. Long description
Table 2 summarizes the resting-state networks (RSNs) showing altered functional connectivity in schizophrenia patients (SZ) compared to healthy controls (HC). The table has three columns: (1) the RSN name; (2) the MNI coordinates (x, y, z) of the between-group differences; (3) a color-coded directional indicator (blue indicating lower functional connectivity in SZ vs. HC, red indicating higher functional connectivity in SZ vs. HC) and the corresponding anatomical label with Brodmann Area (BA) in parentheses. The rows are grouped by RSN as follows: within the DMN, Left Frontal Eye Fields (BA 8, MNI coordinates: -7, 29, 60) is marked by blue indicator, while Left Secondary Visual cortex (BA 18, MNI coordinates: -7, -92, 23), Right Secondary Visual cortex (BA 18, MNI coordinates: 6, -90, 25), and Left Visual Association area (BA 19, MNI coordinates: -26, -78, 25) are marked by red indicators; Within the CIN, Left Premotor area and SMA (BA 6, MNI coordinates: -7, -9, 59 / -52, 2, 29), Right Premotor area and SMA (BA 6, MNI coordinates: 46, 4, 31), Left Broca opercular area (BA 44, MNI coordinates: -52, 4, 24), Right opercular area (BA 44, MNI coordinates: 45, 4, 25), Left Visuo-motor area (BA 7, MNI coordinates: -7, -48, 70), Right Supramarginal gyrus (BA 40, MNI coordinates: 60, -38, 29), Left Subgenual area (BA 25, MNI coordinates: -7, 16, -17) are all marked by blue indicators, while Left Dorsal PCC (BA 31, MNI coordinates: -7, -62, 40) is marked by red indicator; Within the DAN, Right Premotor area and SMA (BA 6, MNI coordinates: 28, 10, 58) and Right Frontal Eye Fields (BA 8, MNI coordinates: 28, 9, 46) are marked by blue indicators, while Right Secondary Visual cortex (BA 18, MNI coordinates: 28, -51, 3), and Left Angular gyrus (BA 39, MNI coordinates: -62, -47, 20) are marked by red indicators; Within the VAN, Right Frontal Eye Fields (BA 8, MNI coordinates: 12, 23, 50) and Right Inferior Temporal gyrus (BA 20, MNI coordinates: 51, -1, 36) are both marked by blue indicators; Within the Dorsal SMN, Right Primary Somatosensory cortex (BA 1, MNI coordinates: 36, -32, 50) and Right Visuo-Motor area (BA 7, MNI coordinates: 18, -48, 58) are marked by blue indicators, while Right Premotor area and SMA (BA 6, MNI coordinates: 8, 4, 65 and 37, 1, 57), and Right Frontal Eye Fields (BA 8, MNI coordinates: 8, 26, 56) are marked by red indicators; Within the Ventral SMN, Left Visual Association area (BA 19, MNI coordinates: -50, -77, 12), Left Superior Temporal gyrus (BA 22, MNI coordinates: -50, 6, -10), Right Superior Temporal gyrus (BA 22, MNI coordinates: 54, 0, -3), and Right Angular gyrus (BA 39, MNI coordinates: 63, -55, 17) are marked by blue indicators, while Left Premotor area and SMA (BA 6, MNI coordinates: -50, 1, 20), Right Premotor area and SMA (BA 6, MNI coordinates: 51, -2, 17), Left Broca opercular area (BA 44, MNI coordinates: -50, 3, 24), Left Inferior Temporal gyrus (BA 20, MNI coordinates: -50, -19, -25), and Right Caudate (MNI coordinates: 17, 4, 17) are marked by red indicators; Within the Early AN, Left Superior Temporal gyrus (BA 22, MNI coordinates: -43, -13, -8), Right Angular gyrus (BA 39, MNI coordinates: 52, -59, 19), and Right Supramarginal gyrus (BA 40, MNI coordinates: 45, -32, 16) are all marked by blue indicators; Within the LN, Right Insula (BA 13, MNI coordinates: 30, 26, -2) and Right Premotor area and SMA (BA 6, MNI coordinates: 26, 10, 59) are both marked by blue indicators; Within the Lateral PFN, Right Ventral ACC (BA 24, MNI coordinates: 1, -11, 33), Left Primary Visual cortex (BA 17, MNI coordinates: -10, -81, 5), Left Anterior PFC (BA 10, MNI coordinates: -10, 63, 2) are all marked by red indicators; Within the Medial PFN, Left Visuo-Motor area (BA 7, MNI coordinates: -6, -58, 55), Left Caudate (MNI coordinates: -9, 6, -10), Left Nucleus Accumbens (MNI coordinates: -6, 6, -12), Right Nucleus Accumbens (MNI coordinates: 13, 7, -10), Left Putamen (MNI coordinates: -15, 6, -9), and Left Hippocampus (MNI coordinates: -25/-33, -25, -12) are all marked by blue indicators, while Right (Dorso)lateral PFC (BA 46, MNI coordinates: 49, 36, 14) is marked by red indicator; Within the Left FPN, Left Fusiform gyrus (BA 37, MNI coordinates: -51, -57, -16), Left Parahippocampal gyrus (BA 36, MNI coordinates: -25, -28, -14), Right Parahippocampal gyrus (BA 36, MNI coordinates: 25,- 28, 13), Left Hippocampus (MNI coordinates: -31, -26, -14), and Right Hippocampus (MNI coordinates: 32, -26, -13) are marked by blue indicators, while Left Superior Temporal gyrus (BA 22, MNI coordinates: -50, -34, 18), Left Supramarginal gyrus (BA 40, MNI coordinates: -50, -31, 15), and Left Primary Auditory cortex (BA 41, MNI coordinates: -50, -29, 12) are marked by red indicators; Within the Right FPN, Right Pars Orbitalis (BA 47, MNI coordinates: 52, 25, -8) is marked by a blue indicator; Within the Parafoveal VN, Left Secondary Visual cortex (BA 18, MNI coordinates: -11, -80, 25) and Left Visual Association area (BA 19, MNI coordinates: -13, -80, 29) are both marked by red indicators; Within the Peripheral VN, Left Anterior PFC (BA 10, MNI coordinates: -21, 67, 9) and Right Caudate (MNI coordinates: 16, 11, 9) are marked by blue indicators, while Left Visual Association area (BA 19, MNI coordinates: -51, -73, 9), and Left Cerebellum Lobule VI (MNI coordinates: -31, -62/-53, -23) are marked by red indicators.
Note: Blue arrows = lower functional connectivity in SZ versus HC; Red arrows = higher functional connectivity in SZ versus HC; BA, Brodmann area.
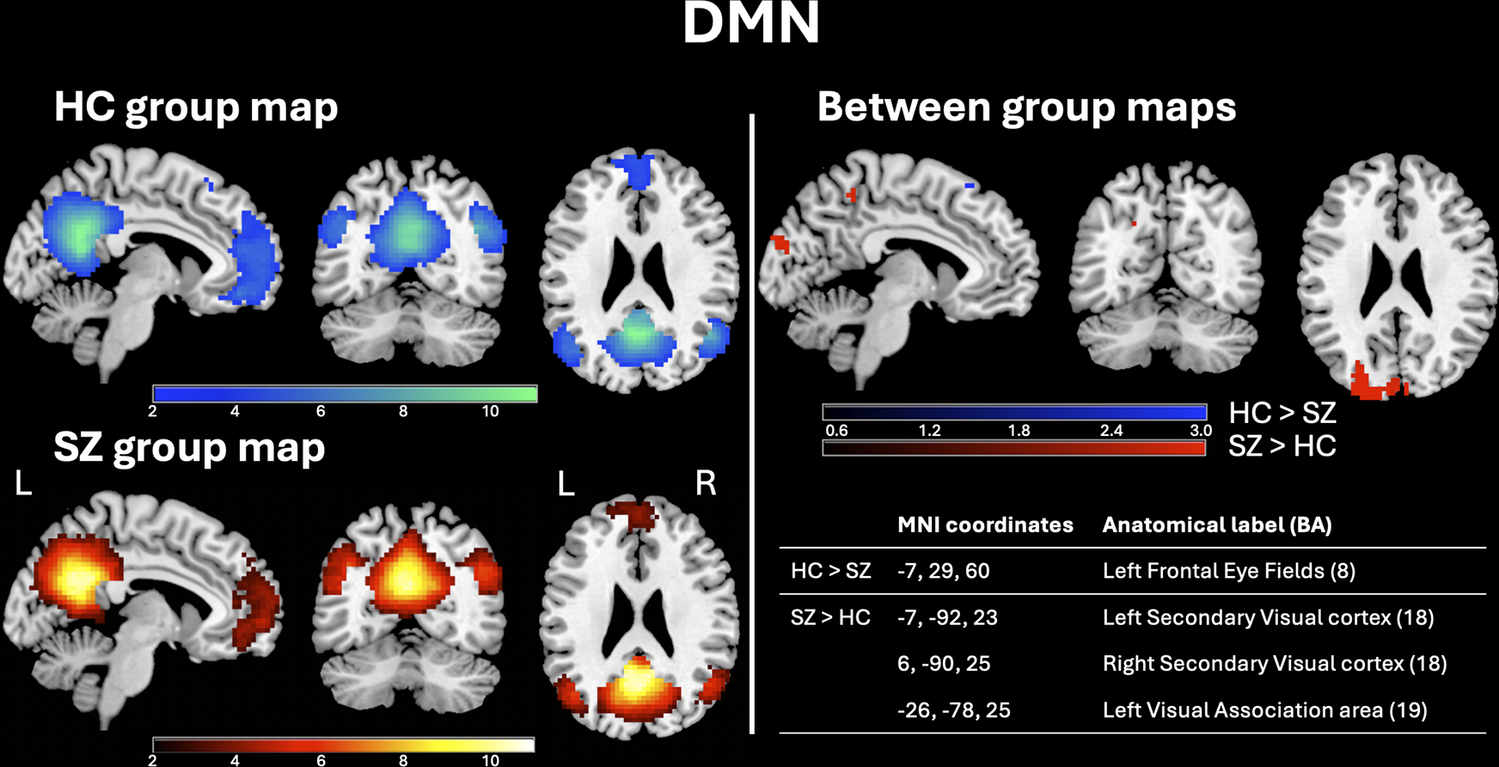
The DMN in SZ patients showed reduced connectivity in left frontal eye fields (BA 8), and increased connectivity in left and right secondary visual cortex (BA 18) and left visual association area (BA 19) (Figure 2).
DMN group maps in HC and SZ patients and between-group statistical maps. Left panel: Random-effects group-level maps for the DMN in HC (top row, blue color scale) and SZ patients (bottom row, red color scale). Right panel: Random-effects group-level t-map for the difference between HC and SZ patients (blue/red color scales depending on the group contrast). The reported q-values (<0.01) were corrected for the FDR both for the random-effects group-level t-maps of each group and for the random-effects group-level t-maps of their comparison.
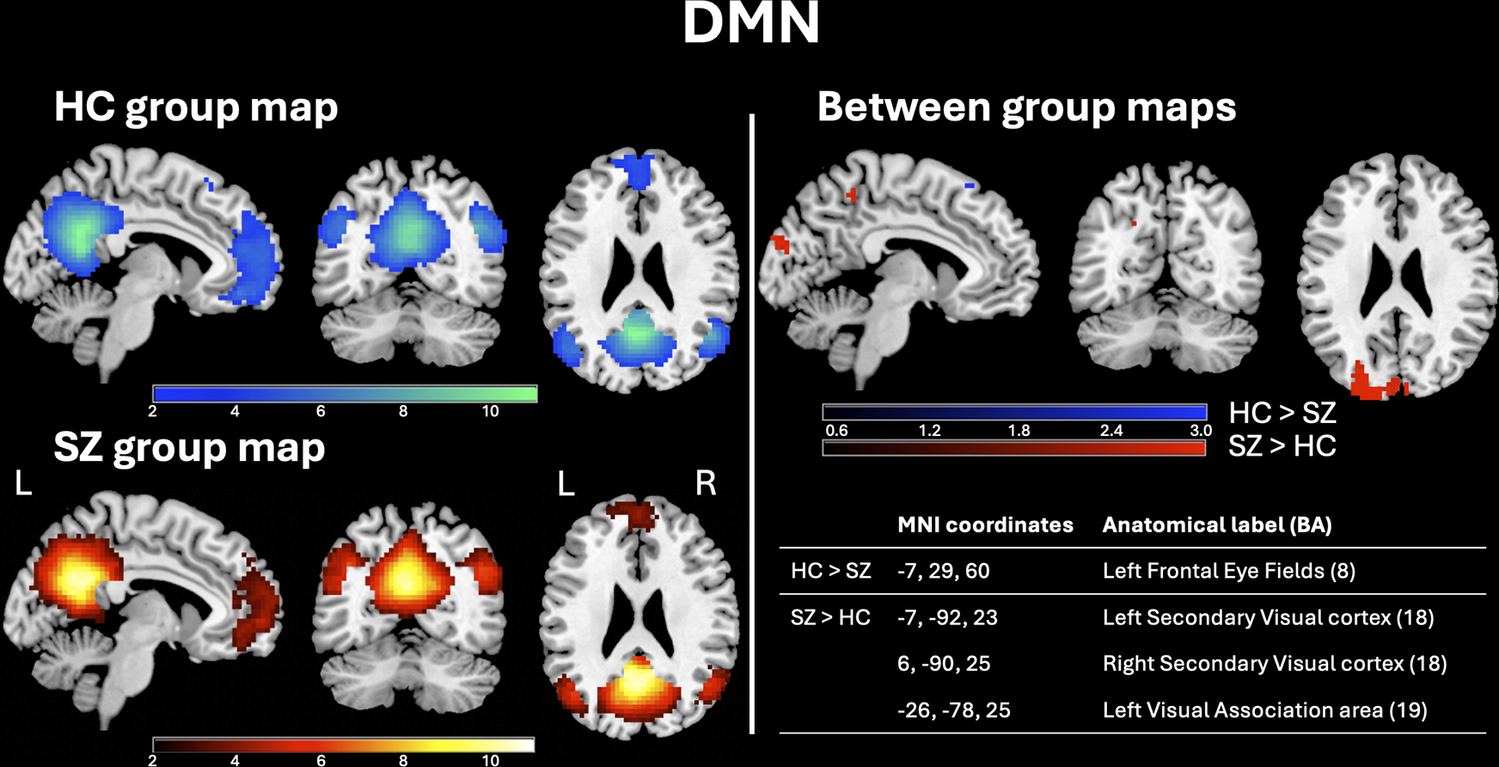
Figure 2 Long description
Figure 2 is titled "DMN" (Default Mode Network) and is divided into two main panels separated by a vertical line, each displayed against a black background. Left panel - Group maps: The left panel contains two rows of three brain slices each (sagittal, coronal, and axial views; labels "L" (left) and "R" (right) are shown on the coronal slice), showing within-group activation maps of the DMN. Top row - HC group map: Activation is displayed using a blue color scale, with t-values ranging from 2 to 10 (indicated by a horizontal color bar below the images). Bottom row - SZ group map: Activation is displayed using a red color scale, with t-values ranging from 2 to 10 (indicated by a horizontal color bar below the images). Right panel - Between-group differences maps and related coordinates table: The right panel is subdivided into an upper section with brain images and a lower section with a table. Upper section - Between-group differences maps: Three brain slices (sagittal, coronal, axial) show regions where the two groups differ significantly. A color bar ranging from 0.6 to 3.0 is shown below the images, with a blue color scale indicating regions where healthy controls show greater connectivity than schizophrenia patients, and a red color scale indicating regions where schizophrenia patients show greater connectivity than healthy controls. Lower section - Coordinates table: An embedded table lists the MNI coordinates and corresponding anatomical labels (Brodmann Areas) for each significant between-group area: The DMN in SZ patients showed reduced connectivity in Left Frontal Eye Fields (BA 8, MNI coordinates: −7,29,60), and increased connectivity in Left Secondary Visual cortex (BA 18, MNI coordinates: -7,-92,23), Right Secondary Visual cortex (BA 18, MNI coordinates: 6,-90,25) and Left Visual Association area (BA 19, MNI coordinates: -26,-78,25).
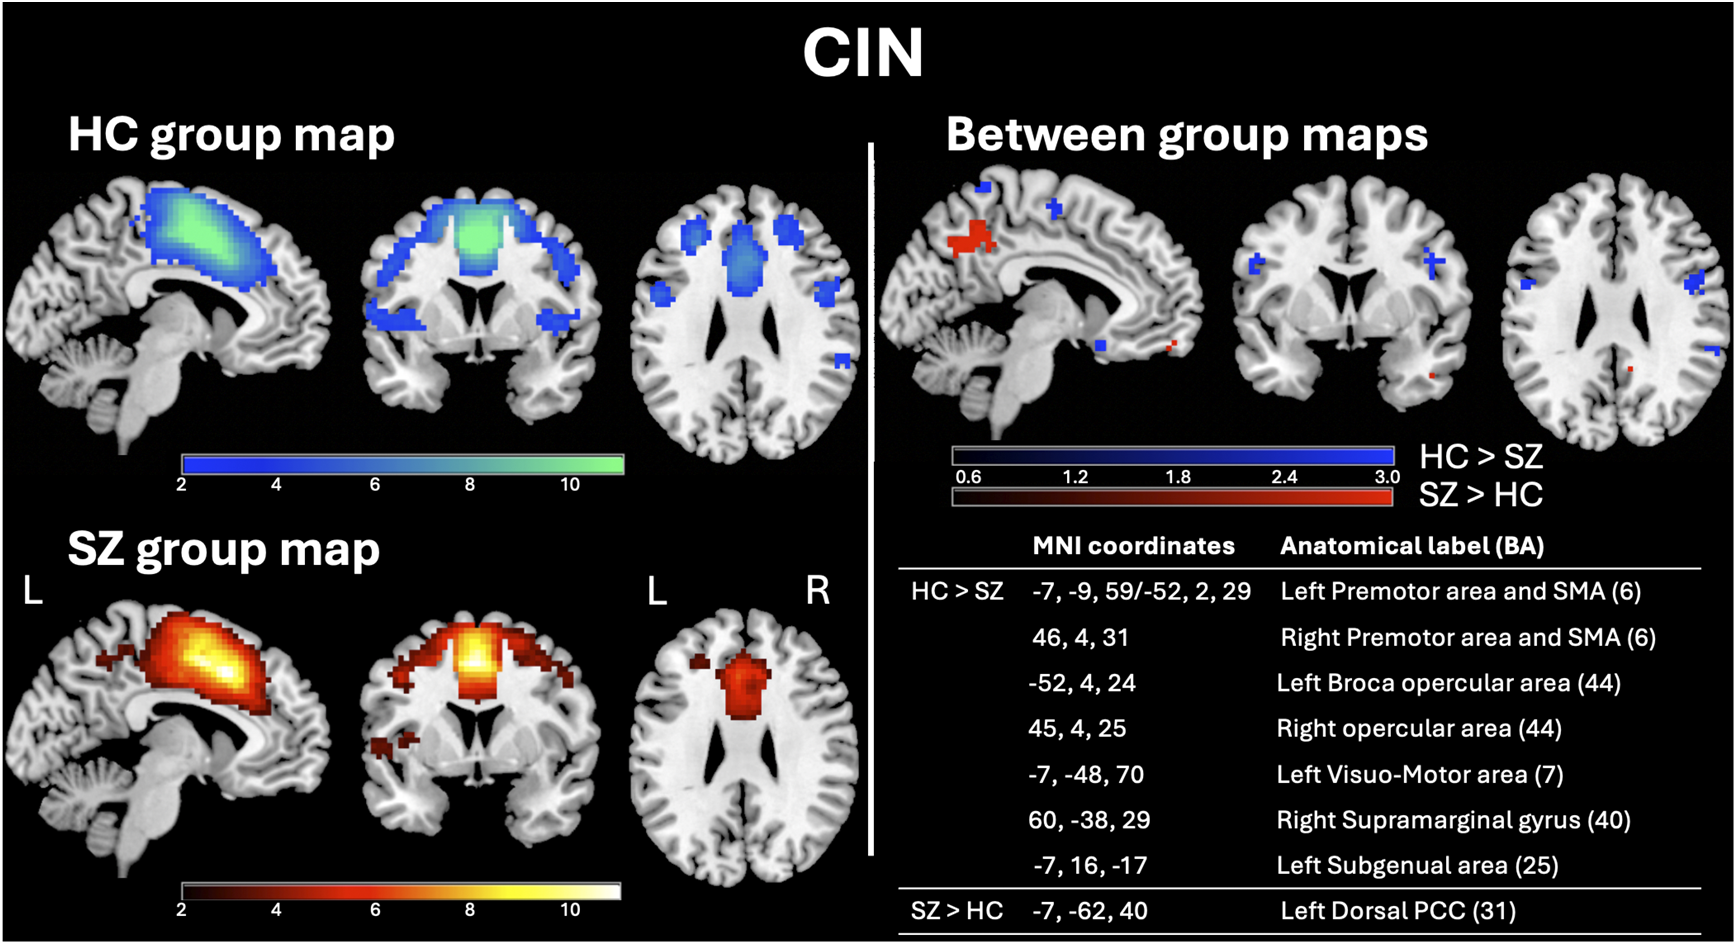
The CIN in SZ patients showed reduced connectivity in left and right premotor area and supplementary motor area (SMA) (BA 6), left and right broca opercular area (BA 44), left visuomotor area (BA 7), right supramarginal gyrus (BA 40), and left subgenual area (BA 25), while increased connectivity was present in left dorsal posterior cingulate cortex (PCC) (BA 31) Figure 3.
CIN group maps in HC and SZ patients and between-group statistical maps. Left panel: Random-effects group-level maps for the CIN in HC (top row, blue color scale) and SZ patients (bottom row, red color scale). Right panel: Random-effects group-level t-map for the difference between HC and SZ patients (blue/red color scales depending on the group contrast). The reported q-values (<0.01) were corrected for the FDR both for the random-effects group-level t-maps of each group and for the random-effects group-level t-maps of their comparison.
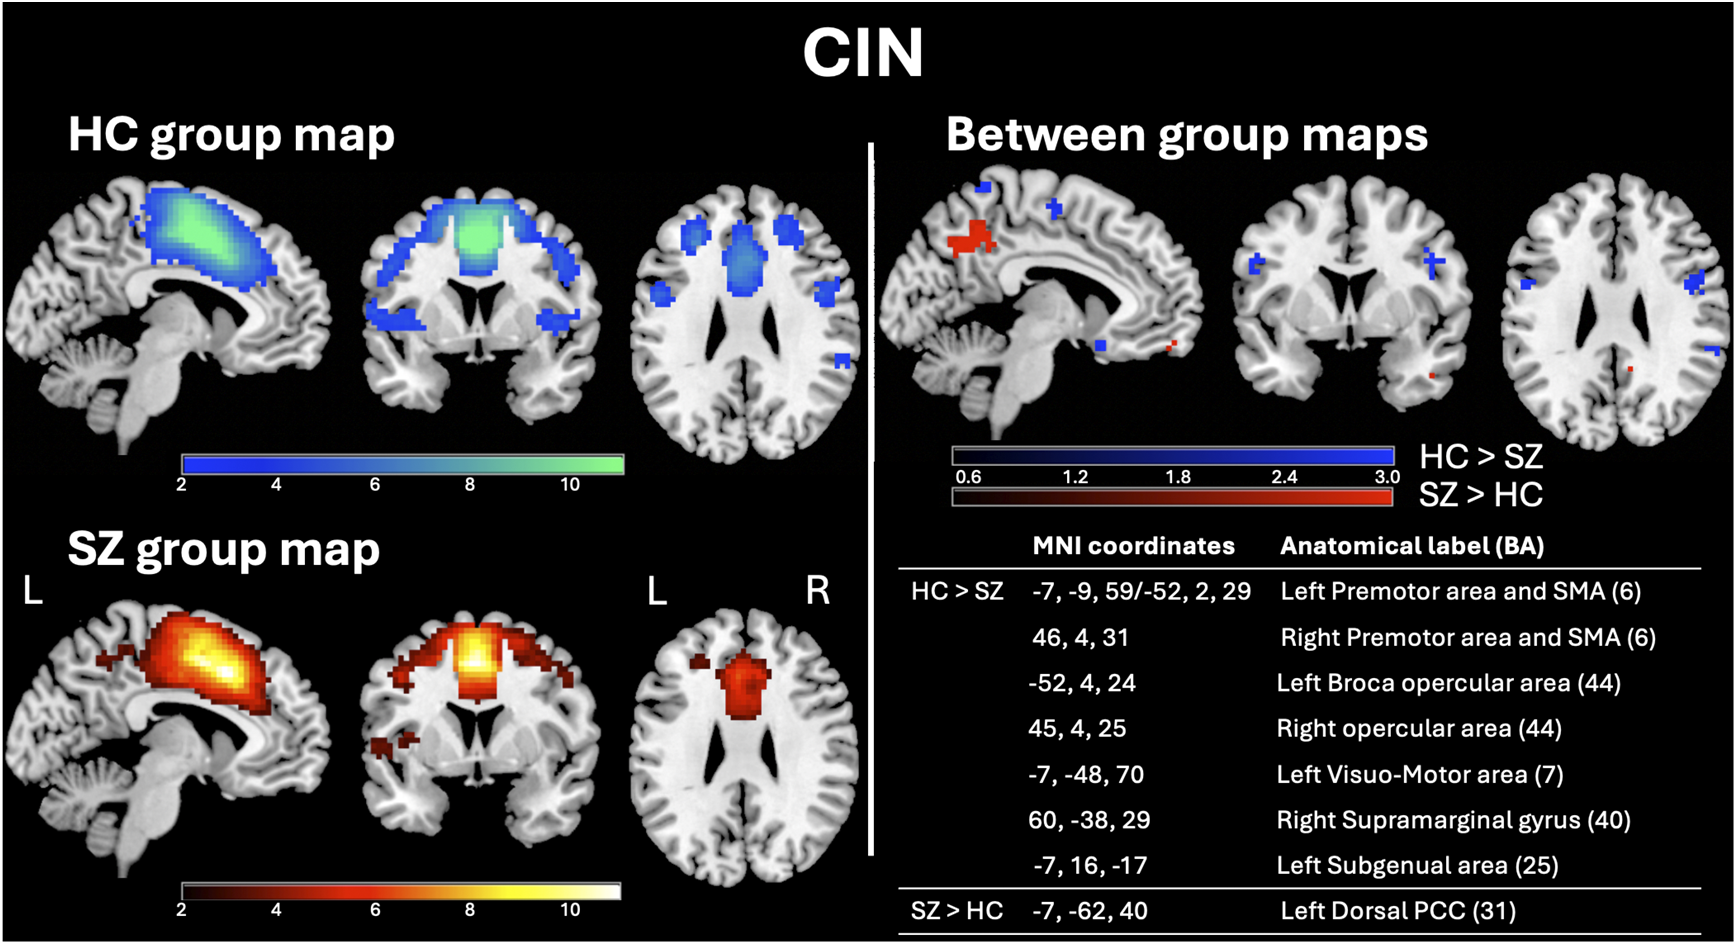
Figure 3 Long description
Figure 3 is titled "CIN" (Cingulo Insular Network) and is divided into two main panels separated by a vertical line, each displayed against a black background. Left panel - Group maps: The left panel contains two rows of three brain slices each (sagittal, coronal, and axial views; labels "L" (left) and "R" (right) are shown on the coronal slice), showing within-group activation maps of the CIN. Top row - HC group map: Activation is displayed using a blue color scale, with t-values ranging from 2 to 10 (indicated by a horizontal color bar below the images). Bottom row - SZ group map: Activation is displayed using a red color scale, with t-values ranging from 2 to 10 (indicated by a horizontal color bar below the images). Right panel - Between-group differences maps and related coordinates table: The right panel is subdivided into an upper section with brain images and a lower section with a table. Upper section - Between-group differences maps: Three brain slices (sagittal, coronal, axial) show regions where the two groups differ significantly. A color bar ranging from 0.6 to 3.0 is shown below the images, with a blue color scale indicating regions where healthy controls show greater connectivity than schizophrenia patients, and a red color scale indicating regions where schizophrenia patients show greater connectivity than healthy controls. Lower section - Coordinates table: An embedded table lists the MNI coordinates and corresponding anatomical labels (Brodmann Areas) for each significant between-group area: The CIN in SZ patients showed reduced connectivity in Left Premotor area and SMA (BA 6, MNI coordinates: -7,-9,59/-52,2,29), Right Premotor area and SMA (BA 6, MNI coordinates: 46,4,31), Left Broca opercular area (BA 44, MNI coordinates: -52,4,24), Right opercular area (BA 44, MNI coordinates: 45,4,25), Left Visuo-Motor area (BA 7, MNI coordinates: -7,-48,70), Right Supramarginal gyrus (BA 40, MNI coordinates: 60,-38,29), and Left Subgenual area (BA 25, MNI coordinates: -7,16,-17); The CIN in SZ patients showed increased connectivity in Left Dorsal PCC (BA 31, MNI coordinates: -7,-62,40).
The DAN in SZ patients showed reduced connectivity in right premotor area and SMA (BA 6) and right frontal eye fields (BA 8) and increased connectivity in right secondary visual cortex (BA 18) and left angular gyrus (BA 39) (Supplementary Figure S1), whereas the VAN in SZ patients showed reduced connectivity in right frontal eye fields (BA 8) and right inferior temporal gyrus (BA 20) (Supplementary Figure S2).
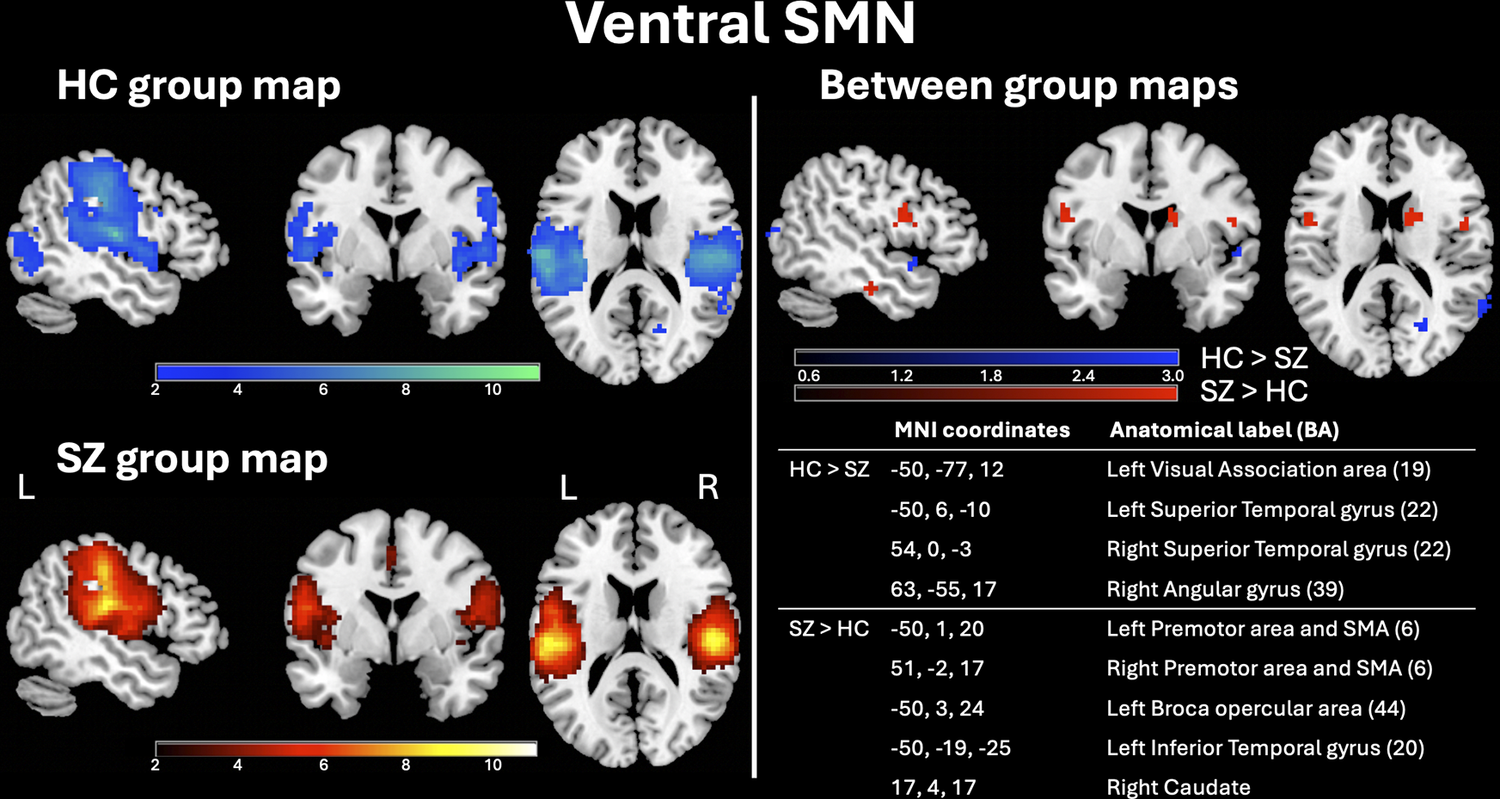
The dorsal SMN in SZ patients showed reduced connectivity in right primary somatosensory cortex (BA 1) and right Visuomotor area (BA 7) and increased connectivity in right premotor area and SMA (BA 6) and right frontal eye fields (BA 8) (Supplementary Figure S3). The ventral SMN in SZ patients showed reduced connectivity in left visual association area (BA 19), left and right superior temporal gyrus (BA 22), and right angular gyrus (BA 39) and increased connectivity in left and right premotor area and SMA (BA 6), left broca opercular area (BA 44), left inferior temporal gyrus (BA 20), and right caudate (Figure 4).
Ventral SMN group maps in HC and SZ patients and between-group statistical maps. Left panel: Random-effects group-level maps for the ventral SMN in HC (top row, blue color scale) and SZ patients (bottom row, red color scale). Right panel: Random-effects group-level t-map for the difference between HC and SZ patients (blue/red color scales depending on the group contrast). The reported q-values (<0.01) were corrected for the FDR both for the random-effects group-level t-maps of each group and for the random-effects group-level t-maps of their comparison.
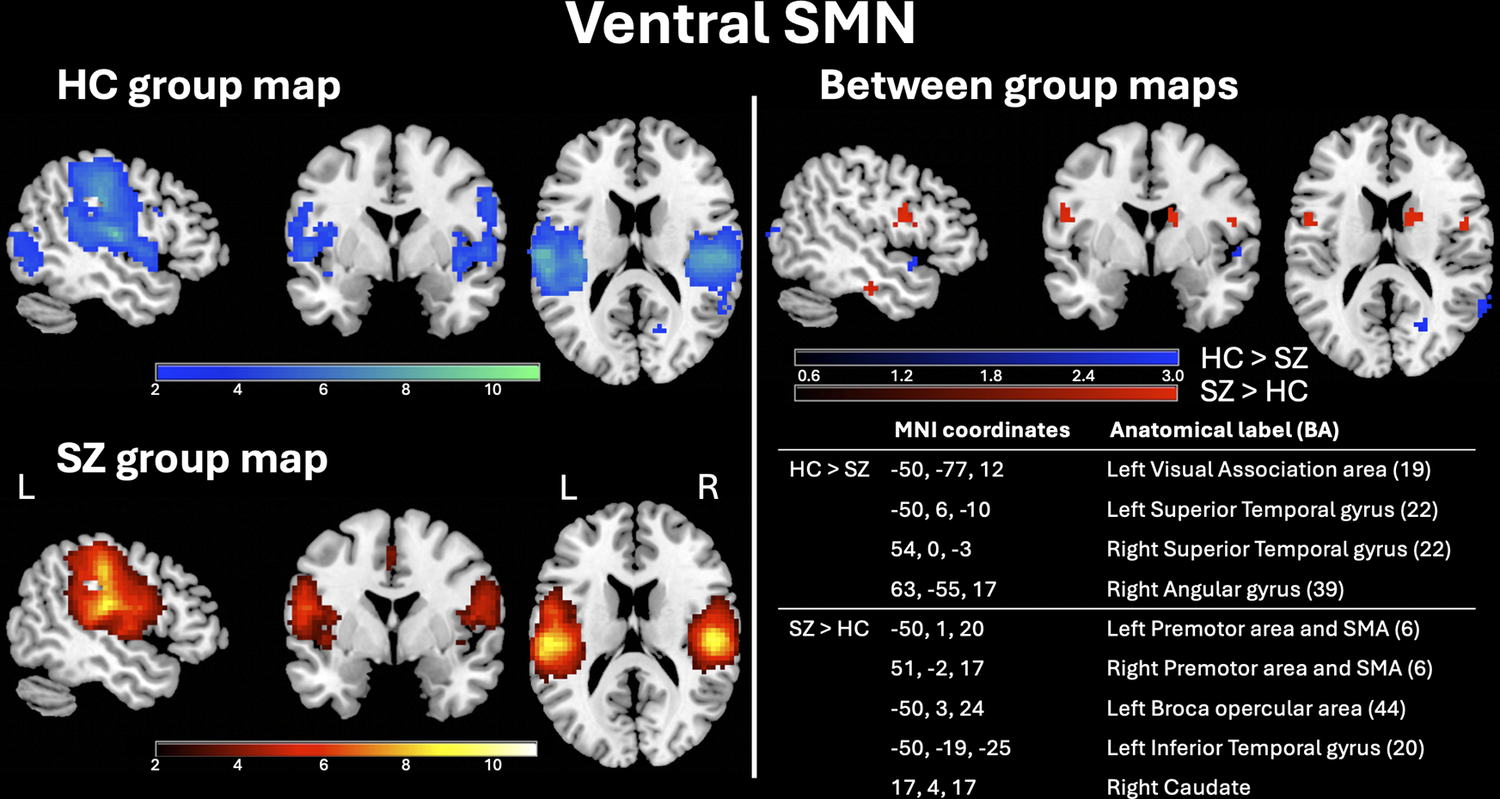
Figure 4 Long description
Figure 4 is titled "Ventral SMN" (Somatomotor Network) and is divided into two main panels separated by a vertical line, each displayed against a black background. Left panel - Group maps: The left panel contains two rows of three brain slices each (sagittal, coronal, and axial views; labels "L" (left) and "R" (right) are shown on the coronal slice), showing within-group activation maps of the Ventral SMN. Top row - HC group map: Activation is displayed using a blue color scale, with t-values ranging from 2 to 10 (indicated by a horizontal color bar below the images). Bottom row - SZ group map: Activation is displayed using a red color scale, with t-values ranging from 2 to 10 (indicated by a horizontal color bar below the images). Right panel - Between-group differences maps and related coordinates table: The right panel is subdivided into an upper section with brain images and a lower section with a table. Upper section - Between-group differences maps: Three brain slices (sagittal, coronal, axial) show regions where the two groups differ significantly. A color bar ranging from 0.6 to 3.0 is shown below the images, with a blue color scale indicating regions where healthy controls show greater connectivity than schizophrenia patients, and a red color scale indicating regions where schizophrenia patients show greater connectivity than healthy controls. Lower section - Coordinates table: An embedded table lists the MNI coordinates and corresponding anatomical labels (Brodmann Areas) for each significant between-group area: The Ventral SMN in SZ patients showed reduced connectivity in Left Visual Association area (BA 19, MNI coordinates: -50,-77,12), Left Superior Temporal gyrus (BA 22, MNI coordinates: -50,6,-10), Right superior Temporal gyrus (BA 22, MNI coordinates: 54,0,-3), and Right Angular gyrus (BA 39, MNI coordinates: 63,-55,17); The Ventral SMN in SZ patients showed increased connectivity in Left Premotor area and SMA (BA 6, MNI coordinates: -50,1,20), Right Premotor area and SMA (BA 6, MNI coordinates: 51,-2,17), Left Broca opercular area (BA 44, MNI coordinates: -50,3,24), Left Inferior Temporal gyrus (BA 20, MNI coordinates: -50,19,-25), and Right Caudate (MNI coordinates: 17,4,17).
The early AN in SZ patients showed reduced connectivity in left superior temporal gyrus (BA 22), right angular gyrus (BA 39), and right supramarginal gyrus (BA 40), and the LN in SZ patients showed reduced connectivity in right insula (BA 13) and right premotor area and SMA (BA 6) (Supplementary Figures S4 and S5, respectively).
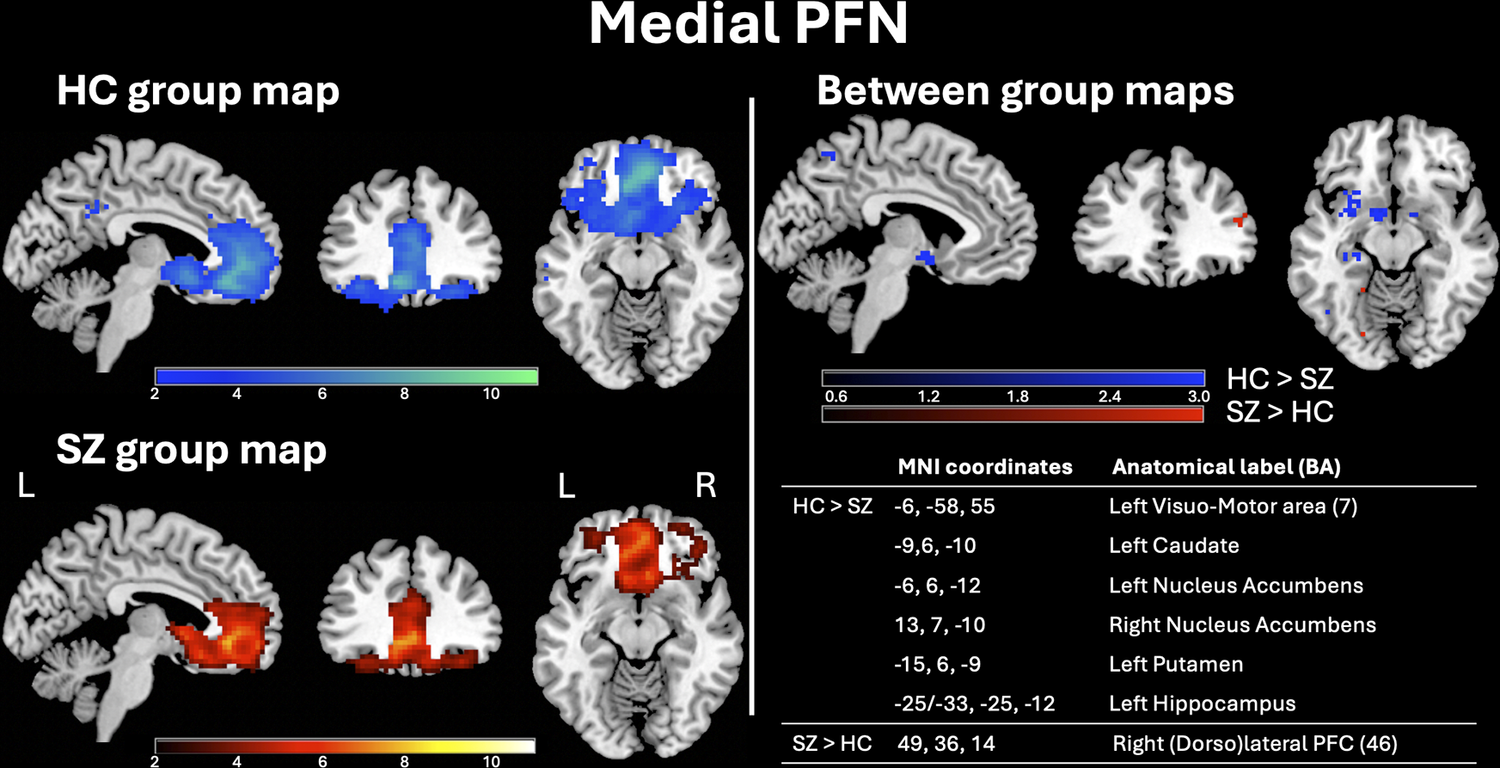
The lateral PFN in SZ patients showed increased connectivity in right ventral anterior cingulate cortex (ACC) (BA 24), left primary visual cortex (BA 17), and left anterior prefrontal cortex (PFC) (BA 10) (Supplementary Figure S6). The medial PFN in SZ patients showed reduced connectivity in left visuomotor area (BA 7), left caudate, left and right nucleus accumbens, left putamen, and left hippocampus and increased connectivity in right dorsolateral PFC (BA 46) (Figure 5).
Medial PFN group maps in HC and SZ patients and between-group statistical maps. Left panel: Random-effects group-level maps for the medial PFN in HC (top row, blue color scale) and SZ patients (bottom row, red color scale). Right panel: Random-effects group-level t-map for the difference between HC and SZ patients (blue/red color scales depending on the group contrast). The reported q-values (<0.01) were corrected for the FDR both for the random-effects group-level t-maps of each group and for the random-effects group-level t-maps of their comparison.
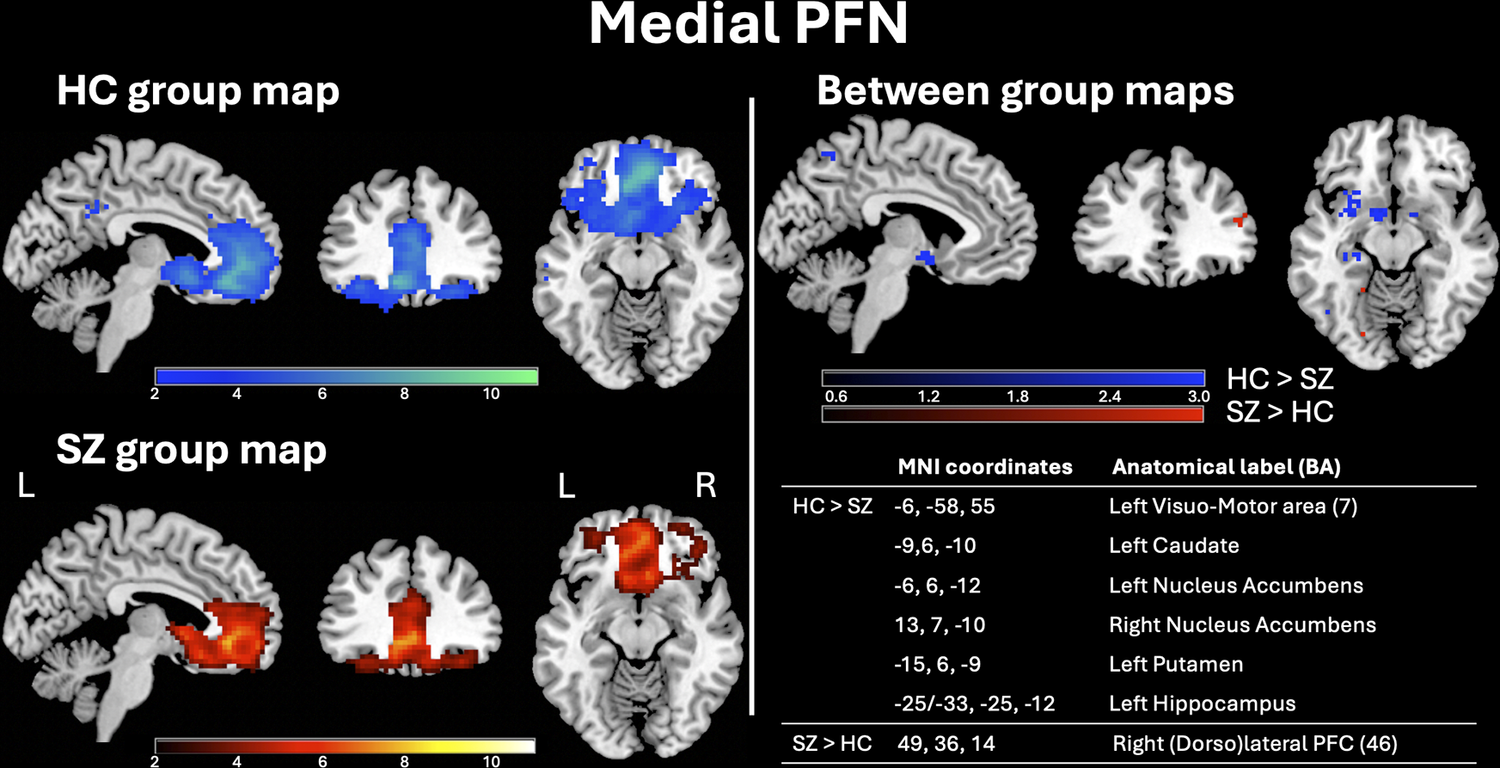
Figure 5 Long description
Figure 5 is titled "Medial PFN" (Prefrontal Network) and is divided into two main panels separated by a vertical line, each displayed against a black background. Left panel - Group maps: The left panel contains two rows of three brain slices each (sagittal, coronal, and axial views; labels "L" (left) and "R" (right) are shown on the coronal slice), showing within-group activation maps of the Medial PFN. Top row - HC group map: Activation is displayed using a blue color scale, with t-values ranging from 2 to 10 (indicated by a horizontal color bar below the images). Bottom row - SZ group map: Activation is displayed using a red color scale, with t-values ranging from 2 to 10 (indicated by a horizontal color bar below the images). Right panel - Between-group differences maps and related coordinates table: The right panel is subdivided into an upper section with brain images and a lower section with a table. Upper section - Between-group differences maps: Three brain slices (sagittal, coronal, axial) show regions where the two groups differ significantly. A color bar ranging from 0.6 to 3.0 is shown below the images, with a blue color scale indicating regions where healthy controls show greater connectivity than schizophrenia patients, and a red color scale indicating regions where schizophrenia patients show greater connectivity than healthy controls. Lower section - Coordinates table: An embedded table lists the MNI coordinates and corresponding anatomical labels (Brodmann Areas) for each significant between-group area: The Medial PFN in SZ patients showed reduced connectivity in Left Visuo-Motor area (BA 7, MNI coordinates: -6,-58,55), Left Caudate (MNI coordinates: -9,6,-10), Left Nucleus Accumbens (MNI coordinates: -6,6,-12), Right Nuclues Accumbens (MNI coordinates: 13,7,-10), Left Putamen (MNI coordinates: -15,6,-9), Left Hippocampus (MNI coordinates: -25/-33, -25,12); The Medial PFN in SZ patients showed increased connectivity in Right (Dorso)lateral PFC (BA 36, MNI coordinates: 49,36,14).
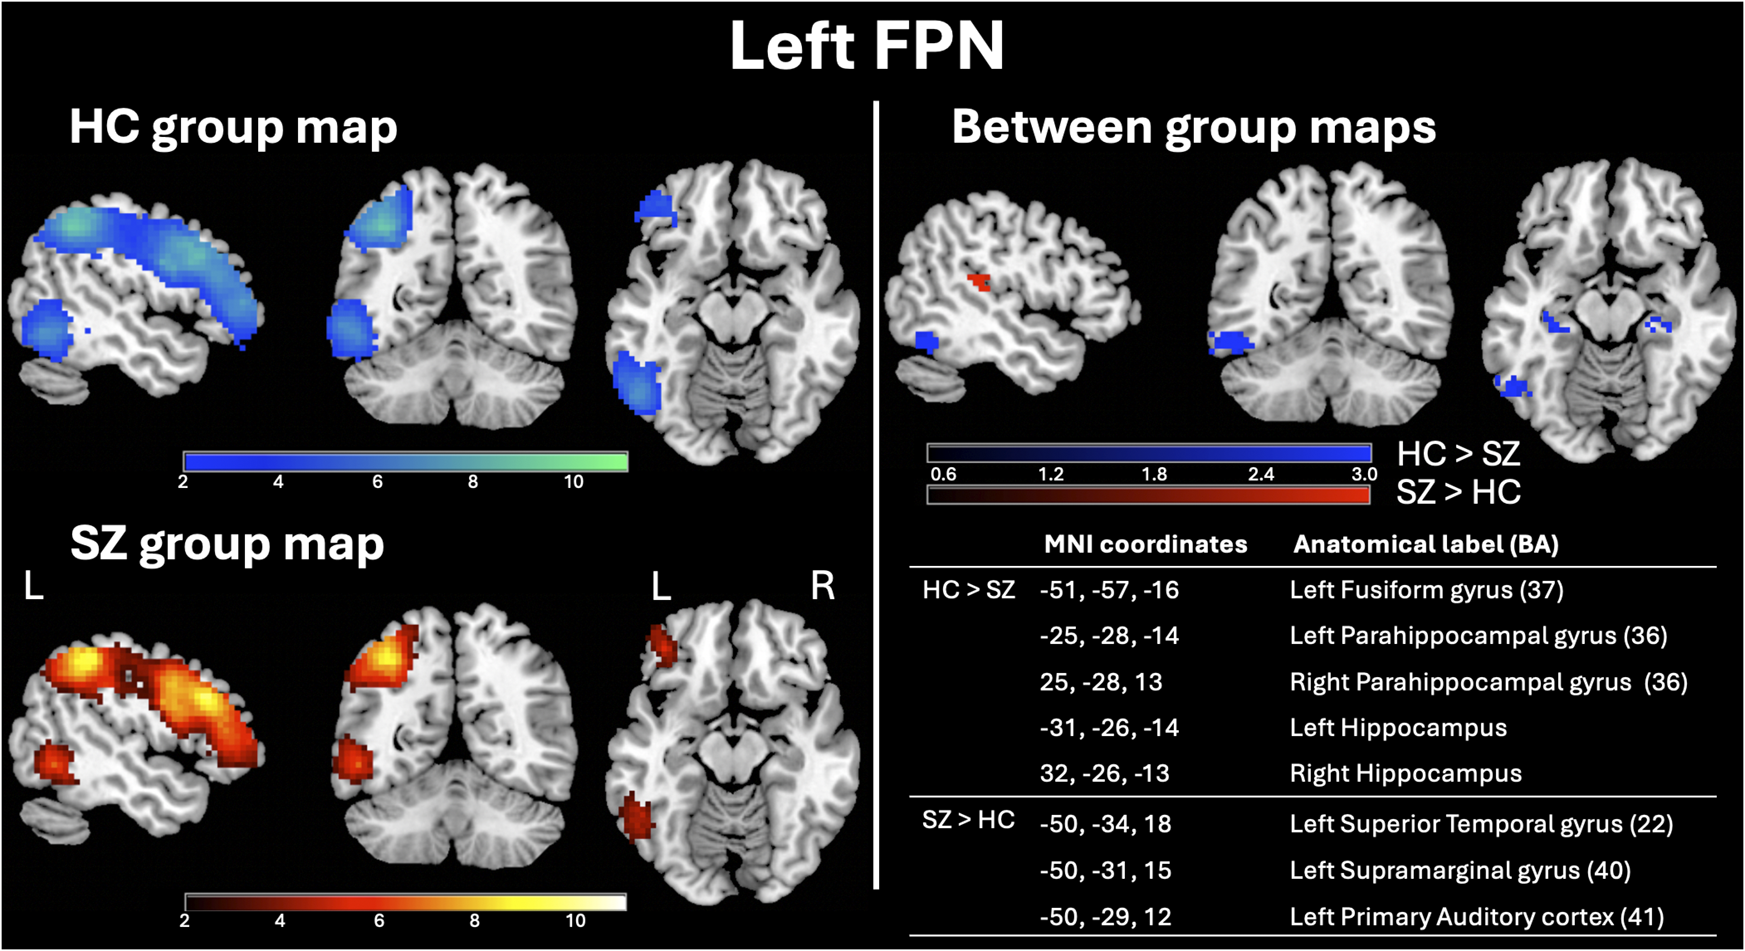
The left FPN in SZ patients showed reduced connectivity in left fusiform gyrus (BA 37), left and right parahippocampal gyrus (BA 36), and left and right hippocampus and increased connectivity in left superior temporal gyrus (BA 22), left supramarginal gyrus (BA 40), and left primary auditory cortex (BA 41) (Figure 6).
Left FPN group maps in HC and SZ patients and between-group statistical maps. Left panel: Random-effects group-level maps for the left FPN in HC (top row, blue color scale) and SZ patients (bottom row, red color scale). Right panel: Random-effects group-level t-map for the difference between HC and SZ patients (blue/red color scales depending on the group contrast). The reported q-values (<0.01) were corrected for the FDR both for the random-effects group-level t-maps of each group and for the random-effects group-level t-maps of their comparison.
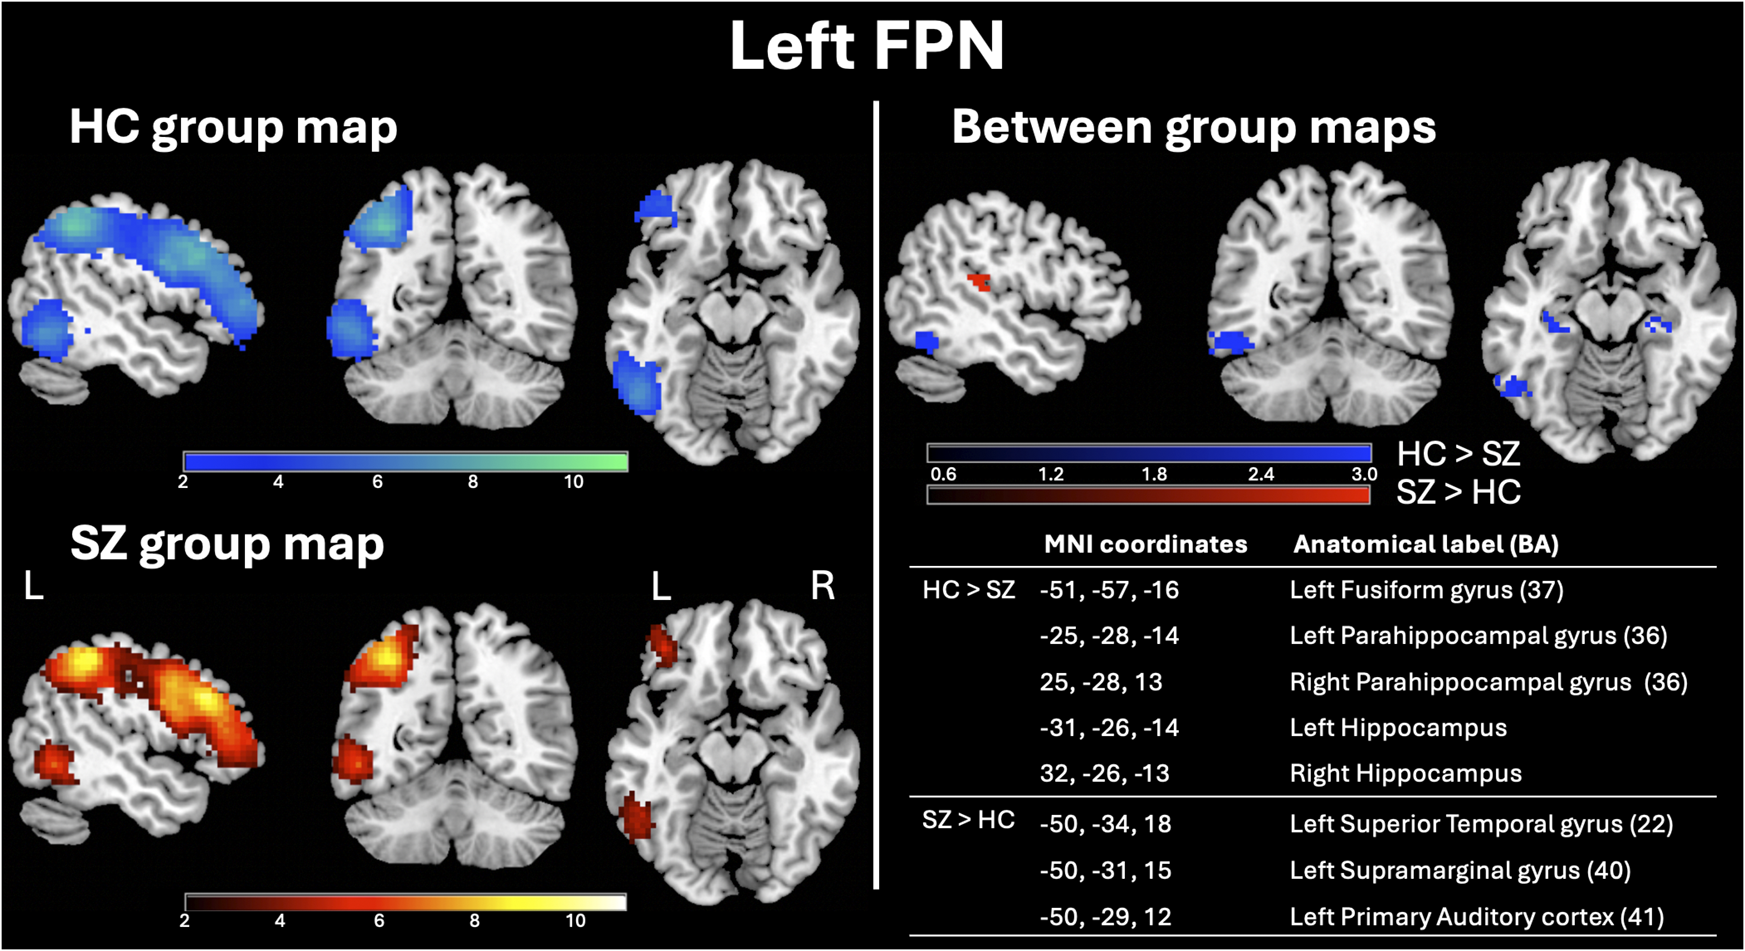
Figure 6 Long description
Figure 6 is titled "Left FPN" (Frontoparietal Network) and is divided into two main panels separated by a vertical line, each displayed against a black background. Left panel - Group maps: The left panel contains two rows of three brain slices each (sagittal, coronal, and axial views; labels "L" (left) and "R" (right) are shown on the coronal slice), showing within-group activation maps of the Left FPN. Top row - HC group map: Activation is displayed using a blue color scale, with t-values ranging from 2 to 10 (indicated by a horizontal color bar below the images). Bottom row - SZ group map: Activation is displayed using a red color scale, with t-values ranging from 2 to 10 (indicated by a horizontal color bar below the images). Right panel - Between-group differences maps and related coordinates table: The right panel is subdivided into an upper section with brain images and a lower section with a table. Upper section - Between-group differences maps: Three brain slices (sagittal, coronal, axial) show regions where the two groups differ significantly. A color bar ranging from 0.6 to 3.0 is shown below the images, with a blue color scale indicating regions where healthy controls show greater connectivity than schizophrenia patients, and a red color scale indicating regions where schizophrenia patients show greater connectivity than healthy controls. Lower section - Coordinates table: An embedded table lists the MNI coordinates and corresponding anatomical labels (Brodmann Areas) for each significant between-group area: The Left FPN in SZ patients showed reduced connectivity in Left Fusiforim gyrus (BA 37, MNI coordinates: -51,-57,-16), Left Parahippocampal gyrus (BA 36, MNI coordinates: -25,-28,-14), Right Parahippocampal gyrus (BA 36, MNI coordinates: 25,-28,13), Left Hippocampus (MNI coordinates: -31,-26,-14), and Right Hippocampus (MNI coordinates: 32,-26,-13). The Left FPN in SZ patients showed increased connectivity in Left Superior Temporal Gyrus (BA22, MNI coordinates: -50,-34,18), Left Supramarginal gyrus (BA40, MNI coordinates: -50,-31,15), and Left Primary Auditory cortex (BA41, MNI coordinates: -50,-29,12).
The right FPN in SZ patients showed reduced connectivity in right pars orbitalis (BA 47) (Supplementary Figure S7).
The parafoveal VN in SZ patients showed increased connectivity left secondary visual cortex (BA 18) and left visual association area (BA 19), whereas the peripheral VN in SZ patients showed reduced connectivity in left anterior PFC (BA 10) and right caudate and increased connectivity in left visual association area (BA 19) and left cerebellum lobule VI (Supplementary Figures S8 and S9, respectively).
Discussion
RSNs are fundamental components of the brain functional architecture, as they represent patterns of spontaneous brain activity, distinctively contributing to sensory, motor, and cognitive functions. The rs-fMRI approach is particularly useful for studying individuals with limited task compliance, such as patients with SZ, a severe psychiatric illness consistently conceptualized as a dysconnectivity disorder. Indeed, SZ is characterized by disrupted functional connectivity across a range of RSNs, including the DMN and the CIN, among others.Reference Fornito, Zalesky, Pantelis and Bullmore 43 These disruptions are often heterogeneous across individuals in both the magnitude and direction of connectivity alterations.
Despite advances in RSN research, a gap remains in the detailed spatial mapping of RSNs in SZ patients. To address this, in the present study, we employed single-subject ICA, a data-driven method that allows network extraction while preserving individual variability, to investigate spatial alterations in 14 distinct RSNs in SZ patients compared to HCs. By using single-subject ICA, it is possible to identify specific alterations that support a deeper understanding of the individual neurobiological underpinnings of this disorder. Such alterations could correlate with distinct symptom dimensions, such as positive or negative symptoms, cognitive deficits, or treatment response,Reference Whitfield-Gabrieli and Ford 44 potentially revealing a more relevant relationship between connectivity patterns and clinical symptoms. By uncovering unique connectivity patterns, clinicians may be better equipped to relate specific RSN dysfunctions to a patient’s symptomatology and disease progression. Importantly, single-subject ICA is highly sensitive to subtle differences in brain network connectivity, and this sensitivity could be crucial for monitoring the clinical course of SZ, where symptoms may fluctuate over time, and RSN alterations might evolve in subtle or idiosyncratic ways. In this way, biomarkers that distinguish SZ from other disorders, as well as transdiagnostic markers, could be uncovered.
Our findings demonstrate widespread alterations in regions primarily involved in visual, motor, and cognitive processes, in SZ patients compared to HCs. Specifically, we observed altered connectivity patterns in several visual areas, including the primary and secondary visual cortices, frontal eye fields, visual association areas, and fusiform gyrus. These regions exhibited either lower connectivity or, in most cases, higher connectivity—not only within the two primary visual RSNs (ie the parafoveal and peripheral VSs) but also within networks where these areas are not typically considered critical or even accounted for in theory-driven approaches (eg seed-based analysis).Reference Lee, Smyser and Shimony 45 Notably, we found that visual areas were altered within the DAN, VAN, dorsal SMN, lateral PFN, lFPN, and DMN. Interestingly, all the alterations we observed within the DMN were located in visual areas. An impaired intrinsic functional connectivity in the visual system has increasingly been identified in SZ,Reference van de Ven, Rotarska Jagiela, Oertel-Knöchel and Linden 46 , Reference Silverstein 47 leading to the hypothesis that this disruption might be a potential mechanism underlying the visual abnormalities occurring in this disorder, such as blurred vision or visual hypersensitivity.Reference van Ommen, Invernizzi, Renken, Bruggeman, Cornelissen and van Laar 48 Alterations in visual areas have also been hypothesized to be associated with key symptoms of SZ, such as visual hallucinations and paranoia.Reference Seymour, Stein, Sanders, Guggenmos, Theophil and Sterzer 49 , Reference Hamdioui and Lotfi 50 In line with this, it is plausible that the hyperconnectivity of visual areas observed across various networks may be linked to the visual hypermonitoring and hypervigilance characteristic of paranoia. Changes in visual areas could contribute to paranoia by disrupting how visual information is processed, interpreted, and integrated with other cognitive systems, such as attentional networks and the DMN.
Motor regions were also extensively altered in our SZ sample. Bilateral premotor areas, the SMA, and visuomotor areas exhibited connectivity alterations across the dorsal and ventral SMN, CIN, DAN, LN, and medial PFN. These results confirm the importance of using a data-driven approach like ICA for network extraction to avoid the a priori exclusion of regions not canonically included in RSNs, thus potentially missing critical insights into the disorder’s pathophysiology. SZ patients frequently exhibit motor deficits, including psychomotor retardation, psychomotor agitation, and dyskinetic syndrome.Reference Bernard, Goen and Maldonado 51 Previous studies have hypothesized that altered motor network connectivity might contribute to these symptoms.Reference Walther, Stegmayer, Federspiel, Bohlhalter, Wiest and Viher 52 , Reference Moura, van Rooijen and Schirmbeck 53 Our findings suggest that alterations in motor regions extend beyond proper motor networks. For instance, the left visuomotor area, bilateral premotor areas, and SMA were all hypoconnected within the CIN, an RSN specialized in multimodal integration of cognitive and affective processing,Reference Downar, Blumberger and Daskalakis 30 highlighting a possible interrelationship between psychopathological, cognitive, and motor symptoms in SZ.Reference Lieberman, Girgis and Brucato 54
Furthermore, we found several alterations in regions associated with cognitive processes such as executive functions (eg anterior and dorsolateral PFC), language (eg Broca’s opercular area and superior temporal gyrus), and reward and motivation mechanisms (eg nucleus accumbens and caudate). Additionally, lower connectivity was observed in the bilateral hippocampi and parahippocampal gyri within the left FPN, with the left hippocampus also showing hypoconnectivity within the medial PFN. This finding aligns with a substantial body of literature demonstrating hippocampal involvement in SZ pathophysiology, particularly regarding its role in memory and learning processes.Reference Tamminga, Stan and Wagner 55 , Reference Guo, Ragland and Carter 56 The hippocampus and parahippocampal gyri are integral to declarative memory impairments (especially episodic memory)Reference Rasetti, Mattay and White 57 that are frequently observed in SZ.Reference Picard, Sadaghiani, Leroy, Courvoisier, Maroy and Bottlaender 58 Our findings suggest that altered connectivity in these regions might disrupt the coordination required for integrating memory-related information, associative learning, and higher-order cognitive control.
Considering the spatial differences between SZ patients and HC within the 14 RSNs we analyzed, the CIN, the ventral SMN, the medial PFN, and the left FPN were characterized by the most extensive alterations. Within the CIN, SZ patients showed widespread altered connectivity patterns, mostly in the form of decreased connectivity. These results are meaningful in light of the hypothesis that CIN alterations might represent common neural substrates across various psychiatric disorders, including SZ, and that these alterations might determine a disruption in the mediation processes between cognition and emotion.Reference Downar, Blumberger and Daskalakis 30 Indeed, the component brain regions of the CIN play key roles in maintaining alertness to execute cognitive tasks,Reference Sadaghiani, Scheeringa, Lehongre, Morillon, Giraud and Kleinschmidt 59 sustaining intrinsic vigilance and processing high-priority information,Reference Dosenbach, Visscher and Palmer 60 and beginning and carrying out task performances,Reference Keefe, Harvey, Geyer and Gross 61 all of which are compromised in SZ patients.Reference Sasidharan, Nair, Marigowda, Lukose, John and Kutty 62 Findings from Sasidharan et al. highlighted the central role of the CIN in the cognitive impairments observed in SZ.Reference Keyvanfard, Schmid and Nasiraei-Moghaddam 63 Indeed, they found CIN lower connectivity, together with abnormal EEG and fMRI markers, in SZ patients compared to HC during the execution of a task based on error processing, brain state switching, sensory integration, and self-awareness.Reference Keyvanfard, Schmid and Nasiraei-Moghaddam 63
In our SZ sample, several regions within the SMN were also altered, particularly in the ventral subdivision, in the direction of both hypoconnectivity and hyperconnectivity. Our results are in line with recent rs-fMRI studies that found aberrant intrinsic functional connectivity of the SMN in SZ patients compared to neurotypical controls, supporting the hypothesis that disturbances in somatomotor system connectivity might be important features of the clinical profile of SZ.Reference Więcławski, Bielski, Jani, Binder and Adamczyk 64 , Reference Kebets, Holmes and Orban 65 Notably, as in the case of the CIN, recent findings suggested that dysconnectivity within the SMN might be a transdiagnostic signature of several pathologies: Kebets et al. (2019) found lower connectivity within the SMN in patients with SZ, attention-deficit/hyperactivity disorder, bipolar disorder, and schizoaffective disorder,Reference Huang, Luo and Palaniyappan 66 and Huang et al. identified hypoconnectivity within the SMN as a common marker of SZ, bipolar disorder, and major depression.Reference Sakurai, Gamo and Hikida 67 Interestingly, Huang et al. also found that the SMN dysconnectivity persisted even after clinical symptoms were effectively treated, suggesting that this pattern may serve as a stable trait marker for psychiatric disorders.Reference Sakurai, Gamo and Hikida 67
The medial PFN was characterized by widespread decreased connectivity patterns in SZ patients compared to HC. According to the framework proposed by Sakurai et al., molecular- and network-level abnormalities in the PFN are key contributors to the cognitive impairments occurring in SZ.Reference Jobson, Hase, Clarkson and Kalaria 68 In particular, it has been shown how the functional connectivity of the medial PFC is involved in various cognitive processes, including decision-making and different types of memory, like perceptual, episodic-autobiographical, and prospective-guided memory.Reference Pomarol-Clotet, Canales-Rodríguez and Salvador 69 Therefore, the lower connectivity observed within the PFN may be associated with deficits in these cognitive domains. Notably, alterations in the medial PFC have been replicated in SZ with multimodal imaging techniques,Reference Yanagi, Hosomi, Kawakubo, Tsuchiya, Ozaki and Shirakawa 70 , Reference Sharma, Kumar and Singh 71 leading to the hypothesis that this region, with its connections, might be a prominent site of abnormality in SZ.Reference Yanagi, Hosomi, Kawakubo, Tsuchiya, Ozaki and Shirakawa 70
We also found several connectivity alterations within the left FPN, consistent with previous studies.Reference Silverstein 47 , Reference Tu, Lee, Chen, Li and Su 72 , Reference Chahine, Richter, Wolter, Goya-Maldonado and Gruber 73 Considering its bilateral distribution, the FPN is primarily defined as a cognitive control network, which flexibly manages task adaptation and implementation in healthy conditions.Reference Zanto and Gazzaley 74 On the contrary, cognitive control is compromised in many forms of psychopathology: according to Marek and Dosenbach, this impairment is attributable to the atypical development of a flexible brain network like the FPN, and this may be a common feature across many disorders, including SZ, depression, and anxiety.Reference Marek and Dosenbach 75 Concerning the left FPN specifically, its functional association with language processing and verbal working memory has been highlighted,Reference Østby, Tamnes, Fjell and Walhovd 76 and the alterations in the functional connectivity within this network may contribute to cognitive deficits in SZ, as suggested by Sharma et al.Reference Silverstein 47 Therefore, given the linguistic impairments typical of SZ (eg disorganized speech, impaired verbal fluency),Reference Ehlen, Montag, Leopold and Heinz 77 the altered left FPN connectivity may contribute to this kind of symptoms by affecting functions that are crucial for language performance, like working memory and cognitive control.
It is important to underline the alterations we found within the DMN, which is the most studied RSN and whose alterations are the most documented in SZ.Reference Hu, Zong and Mann 31 While we did not find extensive differences in the spatial maps between patients and HC, we reported that all the discrepancies in connectivity between the two groups were located in visual areas, mostly showing a pattern of hyperconnectivity. This result highlights the link between visual functions and internally oriented processes, suggesting that abnormal processing of visual input may impact patients’ mental activities, such as interpersonal communication and emotional interpretation (leading to social difficulties), which are cognitive functions sustained by the DMN.Reference Peng, Zhang and Zhou 78 Notably, in our previous work, we found higher connectivity between the DMN and the VS in SZ patients compared to HC.Reference Biondi, Marino, Mantini and Spironelli 79 This result, together with the ones from other studies,Reference Sasabayashi, Takahashi and Takayanagi 80 , Reference Jafri, Pearlson, Stevens and Calhoun 81 provides further evidence in support of the early visual dysfunction hypothesis in SZ, where abnormal processing of visual input is interpreted as a marker of the tendency to psychosis or a more severe SZ syndromic profile.Reference Butler and Javitt 82 , Reference Spironelli, Romeo, Maffei and Angrilli 83
Limitations and future perspectives
Several limitations in our study should be acknowledged. First of all, despite its advantages, single-subject ICA is not without limitations. A significant drawback of this approach is the potential to overfit to noise in individual datasets. fMRI data are inherently noisy, and ICA, by relying on statistical independence, can sometimes separate noise into components that appear meaningful.Reference Calhoun, Eichele and Pearlson 84 Additionally, the algorithm performance can be affected by the quality of the preprocessing steps,Reference Smith, Jenkinson and Woolrich 85 which is particularly relevant in clinical populations like SZ, where motion artifacts and other confounds might be more pronounced. Nevertheless, although ICA can be sensitive to variance differences across individuals, the template-matching step was used to retain only those components showing high spatial cross-correlation with established RSN templates, thereby reducing the likelihood that noisy or biologically irrelevant components were included in the group analysis. In addition, this bottom-up strategy allows individual topological variations to be preserved, whereas these may be attenuated in approaches that impose stronger group-level spatial constraints. At the same time, we acknowledge that this approach does not guarantee the same level of correspondence across subjects as group ICA with dual regression, which may provide stronger subject-to-subject alignment of network maps.Reference Nickerson, Smith, Öngür and Beckmann 86
Another limitation of our study is that clinical variables were only available for the SZ group and were therefore not included as covariates in the between-group comparison model. As a result, we cannot exclude the possibility that illness duration or antipsychotic treatment contributed to part of the observed fMRI effects. Although all our patients were in the chronic phase of the disease and were receiving pharmacological treatment—thus reducing potential confounding effects related to the inclusion of first-episode or drug-free patients—we could not rule out the influence of factors such as the duration of illness and the antipsychotic treatment on the fMRI results. Future studies should explicitly model these clinical factors to clarify the extent to which the observed fMRI effects reflect disease-related mechanisms rather than variability associated with illness progression or pharmacological treatment. Finally, although the spatial maps produced by ICA can reveal functional network disruptions, future studies should address how these disruptions translate into specific clinical symptoms or cognitive impairments. More research is needed to establish clear links between individual RSN abnormalities and distinct clinical outcomes in SZ.
Conclusions
In conclusion, our findings provide compelling evidence of widespread resting-state functional connectivity alterations in SZ, not only within cognitive and affective networks, but also extending to visual and motor systems. The involvement of visual areas across multiple RSNs, particularly the DMN, underscores the importance of considering sensory processing abnormalities as core features of SZ pathophysiology. Likewise, the alterations observed in motor and cognitive control regions across different RSNs highlight the interplay between motor, cognitive, and affective symptoms. Networks such as CIN, ventral SMN, medial PFN, and left FPN emerged as particularly disrupted, supporting the notion that some connectivity abnormalities may be transdiagnostic across psychiatric disorders. These results reinforce the value of a single-subject ICA approach in uncovering subtle differences in brain network connectivity. In a clinical context, this sensitivity could be critical for monitoring the clinical course of SZ, given the temporal variability of symptoms and the subtle, potentially idiosyncratic evolution of RSN alterations, and may also help uncover biomarkers that differentiate SZ from other disorders or reveal transdiagnostic signatures. To conclude, single-subject ICA provides a powerful tool to map specific brain connectivity patterns to individual symptoms, and offers a promising framework for understanding the neurobiological underpinnings of SZ through a more individualized and nuanced analysis of RSNs.
Supplementary material
The supplementary material for this article can be found at http://doi.org/10.1017/S1092852926100959.
Data availability statement
The raw data supporting the conclusions of this article were downloaded from COINS (https://coins.trendscenter.org), a public, virtual database for research purposes.
Acknowledgments
None.
Author contribution
Conceptualization, D.M. and C.S.; methodology, M.M., M.B., D.M. and C.S.; software, M.M. and D.M.; validation, M.M., M.B., D.M. and C.S.; formal analysis, M.M., C.S.; investigation, M.M., M.B., D.M. and C.S.; resources, D.M. and C.S.; data curation, M.M. and M.B.; writing—original draft preparation, M.B.; writing—review and editing, M.M., D.M. and C.S.; supervision, D.M. and C.S.; project administration, D.M. and C.S. All authors have read and agreed to the published version of the manuscript.
Financial support
“C.A.T.C.H. IN. HE.AD. Comparing Auditory hallucinations Throughout the Continuum: Hearing voices from INdividuals with psychosis to HEalthy ADults. The contribute of language lateralization, anxiety and personality traits”—P2022E5H38-CUP C53D23009070001 funded by the European Union-NextGenerationEU-PNRR M4.C2.1.1. PRIN PNRR DD 1409 (14/09/2022).
Disclosures
The authors declare no conflicts of interest.
AI software use
The authors declare no use of AI software to prepare the manuscript.


 Open access

