

INTRODUCTION
Agroforestry is often viewed as a type of land use that provides ES, environmental benefits and economic commodities as part of a multifunctional working landscape (Jose, Reference Jose2009). Through their multiple benefits, agroforestry systems can provide in certain contexts the right conditions for climate-smart agriculture as they combine improved livelihoods and food security with climate change adaptation and climate change mitigation benefits (Scherr et al., Reference Scherr, Shames and Friedman2012).
Although coffee (both Arabica, Coffea arabica, and Robusta, C. canephora) and cocoa (Theobroma cacao) have been reported to be responsible for high deforestation rates in the world, they are crops that can grow well in agroforestry systems (Beer et al., Reference Beer, Muschler, Somarriba and Kass1998; Gavaux et al., Reference Gavaux, Linkie, Suyadi and Leader-Williams2009; Ruf, Reference Ruf, Angelsen and Kaimowitz2001). Therefore, in a context of increasing demographic and land pressure, cocoa and coffee farms can be seen as key entry-points for integrating a diversity of trees (Vaast and Somarriba, Reference Vaast and Somarriba2014). These trees can enhance the subsistence and income of smallholder farmers (Coe et al., Reference Coe, Sinclair and Barrios2014). In recent decades, the coffee and cocoa sectors have recommended cultivating these crops in open sun. Under optimal crop management and ecological conditions, yields are highest when crops are grown in full sun monoculture. However, optimal crop management is rarely met in smallholders’ contexts. In such contexts, shade systems provide more opportunities for smallholder farmers (Duguma et al., Reference Duguma, Gockowski and Bakala2001); they can improve nutrient cycling, increase the quality and the lifespan of crops grown underneath, but they also provide opportunities to increase and/or diversify income, improve food security and deliver fuel wood and timber as well as non-timber products (Herzog, Reference Herzog1994). The direct benefits for the livelihood of the smallholders, not necessarily related to coffee or cocoa, determine whether or not these farmers integrate a specific shade tree in their cropping systems, as adoption of agricultural practices and technologies often depend on other benefits. Furthermore, in periods of low prices, intensively managed coffee and cocoa farms are transformed into more complex agricultural systems with shade trees recognized for their valuable role in limiting reliance on expensive agrochemical inputs and ecological risks such as drought and outbreaks of pests and diseases (Franzen and Mulder, Reference Franzen and Mulder2007; Vaast and Somarriba, Reference Vaast and Somarriba2014).
Although shade tree species can offer many benefits for the livelihood of the smallholder farmers, there are many trade-offs. Some tree species can be highly competitive for water or nutrients and/or provide too dense shade leading to a decrease in coffee or cocoa yields. Furthermore, it is well known that certain shade tree species can suppress certain pests and diseases while others can increase their incidence and severity (Beer et al., Reference Beer, Muschler, Somarriba and Kass1998; Staver et al., Reference Staver, Guharay, Monterroso and Muschler2001). For example, in Uganda, many NGOs and other coffee stakeholders promoted Albizia chinensis as a good shade tree in Robusta coffee (C. canephora). Now, preliminary studies show an increase in the incidence and severity of the black twig-borer, Xylosandrus compactus in Robusta grown under Albizia. Because of those trade-offs, there is a high demand from farmers, NGOs, eco-labels and the industry for knowledge regarding which shade tree species to promote for coffee and cocoa agroforestry systems (Hughes, Reference Hughes2009; Kagezi et al., Reference Kagezi, Kucel, Egonyu, Kyamanywa, Karungi, Pinard, Jaramillo, van Asten, Wagoire, Chesang and Ngabirano2014; Marie Vivien et al., Reference Marie-Vivien, Garcia, Kushalappa and Vaast2014). As for any other agricultural system, there is no ‘one silver bullet’ practice that will increase productivity, improve farmers’ livelihood and sustain the environment (Coe et al., Reference Coe, Sinclair and Barrios2014). Although single-tree nurseries are the easiest to establish, it is clear that a diversity of shade trees should be promoted instead of one shade tree species (Schroth and Harvey, Reference Schroth and Harvey2007). This should be done not only for biodiversity conservation but also for optimizing the needs and objectives of rural households in concordance with the broader objectives of other stakeholders in the coffee and cocoa sectors going from private sector, to governmental and to eco-certification bodies (Groot et al., Reference Groot, Oomen and Rossing2012).
As trees take a long time to grow, generating knowledge on agroforestry via experimental trials is time and budget demanding. This explains why there are only few long-term agroforestry trials in the world, particularly with perennial crops such as coffee and cocoa (Haggar et al., Reference Haggar, Barrios, Bolaños, Merlo, Moraga, Munguia, Ponce, Romero, Soto, Staver and de MF Virginio2011; Vaast and Somarriba, Reference Vaast and Somarriba2014). An alternative and more rapid way to document interactions between crops and trees in agroforestry systems is to rely principally on local knowledge gained over generations of farmers’ experience in their own environment as a source of valuable information on the services and disservices provided by trees (Sinclair and Joshi, Reference Sinclair, Joshi and Lawrence2001). Clearly, this local knowledge needs to be complemented by scientific knowledge in order to ensure that sound recommendations are given on tree species.
The purpose of this paper is to present an agroforestry decision-support tool at plot level based on local knowledge, developed for selecting shade trees. The selected tree species have to be beneficially associated with the crops to which they provide shade. They also have to be well adapted to local conditions and smallholder farmers’ needs while maximizing ES. This tool is targeted towards extension services and stakeholders involved in sustainable agroforestry and innovation for adaptation to climate change.
TOOL DEVELOPMENT
The goal was to develop a decision-support tool at plot level geared towards extension officers of cooperatives and rural development projects that can be used to help smallholder farmers select tree species for their coffee/cocoa plantations and farms, based on the premise that there should be a large diversity of possible tree species combinations depending on the context of the farmer's livelihood. Therefore, this decision-support tool, based on local knowledge, was developed so that every individual farmer could receive technical advice specific to his/her needs and his/her local context.
This tool is primarily based on local agroforestry knowledge collected in the field through interviews with farmers and rankings of tree species according to services (e.g. shade quality, pest and disease suppression or soil fertility improvement) provided by the shade trees as perceived by local farmers (Sinclair and Joshi, Reference Sinclair, Joshi and Lawrence2001). Tree species ranking by farmers is an interesting approach to document local knowledge more precisely as it generates an efficient way to differentiate target tree species based on scores (Walker et al., Reference Walker, Thorne, Sinclair, Thapa, Wood and Subba1999). Collected data are analysed statistically and ranked in a systematic way as briefly explained below and in more details by Heinze (Reference Heinze2013), and Smith-Dumont et al. (in press).
Acquiring data
Prior to using the tool, if tree species rankings are not already available, data should be collected in the following manner:
1. Select the region of implementation (for example: country, province, watershed, altitude or rainfall zone).
2. Identify issues and prioritize ES that are relevant to the farmer's livelihood context. This can encompass a broad range of ES, taking a full farmer's need approach or very specific ones, such as bee keeping for enhanced pollination of a particular crop or suppressive effects of certain specific pests and diseases depending on objectives of the development agent.
3. Select shade tree species based on inventories of local farms.
4. A specific population group can be targeted (e.g. women, youth) if it is relevant for the development agent.
5. Interview members of the target zone on tree knowledge and let them rank tree species for selected ES.
6. Review and compile scientific knowledge on selected tree species.
For the development of the tool, a target zone is defined as an ecological zone where the rainfall and temperature pattern is homogeneous. Depending on the landscape, this can vary from less than 100 km2 in mountainous areas to several 100 km2 in a more uniform and flat area. In this context, databases have already been constituted for Mount Elgon that is an Arabica region and Greater Luweero that is a Robusta region in Uganda; and for the Western region for cocoa, in Ghana. In these regions, a list of 20 to 30 most prevalent shade tree species per target zone was made based on incidence in coffee or cocoa farms after a thorough tree inventory on around 100–150 farms. This tree inventory was combined with interviews of female and male household members on their views regarding tree species influencing light, temperature, space, nutrient and water availability, pests and diseases incidence, the value of the products derived from these trees and importance in terms of revenue diversification and/or food security, as well as the provision of other ES. For the development of the tool, 10 to 12 ES were selected based on farmers’ perceived benefits of shade trees in their respective target zone and farms as illustrated in Table 1 for the Arabica coffee-producing zone in Mount Elgon, Uganda.
Ecosystem services selected according to local farmers for shade trees associated to Arabica coffee in Mount Elgon region, Uganda.

Out of the list of 20–30 most prevalent shade trees, farmers were first asked to select 10 tree species that they knew best in their target zone. This process was made easier using tree species fact sheets comprising the name in local languages with clear recognizable pictures of the tree characteristics such as the shape of canopy and trunk, colour of the bark, flowers, fruits and leaves.
Then, farmers were asked to rank those 10 tree species that they selected with respect to each of the 10–12 selected ES, while keeping in mind: ‘To my opinion, which tree species is the best provider of that specific service, which tree species is the next one in line and so on’; farmers were helped with clear pictograms of the various ES. Tied ranks were allowed when a farmer thought that two tree species were equally capable of providing a certain ES. Local knowledge about tree services is a reliable source when a large number of farmers are interviewed; the survey sample should not be smaller than 80–100 persons per zone (Walker et al., Reference Walker, Thorne, Sinclair, Thapa, Wood and Subba1999). More detailed information on the methodology, tree species and ES selected is presented for cocoa in Ghana by Meyer-Sand (Reference Meyer-Sand2014) and in Rwanda by Smith-Dumont et al. (in press).
Data analysis
The BradleyTerry2 package in R is used to analyse data (Turner and Firth, Reference Turner and Firth2012). This analysis yields a score for each of the ranked tree species, and hence an overall ordination of the species based on their ranks. The model is defined so that the probability that one species is ranked above another depends on the difference between their scores. It does not allow these scores to be interpreted as absolute scores, but rather as scores meaningful only relative to one another. Consequently, it was decided to shift the lowest score to zero, yielding only positive scores. The Bradley Terry analysis also produces a confidence interval, which can be seen as an indicator of the frequency and the homogeneity with which farmers are ranking tree species; larger confidence intervals are associated with tree species that farmers know less and hence tend to select less frequently and rank less concordantly. As the confidence intervals can vary quite significantly between trees, it was decided to plot the trees not solely based on the order of decreasing scores, but on a combination that includes both the score and the size of the confidence interval. This prevents the tool from recommending tree species with relatively large confidence intervals and hence high uncertainty associated to these particular species.
The advice is based on local farmers’ rankings of shade trees for various ES provided by the trees, but additionally, a series of criteria and conditions was set up for developing the decision-support tool:
• Advice is displayed in an easy-to-understand and user-friendly way.
• Multiple ES can be weighed and included in the advice in accordance to the local preference of the target farmer.
• A list of tree species is recommended rather than “one species fits all’.
• The tool is freely available and will be accessible online as a web app.
• The protocol for data collection and ranking analysis is readily available for extension of the tool databases with new tree species, ES, regions and crops.
The use of the tool can easily be extended to new shade tree species and/or ES as well as other regions and crops.
Validating data
After data acquisition and analysis, recommendations will be validated through peer-review. This will be done through (1) discussion groups or interviews with farmers and (2) review by experts.
Extension services, cooperatives and NGOs should use the recommended list of species as input for a discussion with farmers, and take into consideration knowledge about additional cropping systems as well as off-farm resources and revenues and other criteria (e.g. availability of local markets, food security of household, ease and cost of management, cost-benefit ratio, short-term benefits).
TOOL SETUP
The tool was developed in R and is freely available on request. Furthermore, an HTML version of the tool is in development, which will be available online as a web app.
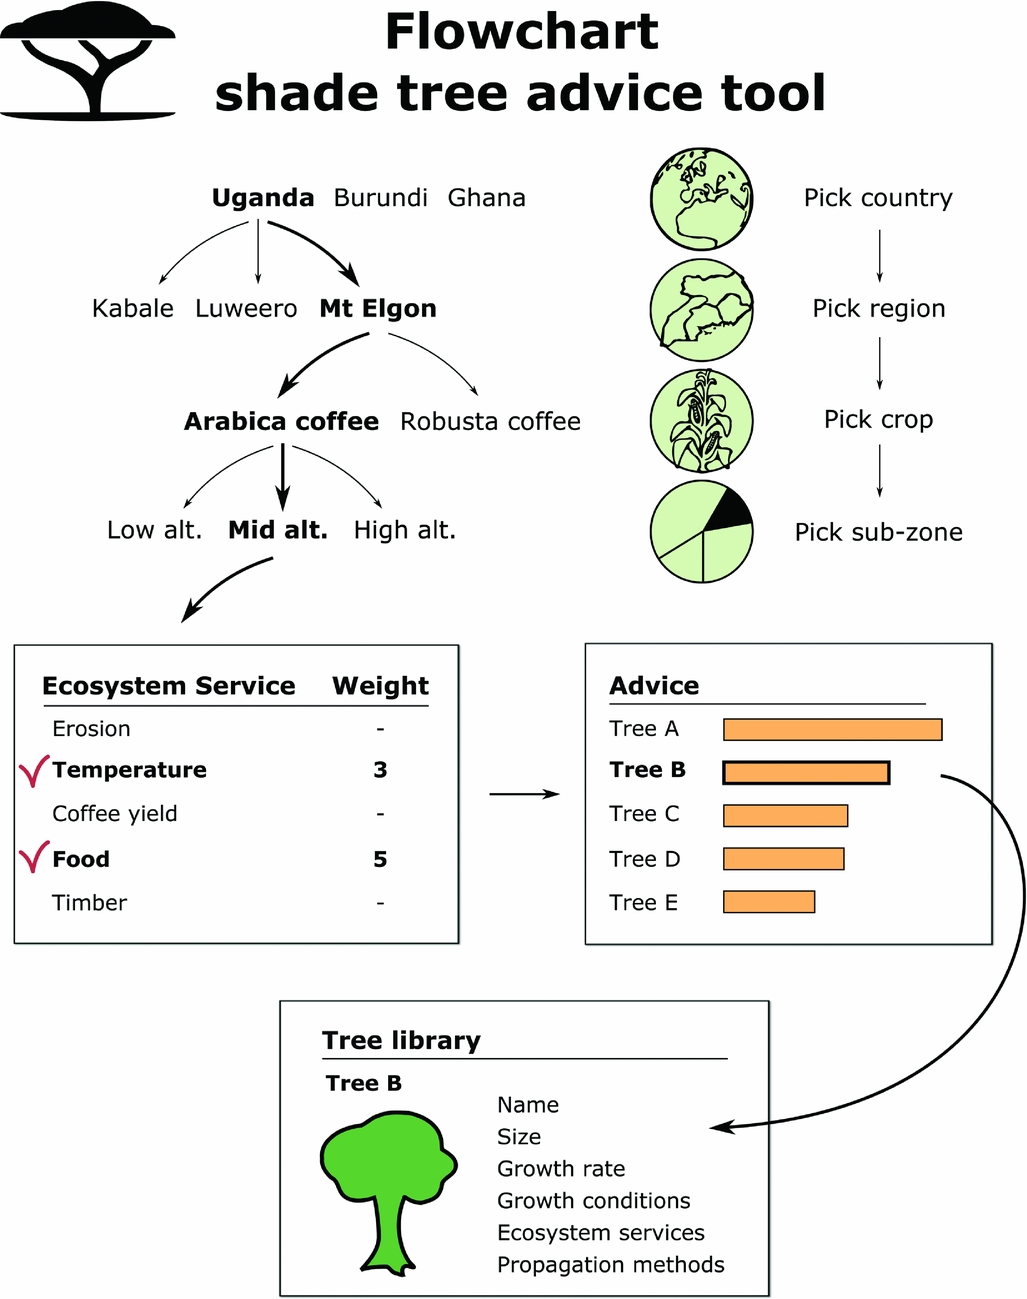
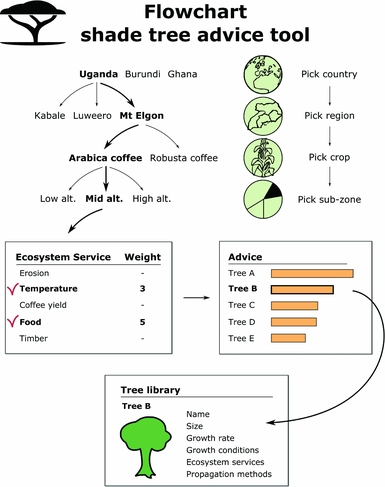
As shown in the flowchart (Figure 1), the end-users first pick the country, region and crop of interest. After that, they can choose one to several ES available and also give these ES varying weights according to the specific needs and locally perceived importance (weights range from 1: relatively unimportant to 5: very important). The tool links the recommended tree species to a tree library, associated with the tool, which links to other online databases such as the ICRAF Agroforestree library and the PROTA (4U) library, so that comprehensive information is available before a definitive choice is made.
Flowchart showing user's steps when using the tool, from selection of context to weighing ecosystem services and the tree library.
Calculating advice scores based on needs of farmers
The selected weights are used to calculate the weighted score for each ecosystem service (see Equation (1)).
 $$\begin{equation}
WS_i^t = \frac{{RS_i^t*{w_i}}}{{\sum\nolimits_i {{w_i}} }}
\end{equation}$$
$$\begin{equation}
WS_i^t = \frac{{RS_i^t*{w_i}}}{{\sum\nolimits_i {{w_i}} }}
\end{equation}$$
Here, WSti is the weighted score, extracted from the ranking scores RSti coming from the Bradley Terry analysis for each tree species t and ecosystem service i, by weighing them with weights wi. These WSti are then summed for the different ES (see Equation (2)).
 $$\begin{equation}
A{S^t} = \sum\limits_i {WS_i^t}
\end{equation}$$
$$\begin{equation}
A{S^t} = \sum\limits_i {WS_i^t}
\end{equation}$$
Here, ASt is the advice score, for each tree species t. The result is plotted as a stacked bar graph, where the advice score per tree is broken down into the weighted scores WSti. The confidence interval is calculated only for the final advice score, as shown in Equation (3).
 $$\begin{equation}
A{\sigma ^t} = \sqrt {\sum\limits_i {{{\left( {\frac{{R\sigma _i^{t*}{w_i}}}{{\sum\nolimits_i {{w_i}} }}} \right)}^2}} }
\end{equation}$$
$$\begin{equation}
A{\sigma ^t} = \sqrt {\sum\limits_i {{{\left( {\frac{{R\sigma _i^{t*}{w_i}}}{{\sum\nolimits_i {{w_i}} }}} \right)}^2}} }
\end{equation}$$
Here, Aσt is the 68% confidence interval for the advice score, and Rσti is the quasi standard error for each of the ranking scores RSti for each tree species t and ecosystem service i.
Decision criteria
Once the ranking scores are calculated, a series of decision criteria/thresholds still needs to be applied in order to select the group of shade tree species that can be recommended. Two criteria were developed to guide end-users’ decisions in selecting a group of tree species from the ranking displayed on the graph. The first criterion is the minimum number of tree species recommended. By default, this minimum number has been set to four species. The second criterion limits the maximum number of tree species recommended by setting a lower boundary for the scores. By default, this boundary value has been set at 75% of the score given to the top (one) species in the context of interest. Only trees that have their confidence intervals above this boundary value are recommended to the farmer.
Clearly, a high diversity of shade trees in agro-forestry systems will do better for the provision of ES at many scales (Schroth and Harvey, Reference Schroth and Harvey2007; Vaast and Somarriba, Reference Vaast and Somarriba2014). Diversity of shade trees can be quite large in contexts where natural regeneration of shade trees is easily achievable or where forest is being thinned down or cleared for agriculture. In such areas, a variety of shade trees can be picked from the existing biodiversity. In areas where this is not possible and where nurseries need to be set-up to grow particular shade trees, practically, it is only possible to promote a limited number of tree species. In order to accommodate for these different contexts, both criteria described above (determining the number of recommended trees) can be easily adjusted in the tool by the end-user. Although this tool gives recommendations for shade trees for a particular crop growing on a particular plot, ideally, this is embedded in a broader sustainable agricultural planning process where conditions at farm, community, landscape and market levels are taken into consideration. Despite the fact this is still a challenge in most cocoa- and coffee-producing countries in Africa, final recommendations by agricultural services should rely on the recommended list of species, but also need to adapt this list to a wider context than the perennial crop systems of interest by using additional criteria and knowledge about the other cropping systems on the farm, off farm resources and the landscape context.
MAIN FEATURES OF THE DECISION TOOL
Single ecosystem service
It is possible for the end-user to select just one particular ES for a specific zone as shown in Figure 2 below for soil erosion control in Arabica coffee, at high altitude in the Mount Elgon region.
Ranking of shade tree species (scientific and local names) for Arabica coffee, at high altitude in the Mount Elgon region of Uganda, scores computed with the Bradley Terry analysis for soil erosion control.
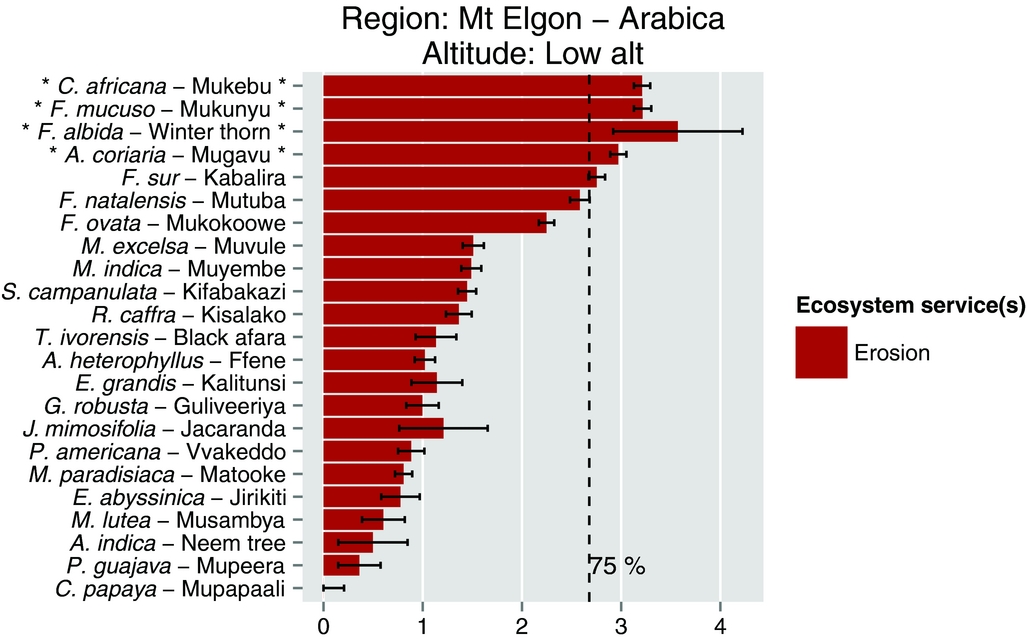
As the scores are not absolute scores but rather relative to each other, they were shifted to start at zero for the lowest ranked tree species, presently Carica papaya in Figure 2. As explained above, the tree species are plotted, based on a combination that includes both the score and the size of the confidence interval. In this particular example, Cordia africana and Ficus mucosa are actually plotted above Faidherbia albida despite its higher score. The larger confidence interval implies higher uncertainty associated to this later species with respect to its beneficial effect on soil erosion.
As set up by default, the ‘Top 4’ recommended species, namely C. africana, F. mucosa, F. albida and Albizia coriaria are highlighted with a star ‘*’. Ficus sur, the fifth ranked species, is not part of the recommended species as the dotted line indicating the 75% threshold is located in front of the lower end (left) of its confidence interval. Clearly, the end user could decrease this limit down to 70% or lower to allow the inclusion of F. sur and possibly F. natalensis in the recommended list as well.
One of the features that will be included in the web app is an interactive link to the tree library through a click on the tree species name which will provide access to information on the main tree characteristics such as tree description with photographs, growth rate, propagation methods, optimal ecological zone and so on. This tree library is built after compiling information on the tree species from various sources available in the literature such as the Agroforestree database of ICRAF and the PROTA library, and a thorough check for consistency of information.
Multiple ecosystem services with uniform or differential weights
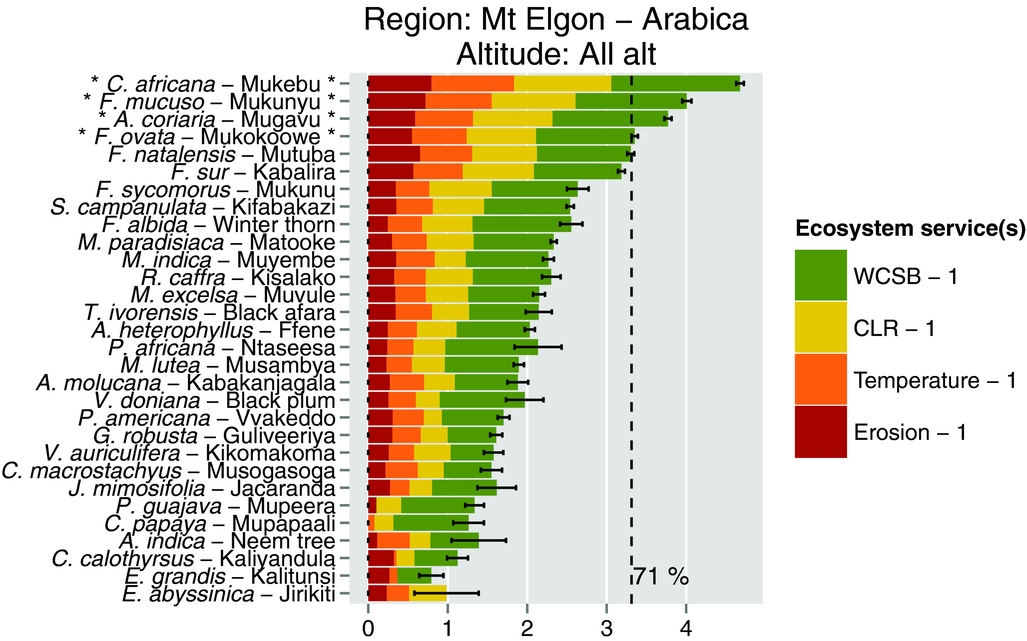
It is possible for the end-user to select a limited group of ES to address priority needs of farmers in a particular zone as shown in Figures 3 and 4. Furthermore, it is also possible for the end-user to vary the weights given to each of these services to tailor the tree species recommendation to the specific context of any individual farmer.
Scores and recommendations of shade tree species for Arabica coffee, at all altitudes combined in Mount Elgon region, Uganda, taking into account four services weighted equally with suppressive effects on white coffee stem borer (WCSB) and coffee leaf rust (CLR), reducing air temperature (Temperature) or decreasing soil erosion (Erosion); weights are displayed in the legend.
Scores and recommendations of shade tree species for Arabica coffee, at all altitudes combined in Mount Elgon region, Uganda, taking into account four services but higher weights placed on suppression of white coffee stem borer (WCSB) and coffee leaf rust (CLR) than on reducing air temperature (Temperature) or decreasing soil erosion (Erosion); weights are displayed in the legend.
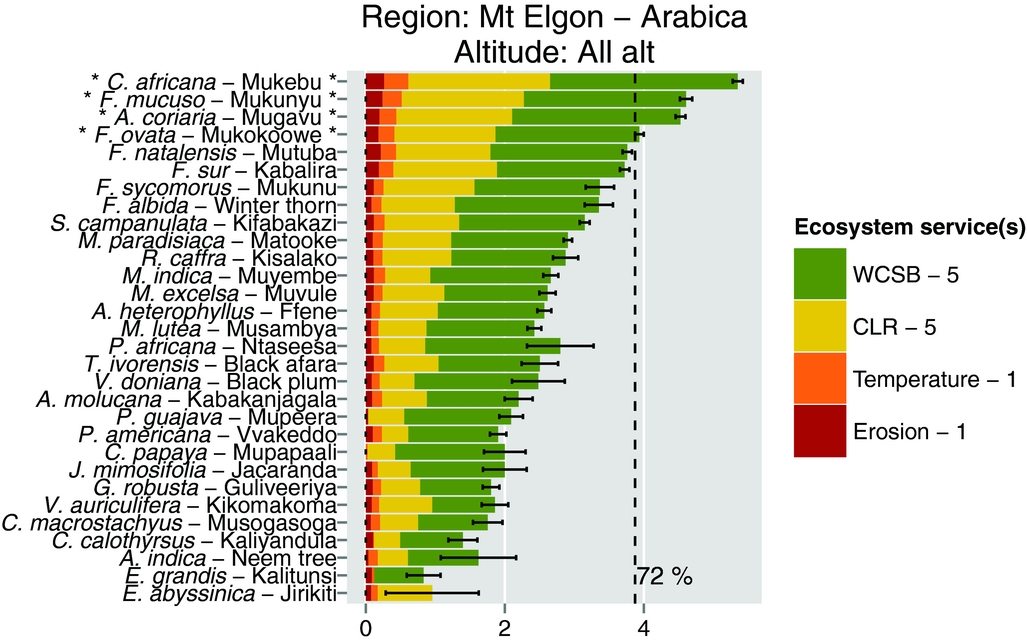
From these advising scenarios (Figures 3 and 4), it can be seen that increasing the ‘weight’ from 1 to 5 for some ES, in order to emphasize them, did not result in marked differences in the ranking of the tree species; C. africana, F. mucosa, A. coriara and F. ovata are still the top four recommended species in Figure 4 as they were in Figure 3.
Farmers’ weights
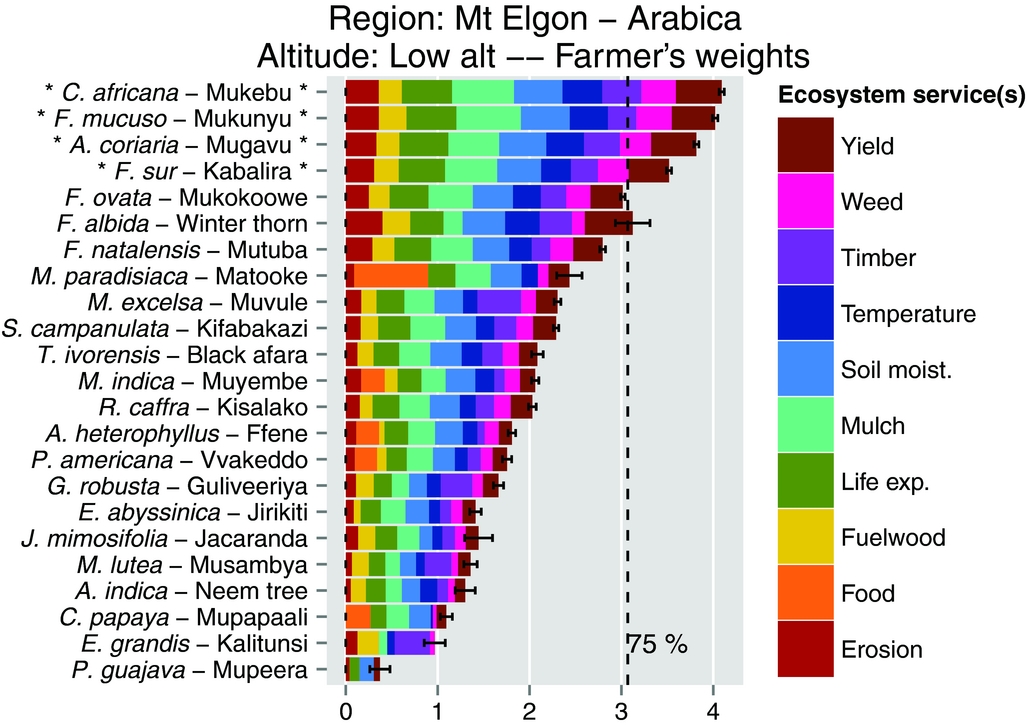
During interviews, farmers were also asked to rank the different ES according to their locally perceived importance. These rankings, whenever available, can also be used in the tool to display an overall ranking of the different shade trees with respect to all the ES combined and weighed according to farmers’ preferences in the target zone (Figure 5).
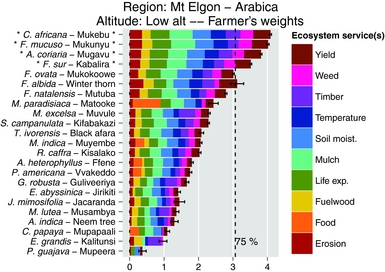
Scores and recommendations of shade tree species for Arabica coffee, at low altitude in Mount Elgon region, taking into account all the services weighed according to farmers’ preferences.
Scenario examples
To illustrate its flexibility and high capacity in proposing options for highly specific needs, we run this tool pretending that it is geared towards particular (fictional) farmers located on the altitudinal gradient of Mount Elgon, Uganda.
Farmer 1 (female household head) and Farmer 2 (male household head) are located at low altitude while Farmer 3 (male household head) is located at high altitude; coffee of farmer 1 suffers from high temperatures, and while she wants additional timber, her focus is on intensifying coffee production. Her neighbour, Farmer 2, has the same issues, namely maintaining a high coffee yield combined with a high interest in timber, but farmer 2 is not too preoccupied by the effect of temperature on his coffee. Located on steep slopes at higher altitude, Farm 3 is subject to soil erosion and is located far from local markets, making it harder for the household to access food.
Based on these farmers’ needs and priorities, various weights were attributed to the selected ES as shown in Table 2, and the decision-support tool recommended which shade tree species to promote in the respective coffee farms.
Ecosystem services and weights selected by three fictional farmers to fit their needs.

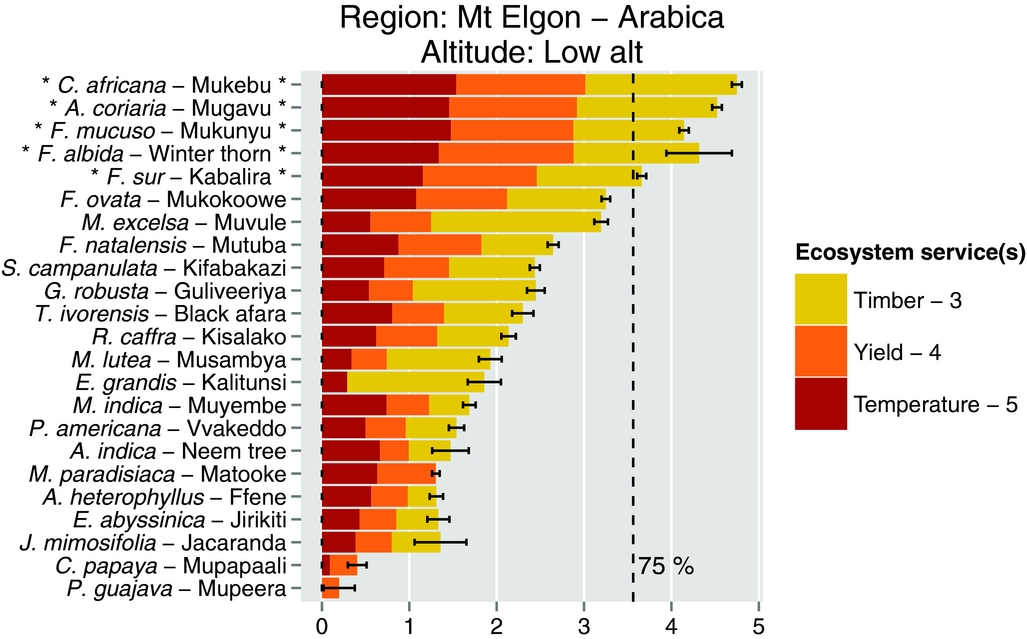
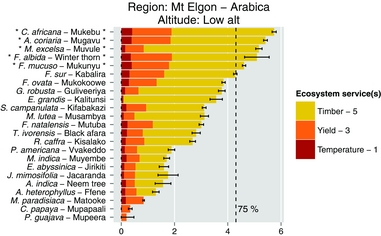
For Farm 1, as shown in Figure 6, the recommended top tree species are C. africana, A. coriaria, F. mucosa, F. albida and F. sur, with all species rated high by farmers for their capacity to produce high-quality timber and provide a favourable micro-climate for coffee productivity.
Recommended tree species selection for Farm 1 based on the farmer's needs and priorities, namely high capacity to buffer air temperature (most important with weight of 5), maintenance of high yield of coffee (weight of 4) and timber production (weight of 3).
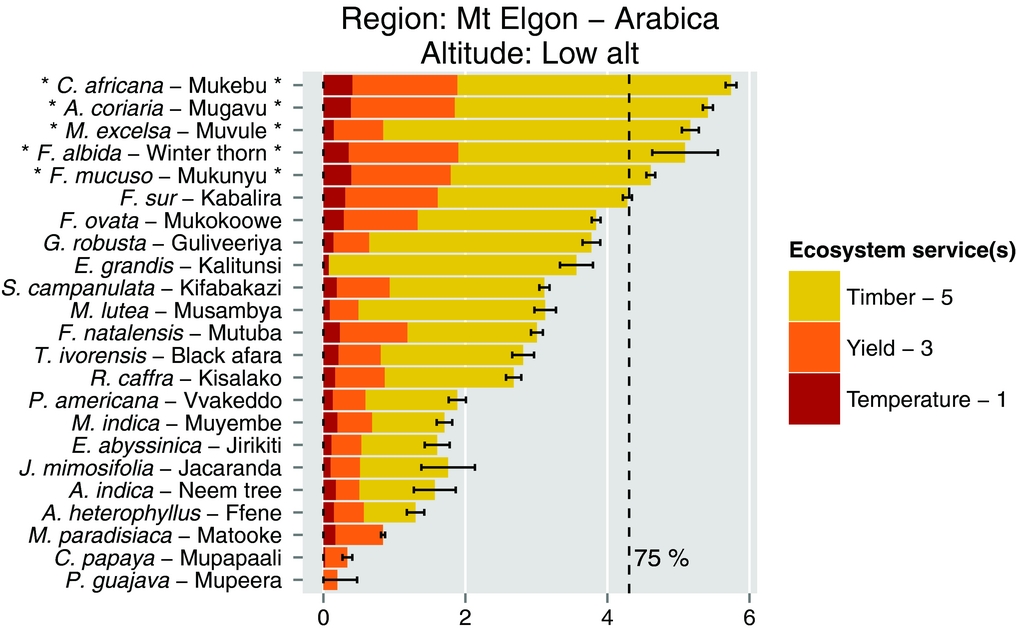
For Farm 2, as shown in Figure 7, the recommended list of tree species is somewhat similar to the one of Farm 1. However, Metrosideros excelsa was not included in the recommended list of Farmer 1 and is now in third position due the strong focus of Farmer 2 on timber production and hence higher weight assigned to this ES. Farmer 2 can start planting this tree species as well as the other recommended ones, but should be cautious as Figure 7 indicates that this particular tree species, although excellent for timber production, does not score well on temperature regulation or enhancing coffee yield. Consequently, Farmer 2 should preferentially plant this tree species on the boundaries of his coffee plantation. Besides recommendations on which shade trees provide ES adapted to the needs of the farmer, care needs to be taken on which agro-forestry configuration needs to be adopted. Although not a primary feature of the tool, this will be added in future tool development.
Recommended tree species selection for Farm 2, based on the farmer's needs and priorities, namely timber production (most important with weight of 5), maintenance of high yielding coffee (weight of 3) and capacity to buffer air temperature (weight of 1).
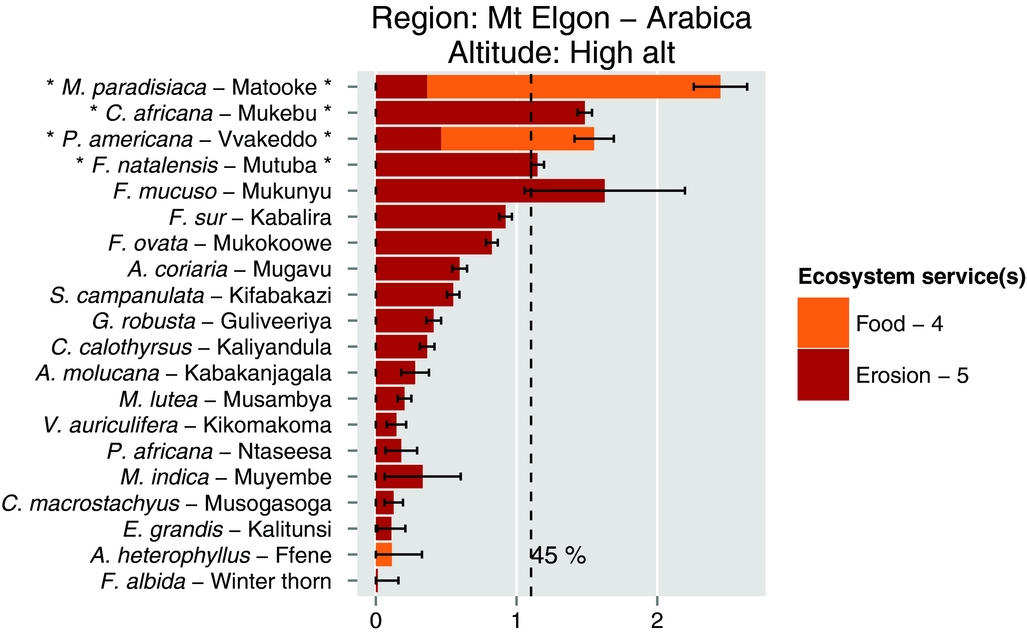
For Farm 3, as shown in Figure 8, the recommended list is quite different from those of the two previous low-altitude farms. The dotted line is plotted at 45%, indicating a more constrained selection of the top four tree species. Although Musa paradisiaca is at the top of the list, Farmer 3 already grows banana in association with his coffee, and is looking for fruit trees that can improve the household diet and even more so for tree species recognized for their beneficial impact against soil erosion. Therefore, this farmer is advised to plant C. africana and F. natalensis as well as avocado (Persea americana). Farmer 3 should also be advised to even incorporate some fruit tree species such as jackfruit (Actocarpus heterophyllus) that are far down the list and not necessarily good for erosion but will help fulfil the household dietary needs.
Recommended tree species selection for Farm 3, based on the farmer's needs and priorities, namely soil erosion reduction (weight of 5) and food production (weight of 4).
CONCLUDING REMARKS
Originally developed on coffee and cocoa systems of Uganda (Bukomeko, Reference Bukomeko2015) and Ghana (Meyer-Sand, Reference Meyer-Sand2014), the use of this decision-support tool can readily be extended to other coffee and cocoa producing regions as similar data collection and tree ranking exercises have already been undertaken in Rwanda (Smith-Dumont et al., in press), Kenya (Lamond et al., Reference Lamond, Sandbrook, Gassner and Sinclair2019), Cote d'Ivoire (Smith-Dumont et al., Reference Smith-Dumont, Gnahoua, Ohouo and Vaast2014), India (Mahfuz, Reference Mahfuz2008; Sharma, Reference Sharma2008), Costa Rica (Cerdan et al., Reference Cerdan, Rebolledo, Soto-Pinto, Rapidel and Sinclair2012) and Guatemala (Martin, Reference Martin2007).
As this tool is essentially based on local agroforestry knowledge via farmers’ interviews and rankings of tree species with respect to locally perceived key ES, it is important to keep in mind that farmers, within a rural community or region, could have collectively biased or partial views about the services or disservices associated to particular tree species. For example, and as documented in Rwanda, farmers’ knowledge about newly introduced tree species originates mostly from extension services, with personal experiences often limited to trees in their juvenile phase and to short-term interactions between coffee and these tree species (Smith-Dumont et al., in press). Therefore, local knowledge needs to be complemented by scientific knowledge, at least through the consultation of the tree library associated to the tool, in order to ensure that appropriate tree species are recommended. In this library, information on tree density and spatial arrangement, and management requirements will be provided so that the most complete species-specific agricultural recommendations possible can be given to farmers. The tool is set up in such a way that data and recommendations will be peer reviewed before release.
A second caution with respect to tree species recommendations has to do with causal correlation between ES. As some ES can be strongly correlated (e.g. air temperature regulation and soil moisture conservation), tree species will be ranked similarly for both ES and the tool will overemphasize their importance in the selection process. When a farmer selects two correlated ES along with a third unrelated one, the tool will yield an advice favouring the correlated ES over the uncorrelated one. A parameter (Wolf-τ, unpublished research) could be added to the tool in order to inform users on these possible interactions.
A third caution is that this decision-support tool should not be used blindly; ideally, the recommended list of tree species should not be the option to be passed onto farmers without any additional analysis of the farm and household features within the local socio-economical context. Extension services, cooperatives and NGOs should use the recommended list of species as input for a discussion with farmers, and take into consideration knowledge about additional cropping systems as well as off-farm resources and revenues and other criteria (e.g. availability of local markets, food security of household, ease and cost of management, cost-benefit ratio, short-term benefits).
This tool will be freely accessible on the websites of IITA and ICRAF. Research institutions, NGOs and extension services of cooperatives and governmental institutions are encouraged to add information and databases, widening its current geographical and crop scopes. Indeed, new zones, regions or countries can be added to the open-access library, under the condition that collection of local agroforestry knowledge, farmers’ rankings of tree species and subsequent data analysis strictly follow the recommended protocols as proposed in literature (Cerdan et al., Reference Cerdan, Rebolledo, Soto-Pinto, Rapidel and Sinclair2012; Coe, Reference Coe, Bellon and Reeves2002; Sinclair and Joshi, Reference Sinclair, Joshi and Lawrence2001; Smith-Dumont et al., in press; Soto-Pinto et al. Reference Soto-Pinto, Villalvazo-López, Jiménez-Ferrer, Ramírez-Marcial, Montoya and Sinclair2007). Clearly, other cropping systems could also be added, under the same conditions. In order to insure quality control of the data used by the tool, it is envisaged that IITA will have a supervising role over the tool, organizing a peer-review of new datasets before uploading them for public use.
Acknowledgements
This research was conducted under the CGIAR Research Program on Climate Change, Agriculture and Food Security (CCAFS). We acknowledge Ashiraf Mawanda, Hannington Bukomeko for their help in the analysis and development of the tool and Richard Asare, Willem-Albert Toose and Sander Muilerman for advice on interpretation. We thank Dr Richard Coe (ICRAF) for his advices on Bradley Terry ranking analysis in R, Federal Ministry for Economic Cooperation and Development of Germany (BMZ) and the forests, trees and agroforestry (FTA) program from the CGIAR for financial support; Dr John Beer (CATIE) and Emilie Smith-Dumont (ICRAF) for their valuable review of the manuscript; Franco Magnet, Wilberforce Wodada and the team of Agro-Eco for data acquisition; Theresa Liebig for advice on pests and diseases.


 Open access