


1. INTRODUCTION
Studying glacier surface processes at fine scales in space and over time involves direct field monitoring but enables understanding of the interactions between glaciers and their environment (Vaughan and others, Reference Vaughan and Stocker2013). A small number of glaciers are permanently monitored in different climate regions worldwide, allowing the quantification of their mass balance using glaciological, hydrological, or geodetic methods and, in some cases, of their surface energy balance (usually at point scale using weather stations). Regarding the mass balance, the World Glacier Monitoring Service (WGMS, 2013; Zemp and others, Reference Zemp2015) lists data available on 440 glaciers monitored worldwide through field measurements, which include uninterrupted series covering more than 40 a for only 37 glaciers. The 440 monitored glaciers represent only 0.25% of the nearly 200 000 glaciers inventoried worldwide and included in the Randolph Glacier Inventory and GLIMS databases (Pfeffer and others, Reference Pfeffer2014 and www.glims.org). The small number of available datasets is due to the financial and human investment, and the time required for field measurements.
Although few in number, field studies on the monitored glaciers have made it possible to highlight the key climate variables controlling the glacier mass-balance processes and the links with regional or global patterns of atmospheric circulation (e.g. Vincent, Reference Vincent2002; Vincent and others, Reference Vincent2004; Huss and Bauder, Reference Huss and Bauder2009; Thibert and others, Reference Thibert, Eckert and Vincent2013; Rabatel and others, Reference Rabatel2013a). They have also helped to better characterize the variables and processes that affect ice dynamics including ice thickness, flow velocities at the surface and thermal diffusion (e.g. Berthier and Vincent, Reference Berthier and Vincent2012; Gilbert and others, Reference Gilbert, Vincent, Wagnon, Thibert and Rabatel2012). Long-term monitoring of mass balance is indispensable to improve our knowledge of the processes and clear up the remaining questions on many points, such as the role of wind and topography in snow accumulation at the glacier surface (e.g. Sold and others, Reference Sold2013), the role of turbulent fluxes in snow and ice ablation (e.g. Litt and others, Reference Litt, Sicart, Helgason and Wagnon2015), the impact of aerosols and black carbon on albedo (e.g. Ginot and others, Reference Ginot2014), or the role of water in basal sliding (e.g. Helmstetter and others, Reference Helmstetter, Nicolas, Comon and Gay2015). Similarly, these measurements are needed for the calibration and validation of models (e.g. Gabbi and others, Reference Gabbi, Carenzo, Pellicciotti, Bauder and Funk2014; Réveillet and others, Reference Réveillet, Rabatel, Gillet-Chaulet and Soruco2015).
Unfortunately, the small number of available series limits our understanding of the relationship between climate and glacier changes at regional scales, as well as our understanding of the contribution of glaciers to water resources (e.g. Cauvy-Fraunié and others, Reference Cauvy-Fraunié2013; Soruco and others, Reference Soruco2015) and to the biodiversity of high-altitude watersheds (e.g. Carlson and others, Reference Carlson2014).
As a consequence, a different monitoring approach is needed to quantify glacier-wide mass balance and regional scale changes, in addition to field measurements. Remote sensing has proven to be a very useful tool for this purpose. The increase in the number of satellite sensors over nearly four decades, as well as their improved performance, i.e. their improved spatial, radiometric and temporal resolutions, has made remote sensing indispensable for the monitoring of glaciers, and many methods have been developed since the 1970s (e.g. Rees, Reference Rees2006). Computing glacier decadal volume variations at the regional scale from the differences in digital elevation data computed from satellite observations has become quite common (e.g. Berthier and others, Reference Berthier, Arnaud, Vincent and Rémy2006, Reference Berthier2014; Gardelle and others, Reference Gardelle, Berthier, Arnaud and Kääb2013; Gardner and others, Reference Gardner2013), but retrieving glacier-wide mass balance is more challenging. However, it is a key issue, highlighted by the international strategy for glacier monitoring defined by the Global Terrestrial Network for Glaciers (GTN-G, gtn-g.org). Two methods have recently emerged: one based on the measurement of the end-of-summer snow line as a proxy of the equilibrium-line altitude (ELA) (Rabatel and others, Reference Rabatel, Dedieu and Vincent2005, Reference Rabatel2012a, hereafter referred to as the SLA method), the other based on the minimum average albedo of the glacier surface (Dumont and others, Reference Dumont2012; Brun and others, Reference Brun2015).
Here, we use data from previous studies conducted in the French Alps (Rabatel and others, Reference Rabatel, Dedieu and Vincent2005, Reference Rabatel, Letréguilly, Dedieu and Eckert2013b), to reconstruct ELA time series for 30 glaciers over the 1983–2014 period, using the end-of-summer snow line detected on satellite images. The aims of this study were to (1) apply the SLA method on 30 French alpine glaciers over a 31 a period, (2) test the accuracy of the SLA method applied to a long period by comparing our results with the few available field glacier-wide mass-balance series, and (3) characterize changes in the end-of-summer SLA and glacier-wide mass balance in the French Alps over the last three decades compared with changes in other regions in the European Alps.
2. STUDY AREA
A recent update of the glacier inventory of the French Alps listed 593 glaciers (Rabatel and others, Reference Rabatel, Dedieu, Letréguilly and Six2012b; Gardent and others, Reference Gardent, Rabatel, Dedieu and Deline2014). The total glacial coverage in the French Alps was ~340 km2 in the mid-1980s and had decreased to ~275 km2 by the late 2000s. In the present study, we used 30 glaciers located in the French Alps (Table 1, Fig. 1) selected using the following criteria: (1) glaciers had to have a high enough maximum elevation to allow observation of the snow line every year during the study period; (2) all aspects of the glaciers had to be represented; and (3) glaciers located in all the glacierized mountain ranges in the French Alps from the southernmost (44°50′N) to the northernmost (46°00′N) had to be included.
The 30 glaciers (in red) whose annual mass-balance time series were reconstructed among the 593 glaciers in the French alpine glacier inventory (in blue). Glaciers on the Italian and Swiss sides of the Franco-Italian and Franco-Swiss borders are in dark gray (adapted from Gardent and others, Reference Gardent, Rabatel, Dedieu and Deline2014).

List of the glaciers studied. Numbers refer to Fig. 1; glaciers are ordered from North to South to facilitate their identification on the map

Mean MB = mean glacier-wide mass balance (in m w.e. a−1) for the period 1983–2014; the overall uncertainty in the mean MB was estimated to ±0.3 m w.e. Surface refers to the beginning of the period (i.e. 1985/86), and the surface loss was computed over the entire study period.
Three of the glaciers selected belong to the GLACIOCLIM observatory, which runs a permanent mass-balance monitoring program: Glacier de Saint-Sorlin, monitored since 1957 (# 19 in Table 1 and Fig. 1), Glacier d'Argentière, monitored since 1975 (# 2 in Table 1 and Fig. 1), and Glacier de Gébroulaz monitored since 1983 (# 16 in Table 1 and Fig. 1). Available data on the glacier-wide mass balance and topography of these three glaciers were used to assess the representativeness of the glacier-wide mass balance computed from the satellite images. It should be noted that the glacier-wide mass balances of these three glaciers were computed using the glaciological method and adjusted with the geodetic method (e.g. Vincent, Reference Vincent2002; Vincent and others, Reference Vincent, Soruco, Six and Le Meur2009). It should also be noted that the DEMs used to compute the geodetic balance in the case of GLACIOCLIM are not the ones used in the current study. Indeed, the DEMs used for GLACIOCLIM glaciers come from photogrammetric restitutions of aerial photographs only taken on GLACIOCLIM glaciers.
3. METHODS AND DATA
3.1. Reconstructing the glacier-wide mass balance from optical remote-sensing data
For temperate (outer tropical) glaciers, the end-of-summer (dry season) snow line is an accurate proxy of the equilibrium line (Lliboutry, Reference Lliboutry1965; Braithwaite, Reference Braithwaite1984; Rabatel and others, Reference Rabatel, Dedieu and Vincent2005, Reference Rabatel, Dedieu, Thibert, Letréguilly and Vincent2008, Reference Rabatel2012a). Moreover, the snow line is easy to discern on optical remote-sensing images. After geometrical and radiometric corrections of the remote-sensing images, the altitude of the end-of-summer snow line (hereafter referred to as SLA) was calculated for each year of the study period (written SLA i , in m) using DEMs. The glacier-wide mass-balance series can then be reconstructed in two steps. First, for each year, we calculated the difference between SLA i and ELA eq , where ELA eq is the theoretical altitude of the equilibrium line if the glacier had a balanced budget (glacier-wide mass balance = 0) for the study period. ELA eq is computed as:
 $$ELA_{eq} = \displaystyle{1 \over n}\sum\limits_1^n {\left( {SLA_i} \right) + \displaystyle{{\overline B} \over {\partial b/\partial z}}}, $$
where $\overline B $
is the mean glacier-wide mass balance over the study period (in m w.e. a−1) quantified by the different DEMs (see below), and ∂b / ∂z is the mass-balance gradient in the vicinity of the ELA, fixed at 0.78 m w.e. 100 m−1 for the Alps according to Rabatel and others (Reference Rabatel, Dedieu and Vincent2005). Rabatel and others (Reference Rabatel, Dedieu and Vincent2005) demonstrated that even if ∂b / ∂z for a specific glacier differs slightly from this value, using an average value on a regional scale does not depreciate the results.
$\overline B $
is the mean glacier-wide mass balance over the study period (in m w.e. a−1) quantified by the different DEMs (see below), and ∂b / ∂z is the mass-balance gradient in the vicinity of the ELA, fixed at 0.78 m w.e. 100 m−1 for the Alps according to Rabatel and others (Reference Rabatel, Dedieu and Vincent2005). Rabatel and others (Reference Rabatel, Dedieu and Vincent2005) demonstrated that even if ∂b / ∂z for a specific glacier differs slightly from this value, using an average value on a regional scale does not depreciate the results.
The glacier-wide mass balance, B a, computed for each year, of the study period can then be expressed as:
 $$B_{\rm a} = (ELA_{eq} - SLA_i) \times \displaystyle{{\partial b} \over {\partial z}}.$$
To apply the method, the following are needed:
-
- Two DEMs covering the entire region of interest (RoI); one at (or close to) the beginning of the study period, one at (or close to) the end.
-
- One satellite image for each glacier under study and for each year of the study period. In temperate latitudes, the image must have been acquired at the end of the summer season, and in the outer tropics, during the dry season.
-
- The value of the mass-balance gradient in the vicinity of the ELA.
It is worth mentioning that our method assumes that the glacier-wide mass balance is similar to the surface mass balance obtained in the vicinity of the ELA eq . This assumption is reasonable because the mass balances obtain with our method are normalized by the glacier-wide mass balance of the entire study period, using satellite DEM differencing.
3.2. Satellite images and DEMs
A total of 131 images were used to cover the 30 glaciers for the 31-a study period (see Appendix). The images were acquired by the following sensors: Landsat 4TM, 5TM, 7ETM+, 8OLI, SPOT 1–5 and ASTER, with spatial resolutions ranging from 2.5 to 30 m.
Snow can fall during the ablation season, potentially more frequently at the ELA during late summer. However, these snowfalls are easy to identify when looking at the terrain surrounding the glacier and the image is consequently not used. Several images were available between August and September in most years (specifically in the last 15 a, thanks to the increasing number of sensors), making it possible to check changes in the snow line on the different images. As a consequence, we are confident that, as a proxy, the SLA is representative of the ELA of the glaciers where it could not be compared with the ELA retrieved from in-situ monitoring (i.e. Argentière, Saint-Sorlin and Gébroulaz glaciers).
In total 85% of the images were recorded between late August and early October, i.e. close to the end of the hydrological year, which is 30 September in the Alps. Concerning SLA measurements, 13% of the SLA were measured on images acquired before 15 August (the earliest image was taken on 30 July). This was particularly true in the first part of the period, before the mid-1990s, when fewer images were available. In those cases, the SLA values we used may be lower than if they had been measured later in the ablation season. It is possible to roughly estimate the increase in the SLA between the date the image was acquired and the end of the ablation season using a degree-day approach. However, this kind of approach also implies uncertainty related to the model parameters (degree-day factors, temperature gradient and threshold), which need to be calibrated using field measurements, and these are not necessarily available. In addition, snow falls frequently at the elevation of the SLA in the late summer season, which significantly affects the ablation rates and which would also need to be taken into account. Finally, one advantage of the method is that it can be used for glaciers for which no glaciological or meteorological data are available. For these reasons, we preferred to use the SLA data available from the image with no adjustment, and to evaluate the performance of the method even if, in a few cases, the images did not strictly match the end of the ablation season.
Three DEMs were used in this study. The first one is a photogrammetric DEM from the French National Geographic Institute (Institut Géographique National, French acronym IGN) with a horizontal resolution of 25 m. This DEM, named ‘1979’, covers the entire RoI and was extracted from aerial photographs taken close to the year 1979. In practice, photographs were not available for the whole area in 1979, so the IGN used photographs taken between 1975 and 1985, meaning the date of the aerial photos used differs from one massif to the other. Aerial photos of the Massif du Mont-Blanc were taken in 1979 (Berthier and others, Reference Berthier, Arnaud, Vincent and Rémy2006; Berthier and Vincent, Reference Berthier and Vincent2012) but for the other massifs, this information is no longer available. The comparison of the glacier surface elevation on the DEM with available topographical measurements of Glacier d'Argentière in 1979 (on the same profiles presented in Fig. 2 but with fewer points than in recent years, i.e. 25 points in total, reason why the 1979 data are not plotted) showed an average difference of 1.3 m (4 m in absolute values), confirming the date of the aerial photos used. For Glacier de Saint-Sorlin, in the Massif des Grandes Rousses, the difference reached 14 m (both the raw difference and the difference in absolute values) and the glacier surface elevation on the DEM was systematically lower than the one identified from the topographical measurements. Because glaciers in the French Alps were thickening at this period (Vincent and others, Reference Vincent, Vallon, Reynaud and Le Meur2000, Reference Vincent, Soruco, Six and Le Meur2009), it is most likely that aerial photographs from a previous aerial survey (possibly the one made in 1975) were used in this area. The topographic measurements made on Glacier de Saint-Sorlin between 1975 and 1980 showed a thickening of 10–15 m of all the profiles surveyed (Vincent and others, Reference Vincent, Vallon, Reynaud and Le Meur2000), in agreement with our hypothesis. To estimate the uncertainties related to the exact dates of the aerial photos used to construct the DEM, which is important to compute the uncertainty in the glacier mass loss over our study period, we considered the glacier-wide mass balance data available for the period 1975–85 on the Sarennes, Saint-Sorlin and Argentière glaciers. For these three glaciers, the 10-a average annual mass balance was close to equilibrium: respectively, −0.14, 0.16 and 0.12 m w.e. a−1 and consequently exact dating would not introduce strong uncertainty. The cumulative mass balances over this 10-a period revealed a maximum amplitude (i.e. the difference between the highest and lowest values) of 2.07, 3.53 and 2.54 m w.e. for Sarennes, Saint-Sorlin and Argentière glaciers, respectively, which corresponds to an average uncertainty of ±0.10 m w.e a−1 in the 30-a mean glacier-wide mass balance computed by the difference between this DEM and the other from 2011.
Comparison between field DGPS measurements (triangles) and elevations (squares) derived from SPOT5 DEMs for 2003 (in red) and 2011 (in blue) for four cross sections of Glacier d'Argentière. The 2.5 m pixel resolution SPOT5 image in the background was acquired on 15 October 2011.

The two other DEMs (20 m resolution) were derived from SPOT5 2.5 m stereo-pairs acquired on 8 August 2003 and 15 October 2011. The DEM from 2003 only covers the Massif du Mont-Blanc; the one from 2011 covers the entire RoI. For the two satellite-derived DEMs, comparison with the elevation profiles surveyed in the field each year with DGPS measurements made by the GLACIOCLIM observatory showed that the changes in the DEM-derived elevations were accurate to within 1–3 m in the ablation area (Fig. 2). In 2003, the DGPS measurements were conducted on 10 September i.e. 1 month after the images were acquired. In 2003, the DEM (red squares in Fig. 2) is always above the DGPS (red triangles). This is consistent with the lowering of the glacier surface due to ablation during the month separating image acquisition and the DGPS survey. A simple estimate of ablation during this month using a degree-day model and considering an ablation rate of 6.6 mm of ice per degree and per day (Vincent, Reference Vincent2002) and average daily temperature values at Chamonix gave an ablation of ~1.2 m of ice at the elevation of profile 2 (less high up on the glacier). As a consequence, at least half the difference in elevation between the DEM and the DGPS can be attributed to the difference in dates. In 2011, the situation was reversed; the DGPS survey was conducted on 15 September i.e. 1 month before the image acquisition. Logically, the DEM (blue squares in Fig. 2) is below the DGPS (blue triangles). However, the difference in elevation between the DEM and the DGPS was less in 2011 because in September, ablation is much more limited than earlier in the ablation season. Regarding the effect of dynamics on the surface elevation changes, Vincent and others (Reference Vincent, Soruco, Six and Le Meur2009) showed that changes in thickness are mainly driven by changes in surface mass balance in the upper part of Glacier d'Argentière. The dynamic effect on elevation changes is close to zero in the upper part of the glacier at profiles 4, 5 and 7. At profile 2, the influence of longitudinal strain rate on the change in elevation was ~4.3 m a−1 in 2003, i.e. 0.36 m month−1. Given that the ice flow velocities and longitudinal strain rate have decreased in this part of the glacier since 2003 (Vincent, unpublished data), this influence should be less in 2011.
Finally, the uncertainty in the elevation of each pixel related to the geo-referencing and co-registration of the available DEMs was estimated at 2.5 m from the non-glacierized part of the study area (see the inner graph in Fig. 4).
3.2.1. End-of-summer snow line altitude time series
The snow line was delineated manually on multispectral images using a combination of the green, near-infrared and short-wave infrared bands, which has been shown to be the most appropriate combination to identify the limit between snow and ice (Rabatel and others, Reference Rabatel2012a, and Fig. 4 therein). The snow line was delineated on the central part of the glaciers to avoid border effects on the glacier margins: shadows from surrounding slopes, additional snow input by avalanches, over-accumulation due to wind, which mean the position of the equilibrium line could depend on local conditions. The average altitude of the snow line was calculated by overlaying the shapefiles containing the delineated snow lines for each year and each glacier on the DEMs. The IGN DEM was used for the first part of the period (up to the late 1990s) and the other ones for the rest of the period. Changing from one DEM to the other in the late 1990s had no impact on altitude of the snow line measured on the images because at that time, the end-of-summer SLA was located between 3000 and 3200 m a.s.l., an altitudinal range for which the difference in elevation between the DEMs is lower than their vertical accuracies (Rabatel and others, Reference Rabatel, Letréguilly, Dedieu and Eckert2013b).
3.2.2. Changes in glacier volume computed from the difference between DEMs
Quantifying changes in glacier volume at decadal timescale from the difference between elevation data of the glacier surface, the so-called geodetic method, is widely used. The elevation data come from either direct topographic measurements (using DGPS or LiDAR), topographical maps, aerial photographs or satellite data from optical, RADAR or laser sensors (e.g. Berthier and others, Reference Berthier, Arnaud, Vincent and Rémy2006; Rabatel and others, Reference Rabatel, Machaca, Francou and Jomelli2006, Reference Rabatel, Dedieu, Thibert, Letréguilly and Vincent2008; Thibert and others, Reference Thibert, Blanc, Vincent and Eckert2008; Gardelle and others, Reference Gardelle, Berthier, Arnaud and Kääb2013; Gardner and others, Reference Gardner2013). The subtraction of two DEMs gives the total volumetric variation of the glacier. The mean glacier-wide mass balance, $\overline B $
, over the period defined by the date of the two DEMs is calculated by dividing the total volumetric variation between the two dates by the product of the mean surface area of the glacier and the number of years, assuming a constant ice density of 900 kg m–3. Using such a density value assumes no change in firn volume and density occurs over time. However, over the study period, we moved from a period with mass gain to a period of strong mass loss and this assumption may introduce an uncertainty. As recommended by Huss (Reference Huss2013), we also applied an ice density value of 850 kg m−3. This change in ice density value leads to a difference of 0.04 m w.e. a−1 in the geodetic balance (average of the 30 glaciers studied) over the entire time period. This difference is included in the uncertainty assessment (see Section 4.1.1).
$\overline B $
, over the period defined by the date of the two DEMs is calculated by dividing the total volumetric variation between the two dates by the product of the mean surface area of the glacier and the number of years, assuming a constant ice density of 900 kg m–3. Using such a density value assumes no change in firn volume and density occurs over time. However, over the study period, we moved from a period with mass gain to a period of strong mass loss and this assumption may introduce an uncertainty. As recommended by Huss (Reference Huss2013), we also applied an ice density value of 850 kg m−3. This change in ice density value leads to a difference of 0.04 m w.e. a−1 in the geodetic balance (average of the 30 glaciers studied) over the entire time period. This difference is included in the uncertainty assessment (see Section 4.1.1).
4. RESULTS AND DISCUSSION
We first quantify the overall uncertainty in the annual glacier-wide mass balance computed using remote sensing. Then we present and discuss the changes in end-of-summer SLA in space and over time, the mean glacier-wide mass balance over the study period and finally the reconstructed annual mass balance time series. However, because changes in end-of-summer SLA and their relations with climate and morpho-topographic variables were the focus of a previous study (Rabatel and others, Reference Rabatel, Letréguilly, Dedieu and Eckert2013b) here we only recall the main findings on this topic.
4.1. Overall uncertainty in the annual glacier-wide mass balance computed by remote sensing
The overall uncertainty in the annual glacier-wide mass-balance values, ΔB
a, can be computed from the uncertainty in each of the variables in Eqns (1) and (2); i.e. ΔSLA
i
, ΔELA
eq
, $\Delta \overline B $
, Δ∂b / ∂z and the uncertainty related to the temporal difference between the date of the used satellite image and the end of the hydrological year, called Δdate. According to the error propagation method, it can be expressed as:
$\Delta \overline B $
, Δ∂b / ∂z and the uncertainty related to the temporal difference between the date of the used satellite image and the end of the hydrological year, called Δdate. According to the error propagation method, it can be expressed as:
 $$\Delta B_{\rm a} = \sqrt{ \matrix{\left( {\displaystyle{{\Delta \displaystyle{1 \over n}\mathop \sum \nolimits SLA_i} \over {\displaystyle{1 \over n}\mathop \sum \nolimits SLA_i}} + \;\displaystyle{{\Delta \partial b/\partial z} \over {\partial b/\partial z}}} \right)^2 \hfill \cr \quad +\left( {\displaystyle{{\Delta SLA_i} \over {SLA_i}} + \;\displaystyle{{\Delta \partial b/\partial z} \over {\partial b/\partial z}}} \right)^2 + \;(\Delta \bar B)^2 + (\Delta date)^2. \hfill}} $$
-
• The uncertainty in SLA i results from different sources related to the satellite images and DEM used (Rabatel and others, Reference Rabatel2012a): (1) the pixel size of the images, which ranged from 2.5 to 30 m depending on the sensor; (2) the slope of the glacier in the vicinity of the SLA i , which ranged from 7° to 32° depending on the glacier and the zone where the SLA i was located in any given year; (3) the vertical accuracy of the DEM; and (4) the standard deviation of the calculation of the average SLA i , which ranged from 10 to 170 m depending on the glacier and on the year concerned. Using the method of error propagation, the overall uncertainty in the SLA i ranged from ±15 to ±170 m depending on the glacier and on the year considered.
-
• Regarding the uncertainty in ∂b / ∂z, we considered a variability of ±10% related to the year-to-year and glacier-to-glacier variability described in Rabatel and others (Reference Rabatel, Dedieu and Vincent2005).
-
• The uncertainty in $\overline B $
results from (1) the lack of information on the exact date of the first DEM (refer to Section 3.2); (2) the georeferencing and co-registration of the DEMs (refer to Section 3.2); (3) the density used to convert the differences in glacier surface elevation into mass changes (refer to Section 3.2.2); and (4) the correction applied to the geodetic mass balance related to the fact that our reconstructed mass-balance time series using the SLA starts in 1983 and the first DEM is older (see Section 4.4). Combining these different sources of error, the overall uncertainty in
$\overline B $
is ±0.12 m w.e. a−1
$\overline B $
results from (1) the lack of information on the exact date of the first DEM (refer to Section 3.2); (2) the georeferencing and co-registration of the DEMs (refer to Section 3.2); (3) the density used to convert the differences in glacier surface elevation into mass changes (refer to Section 3.2.2); and (4) the correction applied to the geodetic mass balance related to the fact that our reconstructed mass-balance time series using the SLA starts in 1983 and the first DEM is older (see Section 4.4). Combining these different sources of error, the overall uncertainty in
$\overline B $
is ±0.12 m w.e. a−1
-
• Regarding the uncertainty resulting from the fact that the images were not recorded the last day of the hydrological year, we estimated the melting between the date of the images and 30 September in the following way: (1) for each year and each glacier, we calculated the numbers of days between the date of the image and 30 September; (2) we computed the positive degree-day sum at the elevation of the SLA, and computed the resulting melt using a degree-day factor of 6 mm °C−1 d−1 (Six and Vincent, Reference Six and Vincent2014). Considering all the glaciers over the entire study period, the average uncertainty related to the date of the images were ±0.09 m w.e. a−1 (ranging from 0 to ±0.33 m w.e. a−1 as a maximum).


Finally, ΔB a [Eqn (3)], equals ±0.22 m w.e. a−1 on average considering all the glaciers and all the years (ranging from ±0.19 to ±0.40 m w.e. a−1 depending on the year and glacier concerned).
4.2. Spatio-temporal variability of the ELA
Figure 3 illustrates changes in the end-of-summer SLA over the period 1984–2014 for the glaciers under study. Considering all the glaciers, the mean end-of-summer SLA for the whole period was located at 3045 ± 120 m a.s.l. The increasing trend in end-of-summer SLA was 6 m a−1 over the whole study period (1984–2014) assuming a statistically significant linear trend with a <5% risk of error. Since 2003, the mean annual end-of-summer SLA has almost always been above the mean end-of-summer SLA for the whole period. Considering two subsets, i.e. before and after 2003, no significant trend appeared in either of the subsets. The second subset is shorter (12 a) than the first (19 a), and trends computed on short periods should be interpreted with caution. However, the mean end-of-summer SLA between the two subsets increased by ~137 m. A Wilcoxon–Mann–Whitney test (Mann and Whitney, Reference Mann and Whitney1947) showed that the year 2003 can be considered as a breakpoint in the time series.
Changes in the end-of-summer SLA over the period 1984–2014 for the 43 glaciers described in Rabatel and others (Reference Rabatel, Letréguilly, Dedieu and Eckert2013b). The gray boxes represent the median interval (Q3−Q1), the horizontal black bar in each box represents the annual average of the sample, and the vertical black lines show the interval between the first and the last deciles (D1 and D9). The dashed red line represents the smooth underlying trend captured by a cubic smoothing spline regression and red dotted lines the corresponding 95% confidence interval. The horizontal blue dotted lines show the average end-of-summer SLA of all the glaciers over the periods 1984–2002 and 2003–14.

Regarding the spatial variability of the end-of-summer SLA at the scale of the French Alps, as discussed in Rabatel and others (Reference Rabatel, Letréguilly, Dedieu and Eckert2013b), a factor analysis distinguished two groups of glaciers corresponding to the northern Alps (Mont Blanc) and the southern Alps (Ecrins), respectively. The distinction between the two groups is related to a higher elevation of the end-of-summer SLA for the glaciers in the southern sector, which could be associated with differences in winter accumulation between the southern and northern French Alps (i.e. less accumulation in the southern French Alps) along with warmer summer temperatures in the southern sector that would increase ablation. Indeed, a decreasing trend in the elevation of the end-of-summer SLA appeared from south to north, with a mean end-of-summer SLA located on average 100 m higher for the glaciers in the southern sector.
Regarding the causes of the variability of the end-of-summer SLA in space and over time, Rabatel and others (Reference Rabatel, Letréguilly, Dedieu and Eckert2013b) showed that the mean end-of-summer SLA over the study period of each glacier is strongly controlled by its morpho-topographic variables, namely its average altitude, surface area, latitude and aspect. On the other hand, the interannual variability of the mean end-of-summer SLA of the glaciers studied is strongly controlled by climate variables. Indeed, the observed increasing trend in the mean end-of-summer SLA was mainly driven by increasing temperatures, and the nonlinear low-frequency fluctuations in the mean end-of-summer SLA time series were significantly correlated with winter precipitation anomalies.
4.3. Mean glacier-wide mass balance over the periods 1979–2011 and 2003–11
Figure 4 shows the difference in DEMs in the Massif du Mont-Blanc (French side only) and Massif des Aiguilles Rouges (northern part of the map) over the period 1979–2011. The maximum drop in glacier surface elevation was between 100 m and 130 m on the lower reaches of Mer de Glace, Glacier d'Argentière and Glacier de Tré la Tête. A comparison between the mean glacier-wide mass balance per period derived from satellite images and computed by the GLACIOCLIM observatory for Glacier d'Argentière and the Mer de Glace showed very similar values for the period 1979–2011. The mean annual glacier-wide mass balance of Glacier d'Argentière (Mer de Glace) derived from satellite data was −0.70 m w.e. a−1 (−0.80 m w.e. a−1) and from the photogrammetric data used in the adjustment of glacier-wide mass balance computed from ground measurements, it was −0.70 m w.e. a−1 (−0.74 m w.e. a−1). Over the period 2003–11, the satellite-derived mean annual mass balances were 0.2 m w.e. a–1 less negative than the field balances for the two glaciers, a value within the range of uncertainty in the two methods.
Difference in elevation between the 2011 SPOT5 DEM and 1979 IGN DEM in the French part of the Massif du Mont-Blanc. The insets show the distribution of the difference in elevation for pixels located outside the glaciers.

The region-wide mass-balance values of the Massif du Mont-Blanc and Aiguilles Rouges was −0.65 ± 0.23 m w.e. a−1 for the period 1979–2011, and was −1.83 ± 0.49 m w.e. a−1 for the period 2003–11. Further south, the region-wide mean annual mass-balance values of the Massif de la Vanoise and Massif des Ecrins (Fig. 1) were −0.62 ± 0.20 and −0.72 ± 0.33 m w.e. a−1, respectively, over the period 1979–2011. At the scale of the French Alps, the region-wide mass balance for the period 1979–2011 was −0.66 ± 0.27 m w.e. a−1. This value is in very good agreement with the estimate made by Fischer and others (Reference Fischer, Huss and Hoelzle2015) who found a value of −0.62 ± 0.07 m w.e. a−1 for the Swiss glaciers over the period 1980–2010, and also with the mean mass balance of −0.68 m w.e. a−1 found for nine glaciers throughout the Alps for the period 1983–2008 using WGMS data (Huss, Reference Huss2012). Using all the available data in the WGMS database, Zemp and others (Reference Zemp2015) also concluded that the last decades of the 20th century and the first decade of the 21st century were the most negative since the beginning of observational records, with mean annual mass-balance values ranging from −0.5 to −0.8 m w.e. a−1; values in line with our estimate.
4.4. Changes in mass balance in the French Alps over the period 1983–2014
Using the annual end-of summer snow line altitudes, SLA
i
, presented in Section 4.2 and the mean mass balance, $\overline B $
, presented in Section 4.3, the glacier-wide mass balance, B
a, of each of the 30 glaciers was reconstructed for the period 1983–2014 using Eqns (1) and (2).
$\overline B $
, presented in Section 4.3, the glacier-wide mass balance, B
a, of each of the 30 glaciers was reconstructed for the period 1983–2014 using Eqns (1) and (2).
It should be noted that $\overline B $
was computed for the period 1979–2011, which is slightly different from the period 1983–2014. From the mass-balance measurements available for Argentière and Saint-Sorlin glaciers from the GLACIOCLIM observatory since the 1970s, we computed the difference in
$\overline B $
was computed for the period 1979–2011, which is slightly different from the period 1983–2014. From the mass-balance measurements available for Argentière and Saint-Sorlin glaciers from the GLACIOCLIM observatory since the 1970s, we computed the difference in $\overline B $
between 1979–2011 and 1983–2011 on the one hand, and between 1979–2011 and 1979–2014 on the other hand.
$\overline B $
between 1979–2011 and 1983–2011 on the one hand, and between 1979–2011 and 1979–2014 on the other hand. $\overline B _{1983 - 2011}$
was 0.14 m w.e. a−1 more negative than
$\overline B _{1983 - 2011}$
was 0.14 m w.e. a−1 more negative than $\overline B _{1979 - 2011}$
, in agreement with the above-mentioned positive annual mass balances in the late 1970s–early 1980s. This difference was applied to each of the 30 glaciers by subtracting 0.14 m w.e. a−1 from the
$\overline B _{1979 - 2011}$
, in agreement with the above-mentioned positive annual mass balances in the late 1970s–early 1980s. This difference was applied to each of the 30 glaciers by subtracting 0.14 m w.e. a−1 from the $\overline B _{1979 - 2011}$
to obtain an adjusted
$\overline B _{1979 - 2011}$
to obtain an adjusted $\overline B _{1983 - 2011}$
. For the last 3 a of the series,
$\overline B _{1983 - 2011}$
. For the last 3 a of the series, $\overline B _{1979 - 2014}$
computed from available ground measurements was only 0.02 m w.e. a−1 more negative than
$\overline B _{1979 - 2014}$
computed from available ground measurements was only 0.02 m w.e. a−1 more negative than $\overline B _{1979 - 2011}$
. As a consequence, the adjusted
$\overline B _{1979 - 2011}$
. As a consequence, the adjusted $\overline B _{1983 - 2011}$
value was retained for the period 1983–2014.
$\overline B _{1983 - 2011}$
value was retained for the period 1983–2014.
Figure 5 shows the comparison between the glacier-wide mass-balance values obtained from GLACIOCLIM (field measurements adjusted with aerial photogrammetry) and from the remote-sensing data over the period 1983–2014 for Glacier d'Argentière [Fig. 5(a)] and Glacier de Saint-Sorlin [Fig. 5(b)]. The determination coefficients (r 2) were respectively, 0.81 and 0.96 (significant with a risk of error <1%) and the average differences in absolute value were 0.31 ± 0.20 m w.e. a−1 and 0.33 ± 0.27 m w.e. a−1, respectively. These results confirm the efficiency of our method using only remote-sensing data to quantify the glacier-wide mass balance. Considering the results in more detail, it will be seen that in some years the difference between the two methods exceeded 0.5 m w.e. a−1. For Glacier d'Argentière, this was the case in 1995, 2002, 2003 and 2013. For the first 3 a, the remote-sensing mass balances were too positive compared with the GLACIOCLIM values. This could be due to the low position of the end-of-summer SLA and the fact images were acquired before the end of the ablation season (on 31, 18 and 23 August, respectively). For the year 2013, the remote-sensing mass balance was too negative compared with the GLACIOCLIM value (a difference of 0.7 m w.e.), but the image was acquired on 1 September, so this difference cannot be explained by the date of the satellite image. For Glacier de Saint-Sorlin, differences between the two methods were >0.5 m w.e. a−1 for 5 a (1985, 1994, 2001, 2008 and 2010). In each one of these cases, the remote-sensing mass balance was too positive (or not sufficiently negative), but in all these years the images were acquired between 24 August and 23 September, i.e. not early enough in the season to explain the low end-of-summer SLA values.
Glacier-wide mass-balance time series for the period 1983–2014, quantified from the end-of-summer snow line (black diamond) and field measurements adjusted by photogrammetry (GLACIOCLIM data, square) for Glacier d'Argentière (a) and Glacier de Saint-Sorlin (b). Vertical bars represent the uncertainties.

Figure 6 shows the glacier-wide annual mass-balance time series for the 30 glaciers in the French Alps for the period 1983–2014. Considering annual data for the entire set of glaciers and the entire study period [Fig. 6(a)] it is noteworthy that the standard deviation of the values for each year was almost constant over the entire period (±0.56 m w.e.). Interannual variability and overall changes in glacier-wide mass balance over the study period are logically linked to those described for the end-of-summer SLA in Section 4.2. Balanced and positive years are mostly at the beginning of the study period, while negative to very negative glacier-wide mass-balance values dominate the last decade. The change in trend in the glacier-wide mass balance in the early 2000s can clearly be seen in Figs. 6(a) and 6(b). The difference in the average mass balance for the 30 glaciers between the periods 1983–2002 and 2003–14 was >1 m w.e. a−1 [Fig 6(a)]. This corresponds to 3.25-fold more negative average mass losses during the second period, which is in good agreement with results of Berthier and others (Reference Berthier2014), who reported a 3.3-fold increase in mass loss over similar periods for glaciers in the Massif du Mont-Blanc. Using mass balances measured on 10 glaciers in the Swiss Alps between 1950 and 2010, Huss and others (Reference Huss, Dhulst and Bauder2015) also showed an increase in glacier mass loss during the last decade with a decadal average two times more negative between 2000 and 2010 than between 1980 and 2000. The higher mass loss rate in the French Alps than in the Swiss Alps was already mentioned by Huss (Reference Huss2012). The possible link between these regional differences and different climate regimes in the French and Swiss Alps needs to be thoroughly analyzed.
Glacier-wide mass-balance time series for 30 glaciers in the French Alps (1983–2014), quantified from the end-of-summer snow line. (a) Centered annual values (blue and orange lines represent the average over the periods 1984–2002 and 2003–14 respectively; the light blue and light orange boxes show the ±1 standard deviation range). (b) Cumulative values (the black curve is the average of the 30 glaciers and the gray area shows the ±1 standard deviation interval).

In terms of cumulative loss or mean glacier wide mass balance over the entire study period, Fig. 6(b) and Table 1 underline the significant differences between the glaciers. Glacier du Mont de Lans (Ecrins) and Glacier du Baounet (Vanoise) presented respectively, the lowest and highest cumulative losses: −15.4 and −37.9 m w.e. The average cumulative loss for the 30 glaciers was −26.8 ± 5.2 m w.e. As mentioned in previous studies (e.g. Jóhannesson and others, Reference Jóhannesson, Raymond and Waddington1989; Huss and others, Reference Huss, Hock, Bauder and Funk2012), such differences between neighboring glaciers influenced by similar climate conditions are linked with the dynamic response of glaciers to a change in climate forcing. Indeed, glacier dynamics governs the mass transfer from the upper to the lower reaches of the glaciers, which, together with the surface mass balance, control changes in the glacier geometry (i.e. length, surface area and surface elevation). Because the glacier surface area, length, slope and elevations (min., max., mean) are easy to extract from a glacier inventory and are considered as indicative of glacier dynamics, these data are often used to infer differences in long-term changes in mass between glaciers (e.g. Hoelzle and others, Reference Hoelzle, Haeberli, Dischl and Peschke2003; Huss and others, Reference Huss2012). For example, Huss and others (Reference Huss2012) found significant, although rather low, correlations between mean 82-a mass balances and the surface area of 36 glaciers and the slope of their tongue. With our sample of 30 glaciers and 31 a of mass balances, we failed to find significant correlations with the glacier surface area and changes in surface area, length and changes in length, and minimum or maximum elevations (Fig. 7). The only significant correlations we found were with the mean elevation (r = 0.44, n = 30, p < 0.02), commonly considered as a proxy of the ELA0 (Rabatel and others, Reference Rabatel, Letréguilly, Dedieu and Eckert2013b; Braithwaite, Reference Braithwaite2015), and with the slope of the lowermost 20% of the glacier surface area (r = 0.43, n = 30, p < 0.02). Combining these two variables into a multivariate regression showed that 25% of the variance of the 31-a average mass balance of the studied glaciers can be explained by these topographic variables. As a consequence, other characteristics such as local specific meteorological conditions, or the distribution of glacier thickness, or the size of the accumulation zone may probably play a significant role in the differences in mass balance between neighboring glaciers.
Comparison between the mean glacier-wide mass balance over the entire study period (1983–2014) and morpho-topographic characteristics of the 30 glaciers studied (slope of the lowermost 20% of the glacier surface area, elevations, initial surface area, initial length), and changes in surface area and length over the study period.

The absence of correlation between mass changes and surface area or length changes for such a period of time (three decades) showed that at this timescale the response of the geometric adjustments of the glacier is not linear to changes in mass balance. As a consequence the changes in these variables cannot be used to infer mass changes.
4.5. Use of an intermediate DEM
For quantification of mass balance using DEMs, the mean surface area is generally taken as the arithmetic mean of the initial and final areas. As discussed by Thibert and other (Reference Thibert, Blanc, Vincent and Eckert2008), this assumes that surface and mass-balance trends are linear, which is not necessarily true, all the more when the study period is long or when the glacier surface changes from increase to decrease. We computed the glacier-wide mass balance for the glaciers of the Massif du Mont-Blanc with and without an intermediate DEM, i.e. the one from 2003 in addition to the two DEMs delimiting the study period. Figure 8 compares the cumulative glacier-wide mass balance of the Glacier d'Argentière obtained from GLACIOCLIM (Vincent and others, Reference Vincent, Soruco, Six and Le Meur2009) and that quantified from remote-sensing data. GLACIOCLIM data are shown by the black curve, those quantified by remote sensing by the gray and red curves. In the case of the gray curve, only two DEMs were used (one from 1979 and one from 2011). In the case of the red curve, an additional DEM (the one from 2003) was also used for the quantification of the annual mass balance. The agreement between the red and black curves is much better (the cumulative glacier-wide mass balance over the 1983–2014 period was −25.98 and −25.26 m w.e. using the satellite-derived and GLACIOCLIM data, respectively) than between the gray and black curves. In fact, using only the DEMs from 1979 and 2011 resulted in a 7% underestimation of the cumulative mass balance at the end of the period. The improvement in the remote-sensing data adjusted in 2003 is also illustrated by the inner scatter plot showing that the linear regression is closer to the 1 : 1 diagonal for the adjusted remote-sensing data than for the unadjusted ones compared with the GLACIOCLIM data (the slope of the regression line increases from 0.84 to 0.95; this increase is significant considering the error on the slope).
Cumulative glacier-wide mass balance of Glacier d'Argentière in the Massif du Mont-Blanc for the period 1983–2014 quantified using the end-of-summer snow line and DEMs, with or without adjustment using an intermediate DEM (red and gray lines, respectively). The cumulative glacier-wide mass balance from field measurements since 1979 and adjusted using the geodetic method (Vincent and others, Reference Vincent, Soruco, Six and Le Meur2009) is also shown (black line) and the inset shows a comparison of the annual values between field and remote-sensing glacier-wide mass balances.

Thus, the use of an intermediate DEM can reduce errors due to nonlinear changes in surface area and is recommended when the study period is long (several decades) and may include periods of glacial advance and retreat.
5. CONCLUSION
We presented the application of a methodological framework based on the use of optical satellite remote-sensing data only to compute time series of glacier-wide mass balance for 30 mountain glaciers located in the French Alps. This method enabled reconstruction of the 31-a glacier-wide mass-balance time series, thereby multiplying by six the number of glaciers with available long-term annual mass-balance time series in the French Alps. This underlines the high potential of this method to increase the available data at global scale, which falls within the second tier of the international glacier monitoring strategy defined by the Global Terrestrial Network for Glaciers. It should be noted that some limitations of this method compared with in-situ monitoring are that: (1) neither the seasonal component nor the spatial distribution of the mass balance can be retrieved; and (2) only glaciers with an uppermost elevation high enough to allow preserving an accumulation zone at the end of the ablation season can be studied.
Glacier-wide annual mass-balance time series reconstructed for the 30 glaciers confirmed:
-
• That despite good agreement in the interannual mass variations from one glacier to another related to meteorological conditions, the cumulative mass loss at decadal timescales varied considerably. At the scale of a few decades, the changes in glacier surface area and length are not representative of changes in mass balance. This suggests that the distribution of glacier thickness and the ice flow need to be considered to better understand the relationships between changes in mass and in geometry.
-
• That there was a shift in the trend of glacier mass loss in the early 2000s, with a 3.25-fold increase in the average mass losses by the 30 glaciers between the periods 1983–2002 and 2003–14.
At the scale of the French Alps, our estimated region-wide mass balance for the period 1979–2011 was −0.66 ± 0.27 m w.e. a−1, which is in good agreement with estimates made in other studies of the European Alps over the same time period.
The next step will be automating the method in order to apply it globally or at least for glaciers where the end-of-summer snow line can be considered as a proxy of the ELA, taking advantage of the global DEMs available since the late 1990s–early 2000s, the archives of optical satellite data and the upcoming images provided by the latest generation of satellites like Landsat 8, SPOT6–7 or Sentinel-2. However, such a global application still needs to tackle some problems such as: automating the detection of the end-of-summer snow line and the computation of its elevation, or finding DEMs of sufficient accuracy to compute the geodetic balance from the late 1970s to early 1980s for the long-term application of the method, which for some mountain ranges might not be so easy as for the European Alps.
ACKNOWLEDGEMENTS
First of all, the authors wish to pay tribute to Louis Reynaud who died in February 2016, to his investment on glaciers’ monitoring, particularly in the French Alps, and his implication in the development of the method presented in this study. This study was conducted in the framework of the French glacier observatory GLACIOCLIM (http://www-lgge.ujf-grenoble.fr/ServiceObs/index.htm). This work was made possible thanks to the Labex OSUG@2020 (Investissements d'avenir – ANR10 LABX56); USGS-EDC, NASA/METI/AIST/Japan Space systems, U.S./Japan ASTER Science Team and the GLIMS initiative, which gave us free access to Landsat images and ASTER images. We are also grateful to the French National Geographic Institute (Institut Géographique National, IGN) for providing the 1979 DEM; CNES / SPOT-Image ISIS program, contracts # 0103-157, 0412-725, 2010-405, 2010-435 and 2011-513 for providing the SPOT images and SPOTDEM from 2003 and 2011. Finally, we thank G. Cogley (editor in chief), B. Kulessa (scientific editor) and the two anonymous referees for their constructive comments used to improve the paper.
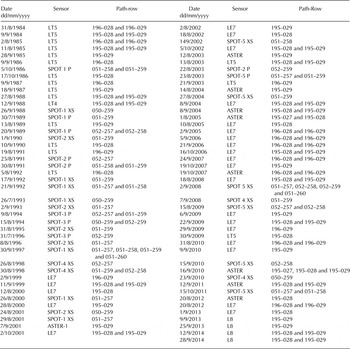
Appendix
Characteristics of the 131 satellite images used for SLA measurements. For Landsat images, the pixel size is 15 and 30 m for the panchromatic and multispectral modes, respectively (LT5 = Landsat 5 TM, LE7 = Landsat 7 ETM+, L8 = Landsat 8 OLI). For SPOT images the pixel size is 2.5, 5 or 10 m for the panchromatic mode (P) and 10 or 20 m for the multispectral mode (XS) depending on the satellite. For ASTER images the pixel size is 15 m


 Open access