


1. Introduction
Even though most physical infrastructure projects bring hefty price tags, we nonetheless overinvest in it while underinvesting in more cost-effective alternatives, especially social infrastructure.Footnote 1 Social infrastructure's definition varies widely (see Joshi and Aldrich, Reference Joshi and Aldrich2022 for an overview of the uses of the term), with some using the term indiscriminately, labeling any kind of facility that supports social services – including those in the fields of education, healthcare, housing, and transport – as social infrastructure (MOFA, 2005; Ishizuka et al., Reference Ishizuka, Hara, Namba and Hirota2019). Others have conflated social capital – the ties that bind us to each other (Aldrich, Reference Aldrich2019) – and social infrastructure – the places that build those connections. This article uses the term social infrastructure more selectively, referring only to the spaces and places that create and maintain connection. Hence free and publicly funded spaces like libraries, parks, kōminkan, and community centers along with private social businesses such as cafés and restaurants fit in this approach (see Fraser et al., Reference Fraser, Cherdchaiyapong, Tekle, Thomas, Zayas, Page-Tan and Aldrich2022 for details on mapping this infrastructure). This definition excludes gray infrastructure, that is, road, ports, dams, and other spaces built for transportation infrastructure, along with homes and office buildings, regardless of occasional uses of those spaces for social reasons.
Societies regularly mitigate risks – such as natural hazards, terror attacks, and crime – through physical infrastructure. To fight risks like tsunami and floods, governments construct concrete seawalls, elevate homes, and reinforce beaches with sand. To fight terrorism, they build military bases abroad (Calder, Reference Calder2007; Cooley, Reference Cooley2008), set up hardened shelters (Elran, Reference Elran2017), and build and send out drones to eliminate extremists. To fight crime, law enforcement relies on often aging and overcrowded prisons (Harding et al., Reference Harding, Morenoff, Nguyen, Bushway and Binswanger2020). We certainly need much of the investment in physical infrastructure given regularly failing grades assigned to it by engineers in North America (ASCE, 2021). Studies have shown that investments in physical infrastructure to mitigate water damage can reduce flood consequences (Ishiwatari and Sasaki, Reference Ishiwatari and Sasaki2021). And much of that gray infrastructure – roads, ports, bridges – helps our society and our economy run smoothly.
While impressionistic evidence suggests that social infrastructure can alter the trajectories of shocks for residents (Klinenberg, Reference Klinenberg2018; Aldrich, Reference Aldrich2021), few studies have sought to investigate this question using quantitative data, especially in direct comparison with the impact of mitigating physical infrastructure. This article pushes the discussion forward, using quantitative data from Miyagi, Iwate, and Fukushima prefectures in Japan to illuminate how higher levels of social infrastructure – controlling for other important factors – correlated with lower mortality rates among the most vulnerable population, that is, the elderly, during the 3/11 triple disasters. I first define three core categories of infrastructure, analyze the outcomes of a vulnerable population during Japan's 11 March 2011 events using data from more than 550 neighborhoods, and then suggest other policy arenas of challenging problems (cf. Kolko, Reference Kolko2012) in which social infrastructure can serve an important, low-cost role.
2. Defining infrastructure
The United States government defined 16 sectors as critical infrastructure, including chemical plants, commercial facilities, critical manufacturing plants, dams, the defense industrial base, emergency services, energy facilities, financial services companies, food and agriculture sector firms, government facilities, healthcare, information technology sector, nuclear reactors, materials, and waste, transportation, and water and wastewater systems (White House, 2013). I recategorize infrastructure into three types: gray, green, and social, as laid out in Table 1 below.
Relevant infrastructure types

A current push in North America for physical or gray infrastructure investment has focused attention on the quality of the nation's bridges, roads, ports, and dams. The American Society of Civil Engineers (ASCE) regularly issues a report card for this type of public investment in the United States, and bridges, dams, and other built environment facilities regularly receive failing to poor grades (ASCE, 2021). At the same time, research has shown that green infrastructure – such as biophilic urban parks, urban forestry, rainwater harvesting and gardens, water capturing plazas, roof and community gardens, and other ways of water management – improves quality of life, air quality, and reduce heat (Currie, 2021). These newer investments have become more popular for crowded, hot, urban environments (Grabowski and McPhearson, Reference Grabowski and McPhearson2021) and include projects such as biomimicry-based flood protection (Currie, 2021).
A third often overlooked type of infrastructure – social infrastructure – may prove more critical still. Social infrastructure provides the foundation on which civic engagement, trust, information sharing, and social ties grow. Spaces and places where people can meet, play, and build trust – including community centers, libraries, walking trails, and faith-based spaces – provide the structures on which social capital can be built and maintained. In turn, our horizontal (bonding and bridging ties) and our vertical ties (linking social capital) influence our behavior, provide information, and help overcome collective action problems. In this way, social infrastructure – the architecture, space, and shade around us – influences the ways we interact with others and therefore the direction we take as communities and societies (Jacobs, Reference Jacobs1961; Klinenberg, Reference Klinenberg2018).
What sort of potential do social infrastructure sites have in serving as mitigating facilities against shocks?
3. Empirical investigation: social infrastructure during 3/11
I now investigate how social infrastructure can measurably alter the trajectory of vulnerable groups facing natural hazards using a hard case, namely Japan's 11 March 2011 disasters. With more than 18,400 deaths caused mostly by the 20+ m waves, this triple disaster of earthquake, tsunami, and nuclear meltdown provides an opportunity to compare, side by side, the impact of physical vs social infrastructure on a highly vulnerable population. The Japanese government has long pushed the use of traditional, gray infrastructure like seawalls and berms for mitigating the impact of tsunami and flooding (Aldrich, Reference Aldrich2019). Here I compare the empirical consequences of seawalls of different heights on varying concentrations of social infrastructure. Using observational data from Ye and Aldrich (Reference Ye and Aldrich2019), I look at how kōminkan, community centers, and other social infrastructure facilities across more than 550 machi ōaza (neighborhoods) in the three prefectures affected most strongly by the tsunami – Fukushima, Iwate, and Miyagi – correlate with mortality rates for those over 65.
4. Determinants of mortality
Several communal, hazard-related, and geographic factors may influence how residents – especially elderly residents – encounter a shock like a tsunami. First, geographic conditions may influence mortality rates among those 65 years of age (Frankenberg et al., Reference Frankenberg, Gillespie, Preston, Sikoki and Thomas2011). Neighborhood size – especially its area – could have one of two impacts. Larger neighborhoods may provide more space for residents to find higher ground (such as higher buildings and mountaintop shrines), or they may force them to move further to get to such high ground and therefore spend more time exposed to the threat. Another geographic condition is the presence (or absence) of a seawall, and its height. Japanese engineers regularly argue that higher seawalls provide more protection from tsunami (Author interviews, August 2022).
A second type of factor that could influence the outcome involves the hazard itself and exposure to that hazard. Higher tsunami can more easily come further ashore, so neighborhoods hit by higher waves are likely to see higher rates of mortality. Communities that are more inland, though, may have some mitigation from the tsunami, as its strength may wane several kilometers from the beach. A third set of factors revolve around the economic conditions in the neighborhoods affected by the shock. While we lack direct measures of residents' wages and income, we can make some inferences based on broader conditions of housing and education. Here, we capture both the proportion of residents owning (versus renting) homes along with the percentage of those that are educated. Better educated, home owning residents may live in higher quality structures that can better survive a tsunami and may have better knowledge of forthcoming events, making them more likely to evacuate.
A fourth set of factors that may impact mortality among the elderly is social capital, which are the connections that bind residents to each other. Some studies have found that stronger social ties in communities reduced overall mortality through collective action and mutual aid (Aldrich and Sawada, Reference Aldrich and Sawada2014; Aldrich, Reference Aldrich2019), but others have argued that providing aid to those in vulnerable sites may increase overall mortality (by placing the lives of friends and family in danger). Here I capture social ties through the normed density of nonprofit organizations and through the percentage of citizens still in their homes after a five year period (2005 through 2010). The final set of factors of interest revolves around social infrastructure – the places and spaces that help maintain and build social capital – defined here as the number of community centers, libraries, kōminkan, and parks divided by the neighborhood population.
Controlling for several relevant factors, including geography, characteristics of the hazard, social ties, and economic factors, an ordinary least squares (OLS) regression demonstrates that social infrastructure measurably correlates with reduced mortality rates. To better isolate potential causal mechanisms, I move to nearest neighbor matching (NNM) and average treatment effect (ATE) frameworks to show how communities with higher than average, normed numbers of such facilities have lower mortality rates than similar but less equipped communities.
Table 2 below lays out the data collected by Ye and Aldrich (Reference Ye and Aldrich2019) in their study of the interaction between social ties, age, and mortality rates. The outcome of interest is the proportion of elderly residents (those over the age of 65) who perished in the 3/11 tsunami. Please see Appendix Table 1 for details on the measurement and sources of these variables.
Descriptive statistics

Here, I focus on the density of social infrastructure, which is captured through the number of kōminkan (citizens' public halls), community centers, libraries, and parks in each neighborhood divided by the population (i.e. normed for population). Table 3 below shows the estimated coefficients for the OLS regression of mortality rates among the 65 + residents on a variety of geographic, economic, social capital, and social infrastructure variables. Validation through other models – including generalized linear models (GLMs) and left censored tobit models – showed little to no difference in estimated coefficients. As expected, and across models, higher tsunami had a positive correlation with mortality, while greater distance to the sea and higher seawalls had a lower one. Most important for this analysis is the fact that, controlling for these factors, social infrastructure was statistically significant and negatively correlated with our outcome of interest. Higher density of libraries, parks, and kōminkan measurably connect with lower mortality rates among the elderly.
Regression coefficient estimates

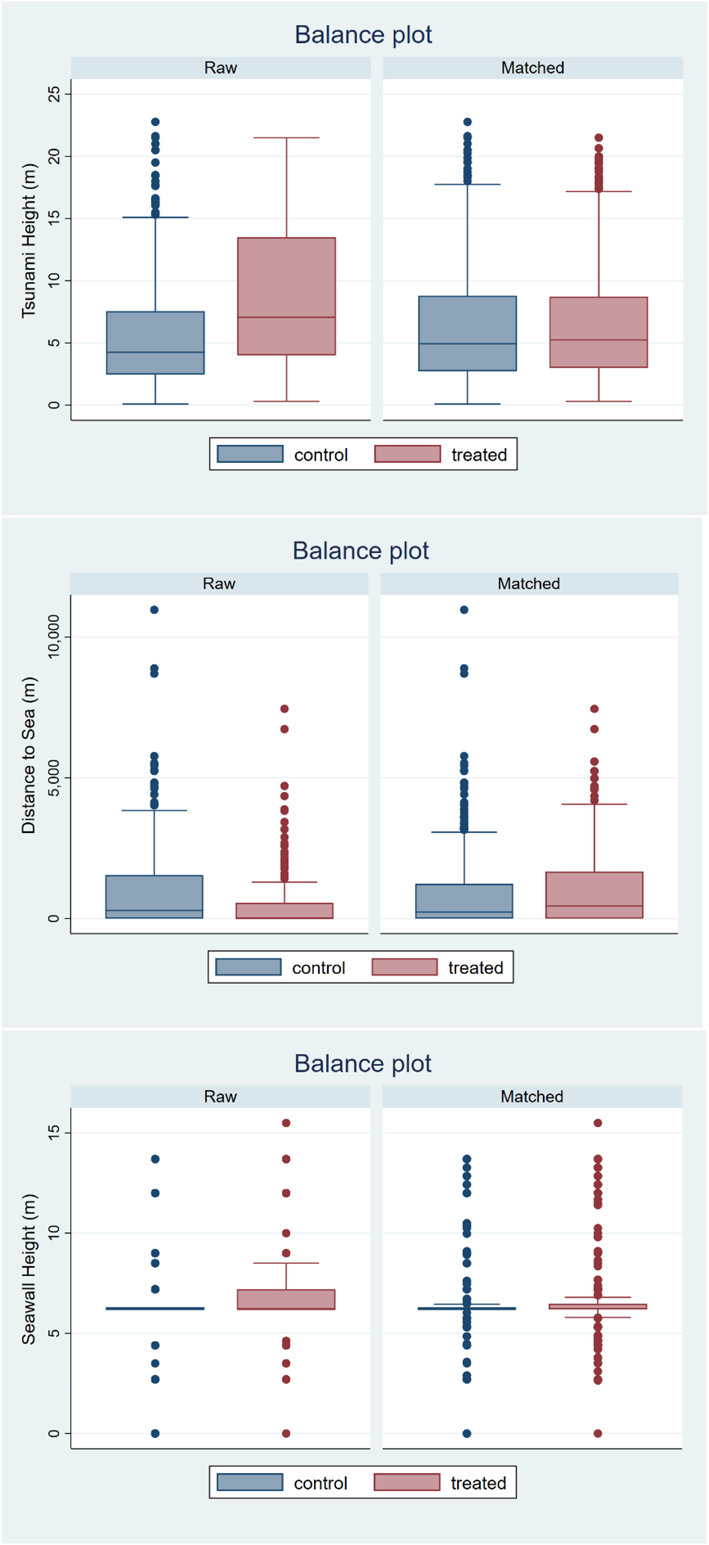
As these data are observational and not experimental, I move from regression to an average treatment effect (ATE) approach using nearest neighbor matching to better estimate potential causality. Matching on the other covariates in the OLS regression (area, height of the seawall, height of the tsunami, distance to the sea, home ownership, etc.), the estimated ATE of a neighborhood having more than the average number of normed social infrastructure facilities on over 65 mortality rates during the 3/11 tsunami is −1.1 (standard error 0.77, P value of 0.1, 138 treated observations, 424 control observations. For more details on the balance of matched and unmatched observations please see Appendix 2). These data provide reasonable evidence that social infrastructure – controlling for potential cofounding factors and existing levels of social ties through NPOs and other organizations – mitigates shocks for the most vulnerable. I next go beyond hard-to-interpret statistical tables to visually illustrate the relationship between the quantities of interest using simulation and confidence intervals (King et al., Reference King, Tomz and Wittenberg2000). Figure 1 below shows the statistically significant and measurable relationship in the unmatched, original sample between social infrastructure facilities and elderly mortality rates.
Predicted relationship between social infrastructure and elderly mortality rates.
Note: N = 562, number of simulations = 1,000, OLS model. All variables (residential stability, area, height of the seawall, height of the tsunami, distance to the sea, proportion of residents owning homes, NPOs, etc) held at their means except for the social infrastructure value, which varied between 0 and 0.02 (the interquartile range of the sample). The shaded area indicates the 95% confidence interval around the predicted value.

Given this clear relationship, and with a few transparent assumptions about costs, it is possible to compare the life-saving benefits during shocks from investing in physical as opposed to social infrastructure (see Appendix 3 for details on these assumptions). A 1-m increase in seawall height results in a −0.23 change in elderly mortality rates, while investment in one extra site of social infrastructure per 1,000 residents is predicted to result in a −0.15 change in that same outcome. In other words, increasing a seawall by 1 m might translate into 40 fewer elderly residents dying in a tsunami. In contrast, investment in one site of social infrastructure (e.g., library, community center, park, etc.) could save 26 elderly people. At a smaller financial cost ($1 million USD vs $5 million USD), a neighborhood adding locally appropriate social infrastructure would potentially mitigate some of the potentially fatal consequences of this kind of disaster.
5. Discussion: social Infrastructure's application to challenging policy issues
This article has quantitatively demonstrated how kōminkan, libraries, community centers, and other social infrastructure facilities correlated with improved survival rates for a vulnerable population during a large-scale natural hazard in Japan. Social infrastructure may serve as an efficacious and cost-effective solution when directed towards challenges which have no, simple technical solution, as seen below in Table 4. Importantly, many of these facilities have multiple uses in their neighborhoods. Community centers, such as the Ibasho project in Massaki-chōFootnote 2, for example, not only help the elderly survive shocks (as this article as shown), but they also provide places where people can build ties to other demographics and age groups, learn new skills, and continue traditional practices such matsuri (festivals) (Lee et al., Reference Lee, Aldrich, Kiyota, Yasuhiro and Sawada2022). So too libraries are not just repositories for books – they can provide English language skills to new immigrants, social ties to the lonely, a cooling shelter for those without air conditioning, and a place for events such as voter registration and tax filing (Klinenberg, Reference Klinenberg2018).
Application of social infrastructure in three problem areas

In this way social infrastructure builds resilience not only to natural hazards like tsunami but also chronic stressors like loneliness and a lack of critical social interaction. In North America, for example, high quality social infrastructure – such as in demand social businesses like restaurants and cafes (which I did not test directly in this article) – may help not only boost revenue for local entrepreneurs and grow foot traffic, but can also mitigate the impact of polarization, providing spaces where people of different political parties could meet for social interaction (Fraser et al., Reference Fraser, Cherdchaiyapong, Tekle, Thomas, Zayas, Page-Tan and Aldrich2022). It is important to note that, like other policies, social infrastructure requires bottom-up activation to be successful; simply building a low quality, unwanted, and therefore unlikely to be used park, library, or public swimming pool will not help build resilience or mitigate shocks.
Fortunately, societies around the world have begun to experiment with community driven investments in locally appropriate social infrastructure. Trinidad and Tobago, for example, have begun creating community policing zones, school programs and NGO sites where residents can seek to deter crime and reduce violent extremism (Anever, 2015; Aldrich and Mahabir, Reference Aldrich and Mahabir2022). The US State Department continues to push for nontraditional approaches to human security revolving around schools and religious institutions in the Sahel (Aldrich, Reference Aldrich2012b, Reference Aldrich2014) and even local police departments in North America claim that changes to the structure of neighborhood parks and other social infrastructure have decreased crime (Riddle, Reference Riddle2022). Whether these infrastructure programs can scale and whether they are as or more effective than traditional gray infrastructure approaches remain open questions.
6. Conclusions
The United States, Japan, and other advanced industrial democracies have long underinvested in the obvious, tangible, and mundane built environment that sustains our economy: roads, bridges, ports, and dams. The ASCE has yet to rate the facilities in any states or localities in the U.S. with a grade above a C, and many pieces of our gray infrastructure have received failing grades (ASCE, 2021). But even the current North American administration's push for a large-scale overhaul of physical infrastructure may be missing more critical elements of our society: the invisible, often overlooked social infrastructure which helps solidify and strengthen our civic infrastructure.
Other challenges come with gray infrastructure: standard physical infrastructure projects, designed to mitigate the impact of climate change and other shocks, may increase damage to local communities (Hummel et al., Reference Hummel, Griffin, Arkema and Guerry2021). Shore hardening and armoring projects – using concrete breakwaters, seawalls, tetrapods, and ripraps to reduce flood impact – regularly destroy local ecosystems and reduce biodiversity (Gittman et al., Reference Gittman, Scyphers, Smith, Neylan and Grabowski2016). While we certainly need much of our gray infrastructure, we also have the tendency to underestimate its negative externalities on society.
Given its cost-effectiveness, social infrastructure has the potential to help solve major challenges across policy realms. In the field of counter terrorism, for example, facility-based vocational training and mosque-based reconciliation can decrease the likelihood of recruitment and draw away support for terror groups (Aldrich, Reference Aldrich2012b, Reference Aldrich2014). Without the ability to divert would-be terrorists from joining violent extremist groups or provide medical treatment to addicts we continue to invest in law enforcement systems that provide punishment but not justice or equity. In fighting crime, programs which support mental health through half- way homes, drug treatment centers and library-based skills improvement can reduce recidivism and crime (Steadman et al., Reference Steadman, Deane, Borum and Morrissey2000; Compton et al., Reference Compton, Bahora, Watson and Oliva2008). In mitigating and responding to natural hazards like tsunami, floods, and earthquakes, investments in school-based citizen science and community centers have reduced harm and accelerated recovery (Aldrich, Reference Aldrich2012a, Reference Aldrich2019). Japan's 3/11 disasters demonstrated how $250 billion USD invested in 40 + foot tall concrete seawalls disrupted local ecosystems, angered residents, and did little to save lives, while the intangible bonds in coastal Tohoku communities helped people survive and thrive (Matanle et al., Reference Matanle, Littler and Slay2019; Yarina, Reference Yarina2022).
Many questions remain, and future research should pursue four related avenues of inquiry. First, given available data on physical and social infrastructure, scholars should seek to understand why we overinvest in seawalls, berms, and other projects, and underinvest in kōminkan, community centers, libraries, and other social infrastructure. This question is sharpened by a growing body of evidence that higher investments in physical infrastructure may in fact slow or reverse population recovery after disaster (cf. Nagamatsu, Reference Nagamatsu, Santiago-Fandino, Sato, Maki and Iuchi2018; Fraser et al., Reference Fraser, Aldrich and Page-Tan2021a, Reference Fraser, Aldrich and Small2021b). It is likely that our overinvestment in physical infrastructure stems at least in part from the traditional use of cost-benefit analyses, which collect data on built structures and the costs of rebuilding but cannot capture issues of equity and social consequences (Junod et al., Reference Junod, Martín, Marx and Rogin2021). Further, public sector spending on large scale gray infrastructure projects crowds out organic, bottom up, community-led growth (Kameda et al., Reference Kameda, Miwa and Nagamine2021). By harming the natural environment, disproportionately incarcerating people of color, and creating collateral damage among civilians, physical infrastructure responses often exacerbate racial inequality and further climate injustice (Sunter et al., Reference Sunter, Castellanos and Kammen2019).
Some answers are likely to be found in the political economy of physical infrastructure – namely that politicians and decision makers benefit from physical infrastructure spending through lobbying and political donations from firms in the industry. Further, social infrastructure investments may be less attractive to decision makers who prefer the larger-scale, more expensive investments connected with physical infrastructure due to their visibility and rapidly visible outcomes. Because of these challenges and the path dependence around traditional investments, government agencies around the world planning new facilities and spaces to manage climate change are starting to recognize that older school, cost benefit analysis (CBA) approaches miss the nuances that more sophisticated approaches like the triple-dividend approach can uncover (Hegelson and Li, Reference Hegelson and Li2022).
Second, this paper has looked primarily at the role of a limited set of social infrastructure facilities – namely kōminkan (citizens' public halls), community centers, libraries, and parks – and did not look at the role of other free to enter, publicly support sites such as schools and shrines or private, closed sites such as social businesses (e.g. cafes, pubs, food trucks parked outdoors, barbershops, etc.). While data availability precludes analyzing the impact of these types of facilities in this article, qualitative research has indicated that one type of social infrastructure – shrines in Tohoku, Japan – may have saved the lives of coastal residents through their deliberate location on high ground (Takase et al., Reference Takase, Yoshida and Kumagai2012). Future research should expand the types of social infrastructure facilities under investigation.
Third, we need to begin illuminating the degree to which social infrastructure can measurably impact the resilience of communities to other global challenges, such as terrorism and crime (Compton et al., Reference Compton, Bahora, Watson and Oliva2008; Aldrich, Reference Aldrich2012b, Reference Aldrich2014; Anever, 2015). Too often decision makers continue to fall back on standard, kinetic approaches to terrorism, violent extremism and crime rather than considering alternatives which may simultaneously be less expensive and more efficacious. A fourth and final area of investigation is the degree to which quality – and not just density or quantity – of social infrastructure facilities builds resilience to shocks and stressors in neighborhoods. Little systematic data exists on whether a highly utilized, top quality park, library, or café builds collective action potential and increases intergroup connections more effectively than poorly constructed, rarely utilized sites.
We need to begin taking the architecture of our cities and towns seriously, recognizing that without common spaces, parks, pools, and defensible space we will see more and more ruptures in our social fabric (Newman, Reference Newman1996). Without unity, collaboration, and communication, residents may lack trust in pronouncements from government officials, as we have seen during the ongoing COVID19 pandemic (Fraser et al., Reference Fraser, Aldrich and Page-Tan2021a, Reference Fraser, Aldrich and Small2021b). Our social infrastructure – and the NGOs and civil society organizations that flourish because of them – should not be overlooked (Ananthanathan, Reference Ananthanathan2021). Without confidence in our leaders and ties to our neighbors, finding the good life will continue to be only a dream for many (Pharr and Putnam, Reference Pharr and Putnam2000).
Supplementary material
The supplementary material for this article can be found at https://dataverse.harvard.edu/dataset.xhtml?persistentId=doi:10.7910/DVN/YA0EYS
Acknowledgements
The author is grateful to the journal's editors, three anonymous reviewers, and Howard Aldrich and Tim Fraser for helpful suggestions on improving this article through multiple rounds of revisions. Further, I wish to thank Susan Pharr for her many contributions as a mentor and advisor over my career. All errors are the author's own.
Appendix 1
Variables, their measurements, and sources

Appendix 2
Balance plots of raw and matched data for selected variables
Appendix 3
Cost and mortality reduction calculations
Researchers estimated the per-meter cost of seawall construction in Tohoku at 482,877 JPY (roughly $3,500 USD) per meter (Burnett et al., Reference Burnett, Endo and Taniguchi2016) while others argued that a 4 m high, 420 m length wall runs $10 million USD with a 20 m height wall of the same length reaching some $50 million (Kanda, Reference Kanda2016). Following this approach, which found a linear relationship between elevating existing walls and cost, I assume that increasing the height of a 420 m tsunami wall (sufficient to ward a neighborhood) by a meter runs roughly $5 million USD. For the cost of $5 million USD, a 1-m increase in average neighborhood seawall height is projected to decrease elderly mortality rates by 0.233.
The cost of building a single community center – a prime example of social infrastructure – runs at roughly $1 million USD (including maintenance and energy costs) (based on Aldrich and Kiyota, Reference Aldrich and Kiyota2017); each neighborhood in our sample hosts an average of fewer than 2 social infrastructure sites with an average population of 1,500, that is, 0.0013 sites per capita. For each million dollars spent on more social infrastructure (i.e. one more community center or park), elder mortality rates decrease further, by −0.228 given the original 2 sites, −0.342 given 3 for $1 million more, then −0.456 (4), −0.57 (5), −0.685 (6), totaling a decrease of −0.799 (7) for a hypothetical $5 million investment.


 Open access

