


1. Introduction
Ice tongues and ice shelves are the seaward floating extensions of glaciers, draining interior continental ice into the ocean. While ice shelves tend to be in embayments and are therefore in contact with the coastline, ice tongues are long and narrow, extending far beyond their connections to land. This direct interaction with the ocean makes them vulnerable to warming ocean temperatures and related mass loss from basal melting and calving (Pritchard and others, Reference Pritchard2012). As a result of their frictional contact with land, ice shelves hold back the ice that is discharged by the outlet glaciers through buttressing. Current theory and observations show that ice tongues do not provide buttressing due to their limited connection to the land (Fürst and others, Reference Fürst2016). However, the spatial and temporal interactions of fractures with the morphology of ice tongues will inform on similar processes for vulnerable ice shelves. Furthermore, ice tongues are increasingly being found to impact local and regional ocean conditions, including encouraging and inhibiting sea ice formation (Kusahara and others, Reference Kusahara, Hasumi and Williams2011; Stevens and others, Reference Stevens2017). As such, establishing the controls on fracturing and calving will have implications for future projections of Antarctic ocean conditions.
The calving rate of floating ice bodies is determined primarily by a combination of the ice rheology, strain rates from ice flow, and the spatial variability of ice thickness (Borstad and others, Reference Borstad2012; De Rydt and others, Reference De Rydt, Gudmundsson, Nagler, Wuite and King2018; King and others, Reference King, De Rydt and Gudmundsson2018). The heterogeneity of ice rheology can impact the propagation rates of rifts and fractures that lead to calving. Rifts have been demonstrated to propagate faster in meteoric ice and slow or stop propagating in suture zones and other regions where marine ice formation is common (Kulessa and others, Reference Kulessa, Jansen, Luckman, King and Sammonds2014; Borstad and others, Reference Borstad, McGrath and Pope2017; Lipovsky, Reference Lipovsky2018). However, the opposite has been found by De Rydt and others (Reference De Rydt, Gudmundsson, Nagler, Wuite and King2018) and King and others (Reference King, De Rydt and Gudmundsson2018), where propagation is slower in meteoric ice and faster through suture zones and marine ice. Rift propagation occurs in regions with extensional strain rates. Ice tongues, unlike ice shelves, lack pinning points and therefore should have relatively consistent strain characteristics both spatially and temporally, although variable ice draft can drive horizontal variability in ice strain. Such draft variation can be the result of basal channels which form on the underside of floating ice bodies through enhanced melting at the ice–ocean interface (Rignot and Steffen, Reference Rignot and Steffen2008; Pritchard and others, Reference Pritchard2012; Vaughan and others, Reference Vaughan2012; Alley and others, Reference Alley, Scambos, Siegfried and Fricker2016). Some of these channels are formed from ocean melting alone whereas others are potentially associated with the outflow from subglacial channels over the grounding line (Le Brocq and others, Reference Le Brocq2013; Alley and others, Reference Alley, Scambos, Siegfried and Fricker2016). We are particularly interested in the interaction between floating ice strain rates and variability in ice draft to examine whether the ice thickness plays a direct role in fracture propagation, particularly since warming ocean conditions around the Antarctica (Paolo and others, Reference Paolo, Fricker and Padman2015) will most probably cause significant changes in the draft of floating ice bodies.
We use the Drygalski Ice Tongue as a case study of the role of ice morphology in fracture and calving processes. Ice tongues can be found all around the coast of Antarctica, with several in East Antarctica extending into the Ross Sea. Along the Victoria Land coast alone are at least 14 ice tongues, including the Drygalski Ice Tongue, the largest in the region (SCAR Secretariat, 1992). The Drygalski Ice Tongue is ~140 km long from the grounding line, with a ~90 km unconfined floating extension into the Ross Sea. This is considerably larger than other ice tongues in the area, including Erebus Glacier Tongue and the Campbell Glacier Tongue, both <15 km in length (Han and Lee, Reference Han and Lee2014; Stevens and others, Reference Stevens2014). Wuite and others, (Reference Wuite, Jezek, Wu, Farness and Carande2009) suggested that the length of the Drygalski Ice Tongue is controlled by the infrequent occurrence of large calving events, compared to other ice tongues such as Mertz Glacier Tongue, where the calving cycle is determined by the bed topography (Wang and others, Reference Wang, Holland, Cheng and Gong2016).
The considerable length of Drygalski Ice Tongue gives us the opportunity to examine controls on fracturing and calving of this ice body. Our aim is to determine why fractures are inhibited from propagating transversely across the ice tongue, allowing it to extend a great distance into the Ross Sea. To address this aim, we use 21 years of Landsat imagery to analyze the formation and evolution of several large fractures along Drygalski Ice Tongue and compare their extent to ice thickness using hydrostatic equilibrium calculations from surface elevation data complimented by airborne radar surveys over the ice tongue. We expand this analysis by calculating ice strain rates from satellite-based velocity products and compare with the location of fracture formation. Finally, we apply a subglacial hydrology model (the Glacier Drainage System (GlaDS) model) to David Glacier to estimate the location and rates of subglacial water flux over the grounding line that may impact the draft of Drygalski Ice Tongue.
1.1 Study area
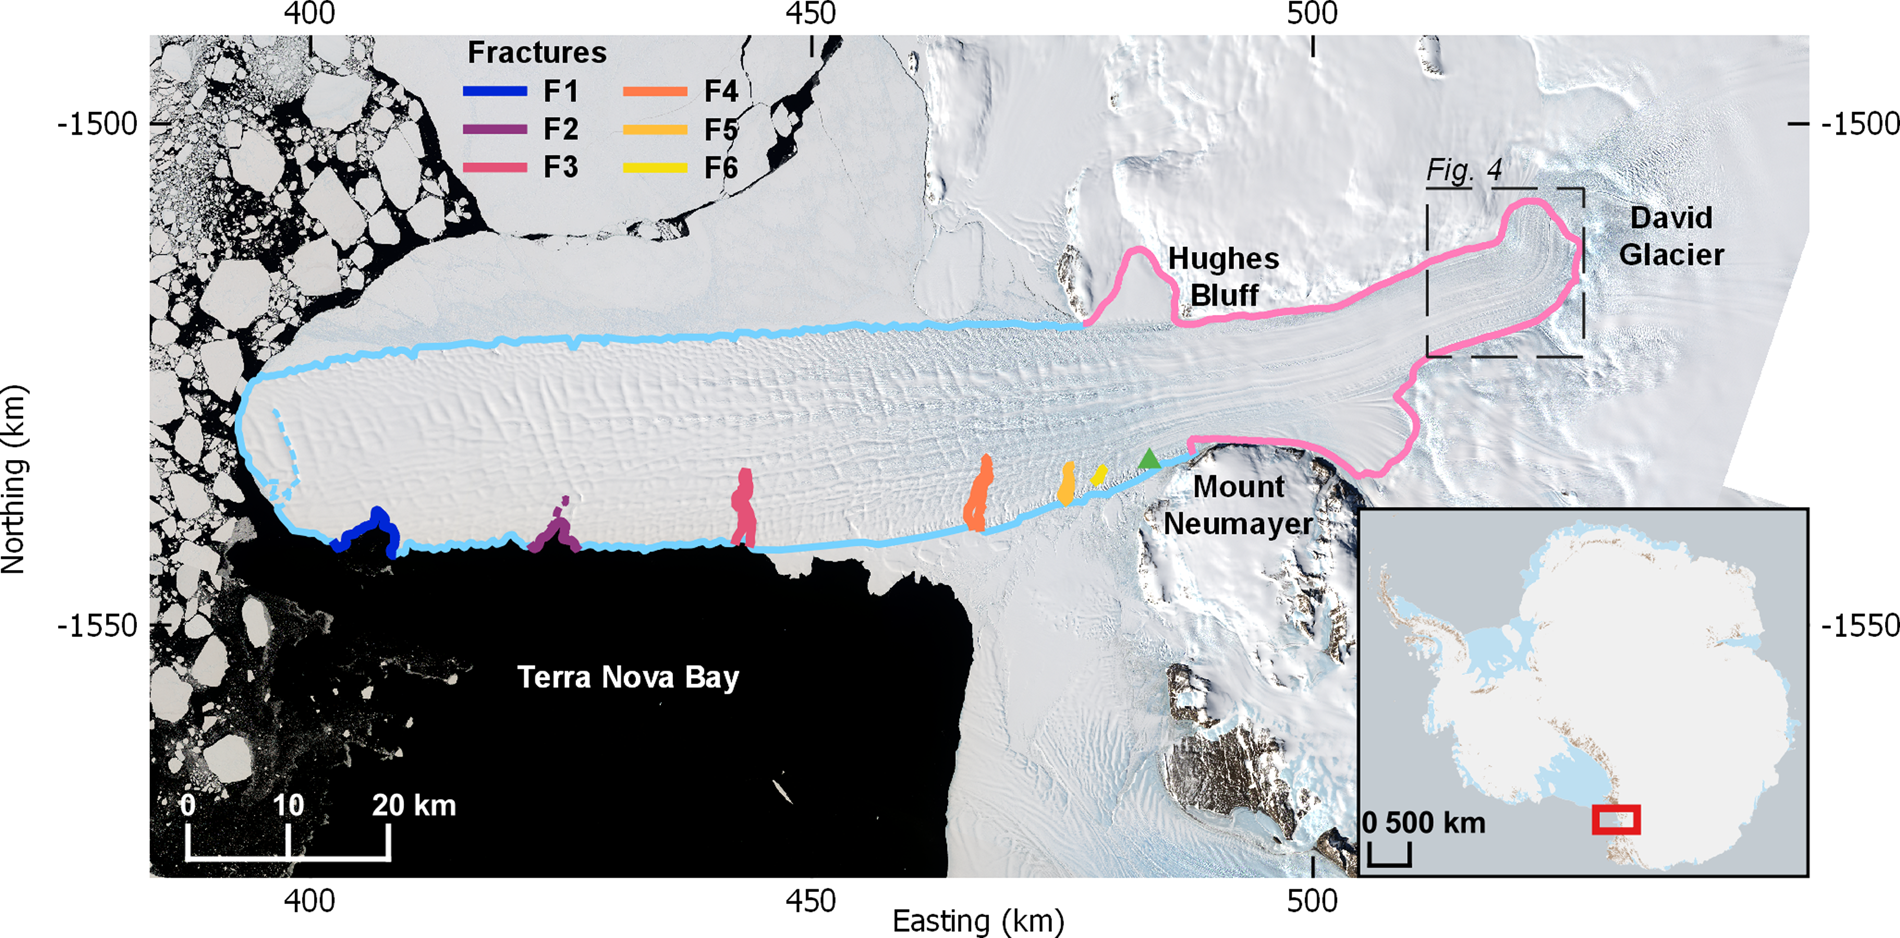
The Drygalski Ice Tongue is located in Victoria Land, East Antarctica (75.4°S, 163.5°E) and extends into the Ross Sea (Fig. 1). The tongue is fed by David Glacier, which is the largest glacier in the Victoria Land region (Frezzotti and others, Reference Frezzotti, Tabacco and Zirizzotti2000) draining an area of ~213 500 km2 of the interior East Antarctic Ice Sheet (Rignot and others, Reference Rignot2019). Two ice flows meet within the confines of the valley where the ice is floating: a thicker, faster southern flow from Dome C and a thinner, slower northern flow from Talos Dome (Frezzotti, Reference Frezzotti1993). Northward drifting sea ice is blocked by the ice tongue, building up on its southern side. The remaining sea ice flows past the calving front, contributing to the formation of the Terra Nova Bay polynya to the north of the ice tongue (Bromwich and Kurtz, Reference Bromwich and Kurtz1984; Frezzotti and Mabin, Reference Frezzotti and Mabin1994; Stevens and others, Reference Stevens2017), which between 2005 and 2010 ranged in size between 600 and 1000 km2 (Ciappa and others, Reference Ciappa, Pietranera and Budillon2012). MEaSUREs ice velocity data for the Drygalski Ice Tongue ranges from a minimum of ~460 m a−1 near the grounding line to a maximum of 720 m a−1 near the terminus (Rignot and others, Reference Rignot, Mouginot and Scheuchl2011b; Mouginot and others, Reference Wuite, Jezek, Wu, Farness and Carande2012; Rignot and others, Reference Rignot, Mouginot and Scheuchl2017). Using longitudinal radar profiles along the ice tongue, Tabacco and others (Reference Tabacco, Bianchi, Chiappini, Zirizzotti and Zuccheretti2000) and Bianchi and others (Reference Bianchi2001a, Reference Bianchi, Chiappini, Tabacco, Zirizzotti and Zuccheretti2001b) have revealed that the ice draft is highly variable along the flow direction. Here, we refer to these longitudinal variations in ice thickness as basal ripples following the terminology used by Bianchi and others (Reference Bianchi2001a, Reference Bianchi, Chiappini, Tabacco, Zirizzotti and Zuccheretti2001b).
Image showing the Drygalski Ice Tongue and David Glacier: the grounding line is shown in pink, with the outline of the unconfined section of the ice tongue in light blue. The dotted light blue line represents the rifting at the terminus. Fractures F1, F2, F3, F4, F5, and F6 are outlined along the northern margin of the ice tongue. The green triangle indicates the fracture formation zone, ~5 km downstream of where the ice tongue is no longer confined by valley walls, and is the area where we suggest fractures begin to form. The inset map of Antarctica with the red box indicates the study area. The dashed box indicates the location of Figure 4. Grounding line source: MEaSUREs Antarctic Grounding Line from Differential Satellite Radar Interferometry, Version 2 (Rignot and others, Reference Rignot, Mouginot and Scheuchl2011a; Rignot and others, Reference Rignot, Mouginot, Morlighem, Seroussi and Scheuchl2014; Rignot and others, Reference Rignot, Mouginot and Scheuchl2016). Image sources: Landsat 8 OLI/TIRS path 60 row 113, acquisition date: 23 December 2017; Landsat 8 OLI/TIRS path 61 row 114, acquisition date: 30 December 2017. Inset map source: Quantarctica Database.
The Drygalski Ice Tongue has experienced only two significant calving events since photographic and satellite observations began in the 1950s. The first calving event occurred between 1956 and 1957 resulting in a loss of 40 km of the ice tongue length (Frezzotti and Mabin, Reference Frezzotti and Mabin1994). The most recent calving event was comprised of three separate calving events occurring between February 2005 and March 2006. Here, we refer to these collectively as the 2005–06 calving event. In February 2005, 74.3 km2 of the front of the ice tongue calved off (Parmiggiani and Fragiacomo, Reference Parmiggiani and Fragiacomo2005). In April 2005, iceberg B-15 collided with the ice tongue, breaking off an additional 64.5 km2 leaving a narrow projecting tip (Wuite and others, Reference Wuite, Jezek, Wu, Farness and Carande2009). On 29 March 2006, iceberg C16 collided with the tongue, breaking off the remaining portion of the tip and creating an even calving front shape (MacAyeal and others, Reference MacAyeal2008). The total surface area lost during the 2005–06 calving events was almost 300 km2 (Wuite and others, Reference Wuite, Jezek, Wu, Farness and Carande2009).
2. Methods and data sources
2.1 Fracture identification
We used remote sensing imagery analysis to examine the location and temporal changes in the length of fractures in the ice tongue. Along the north side of the Drygalski Ice Tongue are six prominent fractures that persist or form throughout our imagery analysis period (1988–2020) (Figs 1, S1). Hundreds of small fractures and rifts fringe the ice tongue margin; we differentiate these from the six prominent fractures by requiring that fractures have propagated to a minimum length of 2 km. These prominent fractures become visible in the imagery several kilometers after the ice tongue has passed the coastline. We refer to this area as the fracture formation zone, indicated by the green triangle in Figure 1. We use imagery from Landsat 4 and 5 Thematic Mapper (TM), with 30 m resolution; Landsat 7 Enhanced Thematic Mapper Plus (ETM+) panchromatic band, with 15 m resolution; and Landsat 8 Operational Land Imager (OLI) and Thermal Infrared Sensors (TIRS) panchromatic band, with 15 m resolution. Scenes from November, December, or January were selected for each year, with total scene cloud cover below 32% (Table S1). All Landsat 7 scenes from 2003 to 2012 were affected by the Scan Line Corrector failure and have data gaps in the image. Multiple images were used for years where cloud cover or data gaps obscure a fracture in one image.
2.2 Ice draft, ice thickness, and surface elevation
To determine the role that ice thickness may play in fracture formation and propagation at the Drygalski Ice Tongue we derived high-resolution ice thickness by assuming hydrostatic equilibrium (Howat and others, Reference Howat, Porter, Smith, Noh and Morin2019). Source data for the surface elevation are from 2 m-resolution Reference Elevation Model of Antarctica (REMA) digital elevation model (DEM) strips (Table S3). The surface DEM was interpolated to 25 m resolution due to file size limitations for analysis and was converted from the WGS84 ellipsoid to the GL04c geoid. Following Van den Broeke and others (Reference Van den Broeke, Van de Berg and Van Meijgaard2008) we derived the ice thickness from this surface DEM using calculations of hydrostatic floatation (Fig. 2a).
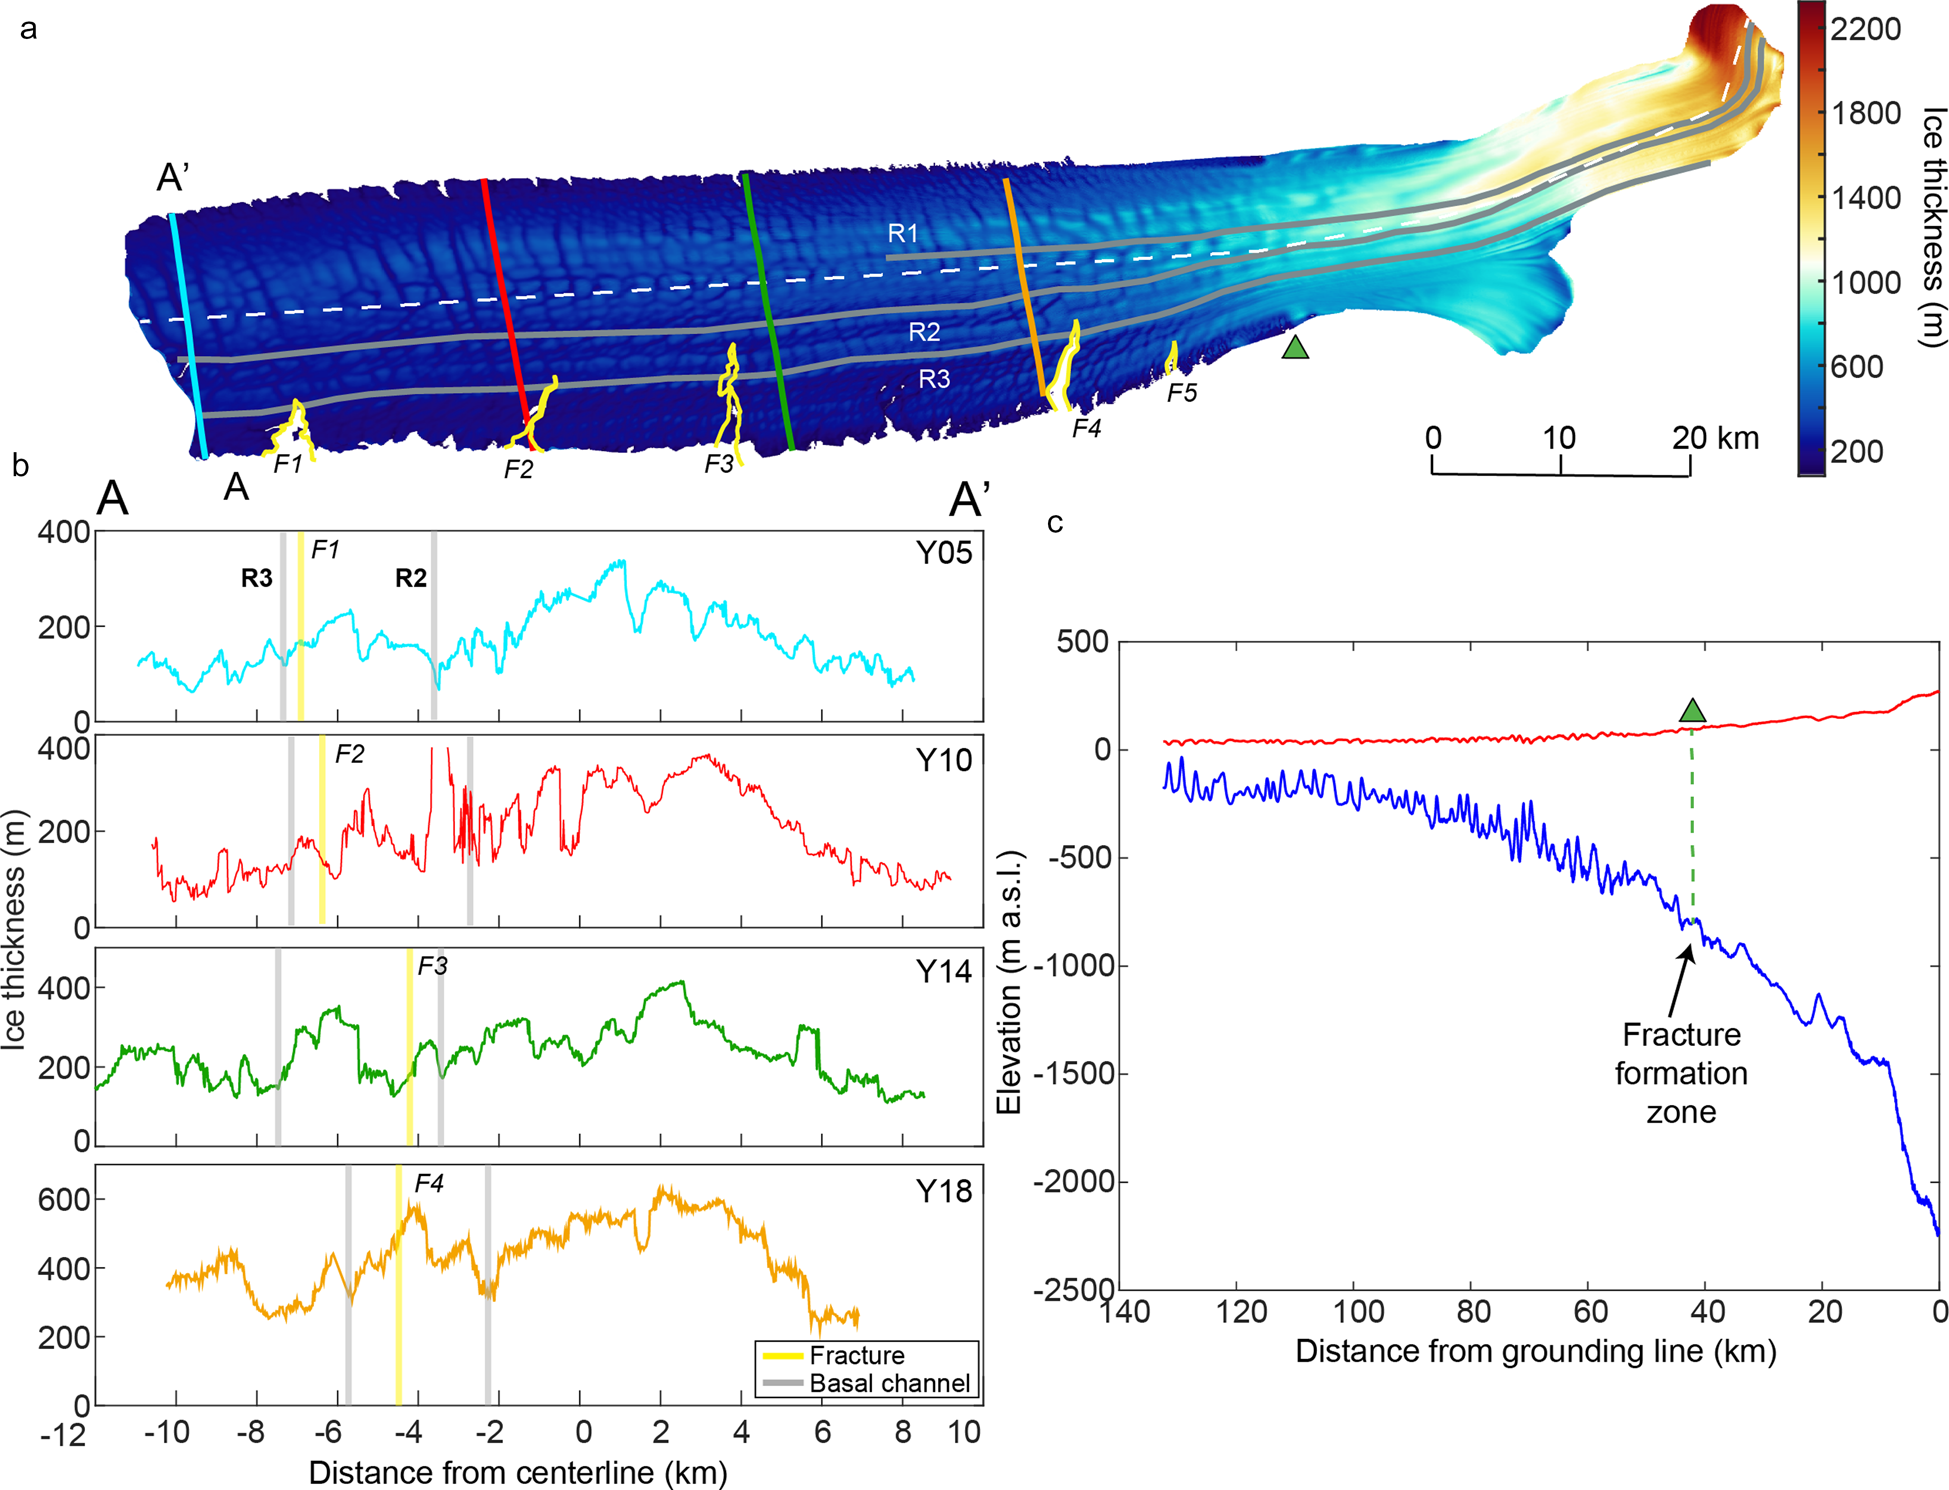
(a) Ice thickness DEM from hydrostatic ice thickness calculations. The fractures are outlined in yellow, the centerline from (b) with the white dashed line, and the basal channels in gray. (b) Radar-derived ice thickness profiles across the width of the Drygalski Ice Tongue. Locations of the transects are shown in (a). The positions of two basal channels are indicated by gray lines and the extrapolated position of the fracture tips by the yellow lines. (c) Surface elevation (m) and ice thickness (m) profiles along the length of the Drygalski Ice Tongue, from the grounding line (right) to the ice front (left). Data are extracted from the REMA surface DEM and our hydrostatic ice thickness calculations. The green triangle shows the fracture formation zone.
Firn thickness along the ice tongue is unknown, which likely introduces error in ice thickness calculations using hydrostatic equilibrium. To address this, we compare the ice thickness derived from REMA with airborne ice-penetrating radar and laser surface altimetry surveys that were acquired by the University of Texas Institute for Geophysics (UTIG) as part of the International Collaborative Exploration of the Cryosphere by Airborne Profiling (ICECAP) project in October 2011. These data provide ice thickness and surface elevation measurements for four transects across the width of the David Glacier and Drygalski Ice Tongue (Fig. S2, Table S2). The REMA strips were produced for surface elevations within 12 d of the radar acquisition, apart from one strip on line Y18, which was produced 84 d after the radar acquisition but was the closest available strip for that time period. As can be seen in Figure S2, the match between radar and REMA data is less consistent for line Y18, suggesting that on fast-moving ice tongues, it is necessary to collect coincident satellite data at the time of radar acquisition for accurate comparative analysis.
We estimate firn thickness for the Drygalski Ice Tongue by comparing the difference between radar-derived ice thickness and hydrostatically-derived ice thickness without firn correction (Δh) (Fig. S2). The resulting Δh values are interpolated along the ice tongue to adjust for firn in the ice thickness calculation. The Δh values range from 10 to 16 m. It should be noted that uncertainty in radar measurements due to the complexity of the ice draft will result in some error in the ice thickness measurement. Similarly, REMA ice thickness will include errors due to our assumption of hydrostatic equilibrium, which again with the complex draft is likely to cause differences from the true ice draft. Additionally, hydrostatically derived ice thickness within the confined section of the tongue will be less reliable due to buttressing from the marginal bedrock. However, for our analysis, we are interested in relative changes in ice thickness and how these might impact fracture propagation rather than absolute numbers and so these datasets are adequate for this analysis.
2.3 GlaDS model setup
We are interested in whether the variable draft we observe at Drygalski Ice Tongue is driven partially by the formation of basal channels. To assess this, we applied the GlaDS model to the David Glacier catchment to identify subglacial channel formation throughout the catchment and quantify channel discharge and positions at the grounding line. GlaDS is a 2D finite-element model used to examine the evolution of subglacial hydrological systems, with coupled efficient and inefficient systems that co-evolve over time. The inefficient system takes the form of a distributed sheet with linked cavities and is calculated over the model elements. The flux (q) through the distributed system is driven by the hydraulic potential gradient $\lpar \nabla \emptyset \rpar$ along with the system conductivity (k):

where α and β are parameters describing turbulent flow in the Darcy–Weisbach law, and h is the depth of the water. The distributed system exchanges water with the element edges where channels can form. These channels only develop if there is sufficient pressure gradient and water supply from the distributed system. Channels cross-sectional area (S) evolves due to potential energy dissipation (Ξ), sensible heat exchange (Π) and cavity opening and closure due to viscous ice creep (vc)

where ρi is the density of ice and L is the latent heat of fusion. This more-efficient channelized flow and the variable water pressure across the model domain means that the water routing and therefore locations of channelized outflow over the grounding line are likely more reliable than those estimated from hydraulic potential calculations, which assume water is everywhere at overburden pressure. Further details on GlaDS can be found in Werder and others (Reference Werder, Hewitt, Schoof and Flowers2013). The model has been applied to multiple Antarctic systems (Dow and others, Reference Dow, Werder, Nowicki and Walker2016, Reference Dow2018b, Reference Dow2020; Wei and others, Reference Wei2020).
The extent of the GlaDS model domain is determined by the catchment area draining into David Glacier, which was delineated in MATLAB using Antarctic Mapping Tools and TopoToolbox (Schwanghart and Scherler, Reference Schwanghart and Scherler2014; Greene and others, Reference Greene, Gwyther and Blankenship2017). The average edge length of the GlaDS mesh is 2801 m with refining at the grounding line giving a minimum edge length of 261 m. The grounding line used in this mesh is the InSAR-derived Antarctic grounding line (Rignot and others, Reference Rignot, Mouginot and Scheuchl2016). Bed and surface topography inputs for GlaDS are from BedMachine (Figs S3, S4) (Morlighem and others, Reference Morlighem2019). Bed elevations range from −1580 to 2230 m asl and surface elevations range from 150 m to 2740 m asl within the catchment area. Values of variable basal velocity and basal melt calculated from the Ice Sheet System Model (ISSM) following a model setup described by Seroussi and others (Reference Seroussi2019) were used in the GlaDS model runs. The ISSM basal melt were applied in GlaDS as a constant water source term for the basal drainage system. The ISSM basal velocity values were applied in the distributed system equations of GlaDS to calculate the rates of cavity opening and closure, which in turn determines how fast and to what extent those cavities can become pressurized. To calculate these values for GlaDS, the ice sheet model solved for ice temperature using an enthalpy method, assuming thermal steady-state based on modern geometry. Basal friction and ice flow speed were inferred using inverse modeling using InSAR derived surface velocities. More details are provided in Seroussi and others (Reference Seroussi2020, Appendix C, UCIJPL_ISSM).
We ran the model to steady-state over a period of 40 years. From this, model runs were initiated with varied parameters for an additional 10 years to test the sensitivity of the model. These nine sensitivity tests were focused on testing the impact of distributed system conductivity and channel conductivity, the primary parameters that can influence channel formation location and flux. See Table S4 for a list of the sensitivity tests.
2.4 Strain rate
To compare the locations of the prominent fractures and their formation zone with the ice tongue strain rates we used NASA's Global Land Ice Velocity Extraction from Landsat 8 (GoLIVE) velocities (Fahnestock and others, Reference Fahnestock2016; Scambos and others, Reference Scambos, Fahnestock, Moon, Gardner and Klinger2016) to calculate both the longitudinal and transverse horizontal strain rates along the Drygalski Ice Tongue. GoLIVE scenes were selected with full-coverage of the ice tongue, ensuring that the original Landsat 8 images were entirely cloud-free. The GoLIVE scene presented here calculates velocity between 19 October 2019 and 6 February 2020 with a separation of 112 d between the Landsat 8 images. Using this scene, we calculate the logarithmic horizontal strain rates following the method outlined by Alley and others (Reference Alley2018) using a length scale of two pixels (600 m). We have compared the results with other GoLIVE scenes of this region to confirm that the variability in strain rate is consistent and not due to noise in the velocity data.
3. Results
3.1 Fracture formation
Two fracture shapes can be identified along the length of the tongue: wide rifts, up to 4.6 km long (F1), and narrow fractures, up to 7 km long (F3, F4, F5, and F6) (Fig. 1). F2 consists of both a wide rift and continues into a narrow fracture. The narrow, long fractures appear to be aligned with surface ripples that stretch across the width of the ice tongue, perpendicular to the general flow direction. These ripples are dips of ~20 m on the surface with a separation amplitude of ~1700 m and are likely associated with basal crevasses that form at the grounding line due to bending stresses (McGrath and others, Reference McGrath2012). Fractures appear to form at ~75°16.5′S, 162°28.8′E (Fig. 1), several kilometers after the ice tongue begins to emerge into the open ocean, near Mount Neumayer, ~50 km from the grounding line. Early evolution analysis of F1, F2, and F3 is not possible due to the lack of satellite imagery during their formation periods. F1 was 3.9 km in length in 1999 and increased slightly to 4.6 km in 2018. By 2020, this length had reduced to 3.5 km due to small amounts of mass loss along the margin. F2 consists of both a visibly open rift and fracturing that may not have fully penetrated the entire thickness. (Figs 1, S1). The rift portion of F2 increased in length from 1.2 km in 1999 to 2.9 km in 2020, despite the minor mass loss along the margin between these dates. The fracture reduced in length from 5.7 km beyond the rift in 1999 to 3.8 km during this time, while the tip of the fracture did not propagate further. F3 had not propagated within this time period and remained 7 km long. In 1992, F4 was 1.45 km in length, and by 1999 had propagated towards the center of the ice tongue by 6.5 km (Fig. S5). From 1999 to 2020, the F4 fracture experienced <500 m propagation, reaching nearly the same length as F3.
The F5 fracture is first discernible in December 2008 at a position ~3.5 km down-ice from the area where fractures begin to form. Figure S6 shows the fracture starting to become discernible from the smaller, regular fractures on 20 December 2008 with a length of 1.8 km (left image), along with the fracture development, increasing in size to a length of 3.2 km and widening to a maximum of 615 m by 20 November 2018. The propagation of F5 is episodic over a number of years. F5 increased in length by 685 m from December 2008 to November 2009 and by 250 m from November 2009 to December 2010. Propagation then stalled until December 2013, at which point F5 propagated 1.45 km by December 2015. Since 2015 there has been no further propagation of F5. In December 2014, a new fracture (F6) began to become discernable at the fracture formation zone just over 2.5 km up-ice from F5. This new fracture has rapidly propagated, reaching a length of 4.5 km in 2020.
Along the center of the calving front are two small rifts incising inwards, visible in 2006 and expanding considerably by 2018. By March 2019 this rift reached a large ripple running parallel to the calving front, ~3.5 km away from the front, and fractured along it by 8 km (Fig. S7). This fracture is just 2 km away from reaching the southern edge of the ice tongue as of March 2020, indicating that a calving event may occur in the near future. A calving event along this rift would result in a loss of 38 km2 of ice.
3.2 Hydrostatic ice thickness and basal channels
Between the grounding line of the ice tongue and where it leaves the valley and becomes unconfined by land, ~50 km downstream, the ice thickness decreases from an average of 1828 to 705 m (Fig. 2b). In the open ocean, thinning continues until around the position of Y14, ~80 km from the grounding line where ice thickness is ~300 m on average. For the remaining ~55 km of the ice tongue, the average ice thickness remains relatively constant.
The ice thickness in the regions of F1–F5 is plotted in Figure 3. Each fracture tip ends in a thicker area of ice having propagated through thinner areas. F3 appears to only just be in a thicker region and is surrounded by thinner regions suggesting it may propagate further along these areas. The thickness is highly variable both in the longitudinal direction and the transverse direction. For the latter, the thinner areas are the basal ripples mentioned above. For the longitudinal direction, the thinner areas can mostly be traced back to the grounding line. Some of this variability may be due to differences in the thickness of ice flowing over the grounding line but we show that basal channel formation also likely plays a role.
Outlines of fractures 1–5 in 2011 plotted over hydrostatically derived ice thickness (m), calculated from REMA surface elevation data. Darker colors indicate higher ice thickness. F6 formed after the collection of the source data for REMA and is omitted from this figure. Fracture outlines follow the legend colors in Figure 1.

GlaDS model outputs predict multiple channels at the grounding line. As we do not know the basal conductivity of the subglacial system, we are not able to determine which sensitivity run output is the most likely. We plot all potential channels on Figure 4a and size by frequency of appearance in our model runs. We only include channels with a discharge >0.1 m3 s−1 and the plotted discharge represents the average from all of the sensitivity runs. Using this approach, there are three primary channels that appear in most sensitivity tests. The locations and discharges of the channels for each sensitivity test are listed in Table S5. The channel discharge for one sensitivity test (Model Run 5) is displayed in Figure S8.
(a) REMA surface elevation strips corrected to the local geoid (dates: 8 February 2012 and 8 October 2011). Grounding line channels modeled in GlaDS are plotted by size related to the frequency that they occur in the model sensitivity tests. The color of the channel circle is the average discharge from all of the sensitivity tests. The gray lines trace dips in the surface elevation associated with the grounding line channels as they are advected downstream. The pink line is the InSAR-derived Antarctic grounding line (Rignot and others, Reference Rignot, Mouginot and Scheuchl2016). The black line is the transect shown in (b). (b) Transect of REMA surface elevation values. The channel positions on the transect are noted with the gray dots.

Each of the three most frequently occurring channels lines up with a region where the surface elevation of REMA dips down, suggesting incision into the base of the floating ice from channel-driven plume activity. To demonstrate this, we plot a surface elevation transect with the channel locations determined by following the dips in the ice surface from the grounding line (Fig. 4b). The central channel (R1) has a large discharge of up to 5.1 m3 s−1 compared to the maximum discharges of 0.8 and 0.2 m3 s−1 for channels R2 and R3, respectively. Despite the difference in discharge, the resulting surface depressions can be traced tens of km downstream. Both R2 and R3 can be followed to the terminus of the ice tongue, but the central channel enters a region of complex topography and cannot be traced further than 75 km from the grounding line (Fig. 2a).
The locations of the channels are plotted along with the translated positions of the fractures on the radar transects (Fig. 2a) and REMA transects (Fig. S2). In both the radar and REMA datasets, fractures F1–F4 have propagated through the thin ice of channel R3 but have ceased to grow in the thicker ice between R3 and R2. F5 appears to have stopped propagating in a region of thicker ice prior to the first mapped channel and the newest fracture, F6, is still actively growing.
The height of the channels is difficult to determine because, particularly with confining valley walls nearby, it is unlikely that the hydrostatic calculations are correct near to the grounding line. From the surface elevation dips, however, the features appear to be several hundred meters wide. The radar data from line Y18 show thinner ice in the same region as REMA, and indicate that R3 and R2, between which fracture F4 has stalled, are 890 m wide, 250 m high, and 135 m wide, 160 m high.
3.3 Strain rates
We plot strain rates in the longitudinal (Fig. 5a) and transverse (Fig. 5b) directions to assess where fractures are likely to form and the drivers for fracture propagation. For each of these maps, extensional strain rates are shown in blue and compressional strain rates in red. Beginning with the longitudinal strain rates, ice from the southern lobe over the grounding line is generally compressed with more extension from the northern ice lobe. As the tongue passes beyond the pinning points, there is an enhanced longitudinal extension. Further downstream, patterns of alternating extension and compression are evident and are spatially consistent with the presence of the basal ripples. Towards the terminus, although this alternating pattern persists, there is no increase in the extensional strain rates compared to the remainder of the ice tongue.
Strain rates in the (a) longitudinal and (b) transverse directions. The fractures are plotted following the legend colors in Figure 1.

The transverse strain map (Fig. 5b) shows strong extensional patterns from the lateral expansion of ice as it passes beyond the valley walls into the open ocean. Most of this extension occurs to the north, potentially due to the thinner ice in this region. As a result, on the northern side, the marginal flow features are pulled obliquely to the primary ice flow direction at the point of unpinning. Several stripes of compression and extension can be observed along the length of the ice tongue. When compared with the REMA thickness DEM (Fig. 2a), longitudinal stripes of thicker ice generally correspond with regions of extension and stripes of thinner ice with compression. Within 12 km of the terminus, these down-glacier stripes of extension and compression become less clear although this may be due to noise in the velocity dataset (Fig. 5b).
4. Discussion
Multiple fractures exist along the northern side of the Drygalski Ice Tongue, some of which propagate more than 2 km into the ice tongue. The fractures appear to form as the ice emerges from the confinement of valley walls. Similar to Mertz Glacier tongue (Lescarmontier and others, Reference Lescarmontier2015), the Drygalski Ice Tongue swings horizontally and this could play a role in fracture formation (Lee and others, Reference Lee, Seo, Seo, Scambos and Ross2013). With external forcing such as an iceberg collision or a storm (Frezzotti and Mabin, Reference Frezzotti and Mabin1994; Frezzotti, Reference Frezzotti1997; Wuite and others, Reference Wuite, Jezek, Wu, Farness and Carande2009), the horizontal motion may increase allowing some fractures to propagate further into the ice.
The prominent fractures all terminate in a zone of thicker ice, between two basal channels (R2 and R3; Figs 2a, 3). The fractures that have propagated furthest into the ice have intersected basal ripples of thinner ice running across the width of the ice tongue. F2, F3 and F4 all extend >5 km into the ice along the apex of basal ripples, whereas F1 and F5 are situated between basal ripples and extend < = 4.6 km.
A new rift along the calving front edge began propagating inwards in 2019 extending 1.5 km into the front of the ice tongue until it connected with one of the basal ripples with the thickness of ~100 m (Fig. S7). The fracture then rotated 90° and propagated southwards along the basal ripple for an additional 8 km. This suggests that the ability of fractures to propagate inwards is driven by complex ice draft morphology consisting of thicker keels of ice along the length of the tongue, which impede fracture propagation, and numerous smaller ripples across the width of the tongue, which enhance it.
Other factors could influence fracture growth, so we plot strain rates to examine longitudinal and transverse controls on extension and compression. In the fracture formation zone, the strain rates are predominantly extensional related to the lateral expansion of ice as it flows past the confining valley walls. Further downstream, the transverse strain rate map shows stripes of alternating compression and extension along the length of the ice tongue that align with thinner and thicker ice. This pattern has also been identified for ice shelf basal channels and is due to the surface expression of depressed surface ice above the channel ridges and raised ice above the keels (Vaughan and others, Reference Vaughan2012; Dow and other, Reference Dow2018a). The longitudinal strain rate pattern is important for examining controls on transverse fracture expansion. The most recent observable fracture, F6, forms in an area of strong extension in both the longitudinal and transverse directions. The persistent appearance of fractures in this region suggests consistent extensional strain in this area directly driving fracture formation. The remainder of the longitudinal strain rate pattern is relatively noisy until approaching the terminus where the ripples begin to show as alternating bands of extension and compression stretching across the width of the tongue. However, the extensional strain rates do not increase towards the terminus and therefore are unlikely to be the driver that reinitiates fracture propagation.
Another possibility for slowing or preventing the growth of fractures are differences in ice rheology. Bands of marine ice in suture zones have been identified at the Larsen C Ice Shelf (Jansen and others, Reference Jansen, Luckman, Kulessa, Holland and King2013; Borstad and others, Reference Borstad, McGrath and Pope2017), Ronne Ice Shelf (Hulbe and others, Reference Hulbe, LeDoux and Cruikshank2010) and Amery Ice Shelf (Walker and others, Reference Walker, Bassis, Fricker and Czerwinski2015) and are argued to slow fracture propagation relative to rates in meteoric ice. Marine ice has previously been hypothesized to accrete on the base of the Drygalski Ice Tongue where the ice tongue becomes unconfined (Frezzotti, Reference Frezzotti1993, Reference Frezzotti1997). However, flux gate analysis by Wuite and others (Reference Wuite, Jezek, Wu, Farness and Carande2009) suggests basal freeze-on occurs only in a region ~10 km upstream of the fracture formation zone and otherwise, basal melt dominates. The latter pattern is also suggested by conductivity-temperature-depth profiles collected around the ice tongue with the only profile showing supercooled water located on the southern side next to the fracture formation zone (Stevens and others, Reference Stevens2017). All the profiles on the northern side were warmer than profiles on the southern side and, given that the local oceanic circulation is generally driving water northwards, implies limited basal freezing under the portion of the Drygalski Ice Tongue in the open ocean (Stevens and others, Reference Stevens2017). Fracture propagation rates also suggest that marine ice is either not present or does not inhibit the fracture processes. Analysis of F5 shows episodic propagation on the scale of several years, with fracturing during 2008–10, followed by stagnation from 2010 to 2013, and another episode of propagation from 2013 to 2015. We compare the annual location of the F5 fracture tip location with the hydrostatic thickness data and the stagnation periods appear to coincide with times that the fracture tip is in thicker ice (Fig. S9). In contrast, the fracture jumps over the thinner bands of ice in less than a year. Marine ice would be more likely to accumulate in the regions of the higher basal draft where supercooling would be most pronounced (Bassis and Ma, Reference Bassis and Ma2015), but as F5 does not slow down or stagnate in these regions it implies ice rheology is not inhibiting the expansion of this fracture. If marine ice were present it would support the hypotheses of De Rydt and others (Reference De Rydt, Gudmundsson, Nagler, Wuite and King2018) and King and others (Reference King, De Rydt and Gudmundsson2018), that marine ice can speed up fracture propagation rather than slow it down.
Our evidence suggests that the ice strain plays a strong role in the initial formation of fractures, but the ice thickness is the most important factor controlling fracture propagation at Drygalski Ice Tongue, agreeing with studies conducted at the nearby Nansen Ice Shelf (Dow and others, Reference Dow2018a). This fracture analysis also ties in with that of Frezzotti (Reference Frezzotti1993) who suggested the limited fractures on the southern side of the ice tongue compared to the northern side is due to the presence of thicker ice. In the fracture formation zone this is an average of 750 m vs. 682 m thick for the southern and northern sides, respectively, due to different bodies of ice converging at the grounding line. However, Frezzotti (Reference Frezzotti1993) also suggested that the formation and growth of the northern fractures are due to differential velocity of northern and southern ice lobes causing variability in longitudinal strain rates. While our strain rate mapping indicates that longitudinal strain plays a role, it is due to the stretching of ice to the north as opposed to differential ice body velocity that drives fracture formation. Indeed, the velocity of the ice bodies equalize within several kilometers of the grounding line once the ice begins to float.
Although it maintains a thicker profile on the southern side, in general, the thickness of the ice tongue decreases where it is no longer confined by valley walls and flows into the open ocean. This thinning continues until ~80 km from the grounding line, around the location of radar transect line Y14. At this position, the tongue persists with an average ice thickness of ~300 m. As the ice thickness appears to plays a strong role in how far fractures can propagate across the ice tongue, the uniform ice thickness over a distance of ~55 km, maybe key for maintaining the substantial length of the Drygalski Ice Tongue. The ice thins in the last couple of kilometers of the terminus (Fig. 2a) and it is likely this contributed to the fracture propagation that caused the two major calving events since the 1950s.
The cause for transverse ice tongue thickness variability that we demonstrate impacts the rate of ice fracturing and the eventual cessation of fracture expansion can be primarily traced back to the grounding line. As illustrated by our model outputs compared with our estimates of ice tongue draft, several of the longitudinal features appear to be basal channels, formed due to subglacial discharge over the grounding line. The concentrated flux of fresh water into the ocean cavity can drive fresh water plumes, entraining warm ocean water, causing enhanced melting of the ice draft (Jenkins, Reference Jenkins2011). This process can form basal channels that are advected along the length of the ice tongue and have been identified elsewhere, for example at the Filchner-Ronne Ice Shelf in West Antarctica (Le Brocq and others, Reference Le Brocq2013) and with the application of GlaDS to the Getz Ice Shelf in West Antarctica (Wei and others, Reference Wei2020). At the Drygalski Ice Tongue, although the central grounding line channel produces substantially higher discharge than the other two channels that we describe, they appear to have similar dimensions. A larger basal channel would be expected for larger discharge, however, its size may be inhibited by thicker ice along the southern half of the ice tongue. The link between subglacial hydrological drainage and floating ice channel formation suggests that upstream processes from grounded ice could have a significant impact on the downstream ice draft and the propagation rates of fractures.
The relationship between fracture propagation, ice thickness and the drivers for variable ice morphology that we have identified for the Drygalski Ice Tongue can be applied to other floating ice bodies. Although temporal and spatial variability in strain rates will be more pronounced in bounded ice shelves, regions of thinner ice will still be more susceptible to fracturing. As more data are gathered, the role of basal channels in impacting ice stability is becoming clearer. At the nearby Nansen Ice Shelf, the thinner ice of its basal channel allowed the formation of multiple fractures (Dow and others, Reference Dow2018a) and, in contrast, at the Drygalski Ice Tongue, the thicker ice between channels prevents fracture propagation across the ice tongue, contributing to the maintenance of its significant length. Ocean conditions around the Antarctic are changing with the upwelling of circumpolar deep water now accessing many ice shelf cavities (Bindoff and others, Reference Bindoff, Rosenberg and Warner2000; Jenkins and others, Reference Jenkins2010; Martinson and McKee, Reference Martinson and McKee2012), and data show that Drygalski itself is also thinning due to ocean warming (Paolo and others, Reference Paolo, Fricker and Padman2015). As such, determining the role of ice morphology in fracturing is important for estimating the future stability of floating ice bodies.
5. Conclusions
The Drygalski Ice Tongue in East Antarctica is 140 km long, with 90 km of this extending unconfined into the Ross Sea. The ice tongue has important implications for the surrounding area, influencing the local ocean and contributing to the formation of the Terra Nova Bay Polynya. The ice tongue is relatively stable, with two large calving events occurring with a period of ~50 years between, in 1956–57 and in 2005–06. The unconfined section has six large, regularly spaced fractures along the north side of the tongue. We find that the fractures that propagate more than 4.5 km into the ice tongue run along the thinner ice of basal ripples that run transversely across the ice tongue. These basal ripples are potentially caused by basal crevassing at the grounding line. The ice tongue also has longitudinal stripes of thick and thin ice. Fractures lengthen rapidly in regions of thin ice and cease propagating once in thicker ice, limiting them to expand only ~7 km into the ~20 km-wide ice tongue. We examined the cause of these longitudinal thickness variations and traced them back to the grounding line. In several regions, the thinner ice lines up with the location of subglacial channel outlets over the grounding line, which we modeled using the GlaDS model to simulate subglacial water flow throughout the David Glacier catchment. It is therefore likely the flux from the subglacial system drives buoyant plumes of fresh water which forms basal channels in the floating ice tongue. The position where the fractures stop propagating is in the thick ice between two of these basal channels.
The thickness of the ice tongue is ~300 m for the last 55 km of its length and it is likely this approximately uniform thickness contributes to the substantial length of the ice tongue, as the ice does not thin sufficiently to allow further fracture propagation. Only once ice thins in the last couple of kilometers at the terminus can the marginal fractures propagate through and cause large calving events. This demonstrates the important role that floating ice morphology has on the stability of ice bodies and suggests that changes in the ice draft due to alterations in ocean conditions could have important implications for future calving events of the Drygalski Ice Tongue and other floating ice bodies.
Supplementary material
The supplementary material for this article can be found at https://doi.org/10.1017/jog.2020.99
Acknowledgements
C Dow was supported by the Natural Sciences and Engineering Research Council of Canada (RGPIN-03761-2017) and the Canada Research Chairs Program (950-231237). Radar data acquisition was the result of the ongoing ICECAP collaboration with support from NSF grants PLR-0733025 and PLR-1143843, NASA grants NNG10HPO6C and NNX11AD33G (Operation Ice Bridge and the American Recovery and Reinvestment Act), NERC grant NE/D003733/1, the G. Unger Vetlesen Foundation, and the Jackson School of Geosciences. We thank the Korean Polar Research Institute (KOPRI) and the University of Texas Institute for Geophysics (UTIG) for their support of this project in gathering ice radar and surface altimetry data over David Glacier used for BedMachine. Research grants from the Korean Ministry of Oceans and Fisheries (KIMST20190361; PM19020) and KOPRI(PE19110) supported these data collection. This is UTIG contribution 3691. We thank Mauro Werder for the use of the GlaDS model and Sue Cook for helpful comments on the manuscript. Finally, we thank the editor and three anonymous reviewers for their constructive comments.


 Open access