

1 Introduction
The COVID-19 pandemic created large-scale changes throughout the world, disrupting society, the economy, culture, and ecology in profound, potentially incalculable ways. On a daily level, individuals in many countries have been forced to radically alter their daily routines in an effort to limit the virus’ spread – abandoning all non-essential activities, working from home, limiting travel and interactions with their loved ones, sanitising their hands, and practising social distancing (Calbi et al., Reference Calbi, Langiulli, Ferroni, Montalti, Kolesnikov, Gallese and Alessandra Umiltà2021). Perhaps one of the biggest changes for many people in their daily lives has been that they now need to wear face masks when around others (Spitzer, Reference Spitzer2020; Mehta et al., Reference Mehta, Venkatasubramanian and Chandra2020; Leung et al., Reference Leung, Lam and Keung Cheng2020). In part to help mobilise public support for this vital but often unpopular safety precaution (Betsch et al., Reference Betsch, Korn, Sprengholz, Felgendreff, Eitze, Schmid and Böhm2020; Taylor and Asmundson, Reference Taylor and Asmundson2021), but also to stay safe and healthy themselves, many politicians across the world have worn face masks during the pandemic when appearing in public (Larchenko, Reference Larchenko2020), such as at news conferences or campaign events.
To what extent has this practice affected public perceptions of politicians?Footnote 1 To our knowledge, we are the first to examine the potential effects of masks on public perceptions of politicians. This is an important emergent global issue, given that the COVID-19 pandemic dramatically affected everyday life throughout the world and many medical experts predict that similar outbreaks will be likely in the decades to come. It is also relevant to prior work on public support for candidates. A large, cross-disciplinary literature suggests that appearance influences all sorts of life outcomes, such as economic success (Mulford et al., Reference Mulford, Orbell, Shatto and Stockard1998) and psychological well-being (Gupta et al., Reference Gupta, Etcoff and Jaeger2016). In political science, a smaller but growing vein of work supports these general findings and shows that the voters might rely heavily on candidate appearance when determining whom to support at the ballot box (Olivola and Todorov, Reference Olivola and Todorov2010). For example, politicians who look more competent (Atkinson, Reference Atkinson2009; Albright et al., Reference Albright, Dong, Fang, Malloy, Kenny, Winquist and Yu1997; Ballew and Todorov, Reference Ballew and Todorov2007; Lawson et al., Reference Lawson, Lenz, Baker and Myers2010; Lenz and Lawson, Reference Lenz and Lawson2011; Praino et al., Reference Praino, Stockemer and Ratis2014; Todorov et al., Reference Todorov, Mandisodza, Goren and Hall2005) or attractive tend to receive more votes (Banducci et al., Reference Banducci, Karp, Thrasher and Rallings2008; Berggren et al., Reference Berggren, Jordahl and Poutvaara2010; King and Leigh, Reference King and Leigh2009; Rosar et al., Reference Rosar, Klein and Beckers2008; Stockemer and Praino, Reference Stockemer and Praino2015; Stockemer and Praino, Reference Stockemer and Praino2017). As we argue below, face masks could influence perceptions of candidate appearance in several ways, thus influencing public support and other attitudes toward candidates. In line with Lemi and Brown (Reference Lemi and Brown2019), we also argue that the link between appearance and voter attitudes is likely conditioned by candidate gender, and that the potentially negative effects of face masks are more profound for women than men politicians.
We investigate the degree to which facial masks influence public perceptions of politicians, on average and across politician gender, in Japan, a country where people – though not politicians – often wore face masks before the novel coronavirus outbreak (Han et al., Reference Han, Tan, Turk, Sridhar, Leung, Shibuya, Asgari, Oh, Garca-Basteiro and Hanefeld2020). Conducting a survey experiment with a nationally representative sample of about $1500$
Japanese residents, we find that masks matter to public perceptions and that women politicians lose more public support when wearing masks than men. Our experimental design allows us to investigate several possible mechanisms that might lead to this disadvantage for women. Surprisingly, we find that women politicians receive less support even though wearing masks does not decrease public perceptions of possible mediators, such as their attractiveness, competence, intelligence, trustworthiness, or strength. In other words, it is not immediately clear what drives this decreased support. Given the nature of political campaigns in the post-COVID-19 world, we think that our results suggest the need for more work in this area and have broad implications for how we think about the link between candidate appearance and voter attitudes, politics and gender, and women politicians competitiveness.
$1500$
Japanese residents, we find that masks matter to public perceptions and that women politicians lose more public support when wearing masks than men. Our experimental design allows us to investigate several possible mechanisms that might lead to this disadvantage for women. Surprisingly, we find that women politicians receive less support even though wearing masks does not decrease public perceptions of possible mediators, such as their attractiveness, competence, intelligence, trustworthiness, or strength. In other words, it is not immediately clear what drives this decreased support. Given the nature of political campaigns in the post-COVID-19 world, we think that our results suggest the need for more work in this area and have broad implications for how we think about the link between candidate appearance and voter attitudes, politics and gender, and women politicians competitiveness.
2 Theory
Ambady and Rosenthal (Reference Ambady and Rosenthal1992) show that many people engage in ‘thin-slicing’ when making decisions. They make sense of the world through thin moments, or narrow windows, of personal experience. This often means that they make conclusions based on minimal amounts of information. When it comes to interpersonal interactions, this often means that people make judgements about others – their values (Schmidt, Reference Schmidt2007), their economic status (Kraus and Keltner, Reference Kraus and Keltner2009), their psychology (Naumann et al., Reference Naumann, Vazire, Rentfrow and Gosling2009) – based on how they appear (Bar et al., Reference Bar, Neta and Linz2006).
With this tendency in mind, we should expect that face masks influence public perceptions of politicians for at least two reasons. One has to do with how facial coverings distort how people perceive the emotional states of those who wear them. Prior work shows that both the upper and lower halves of the face, especially the eyes and the mouth, convey emotions (Blais et al., Reference Blais, Roy, Fiset, Arguin and Gosselin2012; Eisenbarth and Alpers, Reference Eisenbarth and Alpers2011; Nusseck et al., Reference Nusseck, Cunningham, Wallraven and Bülthoff2008; Schurgin et al., Reference Schurgin, Nelson, Iida, Ohira, Chiao and Franconeri2014; Smith et al., Reference Smith, Cottrell, Gosselin and Schyns2005; Wegrzyn et al., Reference Wegrzyn, Vogt, Kireclioglu, Schneider and Kissler2017). People tend to recognise others’ happiness by reading mouth expressions, while they read others’ eyes for evidence of sadness, disgust, or fear (Wegrzyn et al., Reference Wegrzyn, Vogt, Kireclioglu, Schneider and Kissler2017). One consequence of this is that when people can only see the upper part of a person’s face, viewers are much more likely to perceive that the object of their sight is expressing negative emotions instead of positive emotions (Fischer et al., Reference Fischer, Gillebaart, Rotteveel, Becker and Vliek2012). In line with this, on the one hand, studies have shown that some facial coverings, particularly Islamic veils or headdresses, cause individuals to perceive their wearers as feeling or expressing more negative emotions than they actually do (Kret and de Gelder, Reference Kret and de Gelder2012; Kret and Fischer, Reference Kret and Fischer2018). On the other hand, some work has found a minimal or null effect of facial coverings and perceptions of emotional states. Calbi et al., (Reference Calbi, Langiulli, Ferroni, Montalti, Kolesnikov, Gallese and Alessandra Umiltà2021), for example, shows that people correctly recognised the individual facial expressions and emotions of Italian women, even when the lower part of their faces was covered with a mask or scarf.Footnote 2 While the evidence is somewhat mixed on the effect of face coverings on public perceptions of wearers’ emotional states, it seems to suggest on balance that masks distort these perceptions in a negative way. This is important for our study because voters sometimes rely on perceptions of politician’s emotional states when deciding for whom to vote, particularly when they have little other information about the candidates, typically favouring more positive states to negative ones (Koo, Reference Koo2020).
A second reason why face masks might influence public perceptions relates to how they change the perceived attractiveness of their wearers. An expansive, cross-disciplinary literature on the ‘beauty effect’ (Biddle and Hamermesh, Reference Biddle and Hamermesh1998) suggests that how people see you plays a key role in a wide range of life outcomes, including economic success (Mulford et al., Reference Mulford, Orbell, Shatto and Stockard1998) and psychological well-being (Gupta, Etcoff, and Jaeger, Reference Gupta, Etcoff and Jaeger2016). Looks matter in politics, too. We know that candidates who appear more attractive are more likely to win elections (Atkinson, Reference Atkinson2009; Albright et al., Reference Albright, Dong, Fang, Malloy, Kenny, Winquist and Yu1997; Ballew and Todorov, Reference Ballew and Todorov2007; Banducci et al., Reference Banducci, Karp, Thrasher and Rallings2008; Berggren et al., Reference Berggren, Jordahl and Poutvaara2010; Hayes et al., Reference Hayes, Lawless and Baitinger2014; King and Leigh, Reference King and Leigh2009; Lawson et al., Reference Lawson, Lenz, Baker and Myers2010; Lenz and Lawson, Reference Lenz and Lawson2011; Praino et al., Reference Praino, Stockemer and Ratis2014; Rosenberg et al., Reference Rosenberg, Bohan, McCafferty and Harris1986; Rosar et al., Reference Rosar, Klein and Beckers2008; Stockemer and Praino, Reference Stockemer and Praino2015; Stockemer and Praino, Reference Stockemer and Praino2017; Todorov et al., Reference Todorov, Mandisodza, Goren and Hall2005), particularly when candidates have little information about them (Ahler et al., Reference Ahler, Citrin, Dougal and Lenz2017). While there is scant research on how facial masks influence perceptions of attractiveness, the little work done in the area (Miyazaki and Kawahara, Reference Miyazaki and Kawahara2016) supports the oft-heard public concern that the coverings make people seem less appealing to others.
Taken together, the literature suggests that individuals who wear face masks might be more likely to appear (a) negative and (b) unattractive. This logic leads us to our Mask Hypothesis.
Mask Hypothesis: The public will be less likely to positively evaluate politicians who wear face masks.
We can imagine that the effect of mask-wearing is different for men and women politicians. Women have been historically underrepresented at every level of political office. This is because they generally face many more difficulties running for, obtaining, and being re-elected to political office than men (Paxton et al., Reference Paxton, Kunovich and Hughes2007; Waylen, Reference Waylen1994; Yoon, Reference Yoon2001). For example, women candidates must provide substantial evidence of their qualifications, while men candidates often face little pressure to display their fitness for political leadership roles (Bauer, Reference Bauer2020). It can be difficult for women to establish those qualifications, though, since many people believe that women do not have either the temperament or capability to participate in politics, let alone run for office (Pateman, Reference Pateman1989). In addition, people generally assume that leadership is a masculine trait, discounting its presence or strength among women. Related to that, people tend to evaluate autocratic modes of leadership by women more negatively than the same behaviour by men (Eagly et al., Reference Eagly, Makhijani and Klonsky1992).
Women experience not just differential expectations about their qualifications but also about their emotions and appearance, two attributes that wearing masks might change. Regarding emotions, Koo (Reference Koo2020) shows that voters have higher expectations that women politicians appear positive than men and, consequently, smile more. If women politicians wear masks, we cannot (of course) see their smiles (except perhaps in their eyes), which means that they will be seen in a less positive emotional state than if they did not don coverings. The importance of portraying a positive emotional state is not lost on women politicians, who are less negative than men in how they present themselves in political debates (Boussalis et al., Reference Boussalis, Coan, Holman and Müller2021) and on social media (Barnes et al., Reference Barnes, Crabtree, Matsuo and Ono2021), among other venues.
In terms of appearance, an abundance of studies show that women face higher standards than men in nearly every aspect of life. This appears to be particularly true in politics, where women politicians often must be more attractive than men candidates (Olivola and Todorov, Reference Olivola and Todorov2010). For example, King and Leigh (Reference King and Leigh2009) show that, in the 2004 Australian election, ‘the average female candidate was at the 70th percentile of the beauty distribution, while the average male candidate was at the 43rd percentile of the beauty distribution’ (584). Considering that, and our earlier discussion about attractiveness, it seems clear that if wearing masks diminishes how pleasant women candidates appear, they will pay a greater price for this than their men counterparts. Based on this logic, we posit the Woman Mask Hypothesis.
Woman Mask Hypothesis: The public will be less likely to positively evaluate politicians who wear face masks. This negative effect will be stronger for women candidates than for men.
3 Research design
To test our two hypotheses, we fielded a survey experiment in Japan from August 27–28, 2020, using Lucid Marketplace, an online survey platform that is becoming an increasingly popular tool for social scientists to conduct research (Coppock and McClellan, Reference Coppock and McClellan2019). We consider Japan a hard case to test our theoretical expectations. Historically, face masks have been very common in Japanese daily life. We can imagine that this means the penalty for wearing them will be lower in Japan than in other places. In other words, when masks are seen as less common – in either place or time – the penalty for politicians wearing them will likely be higher.
In addition, both politicians and members of the public in Japan generally understand the importance of wearing masks. We would expect that when masks are viewed as less necessary, which might be different from when they are less common (i.e. they can be both very necessary and not all that common, as in the early days of COVID in the United States), the penalty for politicians wearing them will also likely be higher.
That said, we do wish to note that the gender dynamics in Japan might make finding a difference in effects across men and women more likely than in other places. As has been extensively documented at this point (Crabtree and Muroga, Reference Crabtree and Muroga2021; Crabtree and Mcclean, Reference Crabtree and Mcclean2024; Muroga and Crabtree, Reference Muroga and Crabtree2020), women professionals, including elected office holders and candidates, face different expectations than men in Japan. This might matter in the context of our experiment because women in Japan tend to be evaluated more for their looks than men. Face tends to obscure appearance. To the extent that this is true, we might expect women politicians to suffer more for this in Japan than elsewhere (Golder et al., Reference Golder, Crabtree and Dhima2019).
We paid each respondent $1.50 to complete the survey, which took respondents about 7.5 minutes to complete (median = 447 seconds). This means that we paid each respondent roughly $12 an hour, or about 150% of the Japanese minimum wage at the time of this study. We think that this amount should have incentivised careful work, in addition to providing an ethical reward.
To collect a reasonably representative sample of adults across Japan, we constructed our sample using demographic quotas with respect to respondents’ age (18–29, 30–39, 40–49, 50–59, 60–74), sex (male, female), and region (Chugoku, Chubu, Hokkaido, Kinki, Kanto, Kyushu, Shikoku, Tohoku).Footnote
3
Shortly after respondents agreed to participate in our survey, we asked them to answer an attention-check question about the weather and filtered out those who responded inaccurately.Footnote
4
The total number of respondents who answered this question correctly and then completed the survey is $1508$
.Footnote
5
$1508$
.Footnote
5
Prior to presenting respondents with our survey experiment, we asked them 3 sets of questions. These include (1) standard socio-demographic questions (gender, race/ethnicity, education, age, place of current residence, and income), (2) a small battery of questions about their attractiveness, and (3) several questions designed to assess their political knowledge. We asked these 3 sets of questions in random order to reduce the possibility that respondents’ answers to them affected the way in which they read the treatment materials and answered our outcome questions.
After the main experimental component, which we explain next, we asked an open-ended question where respondents were prompted to tell us what they thought about the role of beauty in politics. We then asked them to identify the country from which the politicians shown in the survey experiment came. We use these two questions as additional attention checks. Crucially, our results are substantively similar if we only examine responses from individuals who successfully pass these checks. These findings should be interpreted with caution, though, since respondent answers are recorded post-treatment, and conditioning on them could bias our estimates (Montgomery et al., Reference Montgomery, Nyhan and Torres2018). Finally, we debriefed respondents.
As mentioned above, our survey contains an experiment. In it, we told respondents that we wanted their opinion about a couple of politicians. We then asked them to evaluate two of these four currently serving Japanese politicians with national reputations: Shinzo Abe, the Prime Minister at the time;Footnote 6 Satsuki Katayama, a Member of the House of Councillors; Yuriko Koike, the Governor of Tokyo; and Shinjirō Koizumi, the Minister of the Environment.Footnote 7
We randomly assigned one man politician and one woman politician to participants. We selected a set of politicians for each gender to minimise the possibility that our results are driven by the particular politicians we selected for the experiment, described next. To minimise any possible order effects, we randomly assigned whether respondents first evaluated a man or a woman politician. We also randomised which of the two politicians they viewed within each gender category, so as to ensure that our findings were not driven by public reaction to particular politicians. Each evaluation task was presented on a separate screen to focus respondent attention and minimise spillover. We asked respondents to evaluate two politicians, instead of one, to maximise statistical power.
Prior to asking respondents to evaluate a politician, respondents were then assigned with equal probability to see a photograph of the politician either wearing a mask (the Mask treatment group) or not (the Control group). In other words, there were four possible treatment combinations that respondents could see across the two politicians they viewed – ‘Mask/Mask’, ‘Mask/No Mask’, ‘No Mask/Mask’, and ‘No Mask/No Mask’ – each assigned with equal probability.Footnote 8 To keep as many things constant across our treatments as possible, we selected the photographs to be as similar as possible in size, colour, and other attributes. One difficulty in doing so, though, is that Japan’s widely promulgated social distancing rules have changed the conditions (e.g. lighting, locations) in which politicians appear in public.Footnote 9 Figure 1 shows the photos we used.Footnote 10 In addition to showing a photograph of the politician, we also provided respondents with their name and official position. We did this to make sure that respondents had some common baseline information about the politicians, though this was perhaps not necessary given that each official is highly visible in national media.
Politician photos and treatments.
Note: Respondents assigned to the Control condition for a politician received the image on the right; respondents assigned to the Mask condition for a politician received the image on the left.

We decided to use photos of real politicians, instead of artificially generated ones or photos of models, to enhance the realness of our survey instrument and the generalisability of our results. We note, though, that this poses a hard test for our hypotheses. Typically, researchers avoid using real political figures in these kinds of studies because respondents already have attitudes towards them, and the potential change in those attitudes caused by the relatively subtle manipulations in the experiment is therefore muted.Footnote 11
3.1 Outcome variables
To measure our respondents’ evaluations of politicians, we asked the following questions:
Support: To what extent do you support [politician]’s performance in office?
We asked this question on a standard 5-point support scale that ranged from Strongly Oppose (1) to Strongly Support (5). We also asked the 5 additional outcome questions below because respondents’ answers might help shed light on why politician mask-wearing might influence public support.
Attractive: How physically attractive do you think [politician] is?
Competent: How competent do you think [politician] is?
Smart: How smart do you think [politician] is?
Strong: To what extent do you think [politician] is a strong leader?
Trustworthy: How trustworthy do you think [politician] is?
These 5 questions are asked using a standard ten-point feeling thermometer scale. Higher values indicate a more positive assessment of politicians across these dimensions. We use the same scale across these outcome variables to facilitate comparisons. We randomised the order of all outcome questions to reduce the potential for order effects.
We chose the first outcome question – Support – because a primary concern of politicians is to maintain public support for their performance in office. Connecting back to our theory, the Attractive outcome captures one potential pathway by which wearing masks might influence public support. The other four outcome questions capture public evaluations that relate back to emotional perceptions and are aspects that the media has suggested that public perceptions of them might change depending on whether politicians wear masks or not (Boussalis et al., Reference Boussalis, Coan, Holman and Müller2021). Importantly, we examine possible treatment effects for these outcomes in an exploratory fashion. Any findings we have in this regard should be considered as post-hoc explanations worth additional study. In line with that, we do not have prior theoretical expectations about the relative magnitude of the treatment effects across outcome questions. This is partially because, to the best of our knowledge, we are the first to examine the causal effect of facial masks on public perceptions of these attributes.
3.2 Statistical analysis
To test our two hypotheses formally, we take the data from our $3016$
respondent evaluations (
$3016$
respondent evaluations ( $1508$
respondents
$1508$
respondents $ \times 2$
evaluation tasks) and estimate a set of ordinary least square (OLS) models. We use the following equation to evaluate our Mask Hypothesis.
$ \times 2$
evaluation tasks) and estimate a set of ordinary least square (OLS) models. We use the following equation to evaluate our Mask Hypothesis.
 $${Y_i} = {b_0} + {b_1} \cdot Mas{k_i} + {u_i}$$
The baseline category for this model (i.e. Mask ${{\rm{\;}}_i} = 0$
) is the Control or ‘No Mask’ condition.
${{\rm{\;}}_i} = 0$
) is the Control or ‘No Mask’ condition.
We use the following equation to evaluate our Woman Politician Mask Hypothesis.
 $${Y_i} = {b_0} + {b_1} \cdot Mas{k_i} + {b_2} \cdot Katayama/Koik{e_i} + {b_3} \cdot Mask \times Katayama/Koik{e_i} + {u_i}$$
The baseline category for this model (i.e. Mask ${{\rm{\;}}_i} = 0$
and Katayama/Koike
${{\rm{\;}}_i} = 0$
and Katayama/Koike ${{\rm{\;}}_i} = 0$
) is Control and Abe/Koizumi.
${{\rm{\;}}_i} = 0$
) is Control and Abe/Koizumi.
The dependent variable ( ${Y_i}$
) in each set of OLS models is the respondent’s (
${Y_i}$
) in each set of OLS models is the respondent’s ( $i$
) answer to our 6 different outcome questions. As discussed above, we ask respondents to answer our primary outcome question, Support on a 5-point scale and our 5 other outcome questions – Attractive, Competent, Smart, Strong, and Trustworthy – on a ten-point scale. To ensure comparability across outcomes, we rescale Support to be on a 10-point scale. In our models, we treat all outcome measures as continuous. The models also include an error term (
$i$
) answer to our 6 different outcome questions. As discussed above, we ask respondents to answer our primary outcome question, Support on a 5-point scale and our 5 other outcome questions – Attractive, Competent, Smart, Strong, and Trustworthy – on a ten-point scale. To ensure comparability across outcomes, we rescale Support to be on a 10-point scale. In our models, we treat all outcome measures as continuous. The models also include an error term ( ${u_i}$
). To account for the fact that respondents rated two politicians, we cluster standard errors by respondents.
${u_i}$
). To account for the fact that respondents rated two politicians, we cluster standard errors by respondents.
In additional models, we include a vector ( ${\bf{X}}$
) of pre-treatment covariates capturing respondent differences in age, gender, education, income, region, perceptions of self-attractiveness, and political knowledge. Our results are substantively similar if we omit these pre-treatment covariates from our models.
${\bf{X}}$
) of pre-treatment covariates capturing respondent differences in age, gender, education, income, region, perceptions of self-attractiveness, and political knowledge. Our results are substantively similar if we omit these pre-treatment covariates from our models.
Our Mask Hypothesis suggests that respondents in Mask, as compared to those in Control, are less likely to express support for a politician’s job performance. Therefore, we expect that in the model notated in Equation 1, ${b_1} x003C; 0$
. Our Woman Candidate Mask Hypothesis suggests that the public will be less likely to be satisfied with the job performance of women politicians when they wear masks. Thus, we expect that in the model notated in Equation 2
${b_1} x003C; 0$
. Our Woman Candidate Mask Hypothesis suggests that the public will be less likely to be satisfied with the job performance of women politicians when they wear masks. Thus, we expect that in the model notated in Equation 2 ${b_3} x003C; 0$
.
${b_3} x003C; 0$
.
In several exploratory analyses, we make subgroups of respondents based on pre-treatment covariates that include respondent age, gender, education, income, prefecture, respondent evaluations of their own attractiveness, and respondent political beliefs. We selected these pre-treatment covariates because they are presumably predictive of vote choice and electoral support. We add a binary moderator (e.g. whether a respondent is a man or woman, whether a respondent makes more than the median income) and its interactions with the treatment to the model and investigate whether the treatment effects are significantly different between the two subgroups. We dichotomise the moderators to address the possibility of non-linear interactive effects.
4 Results
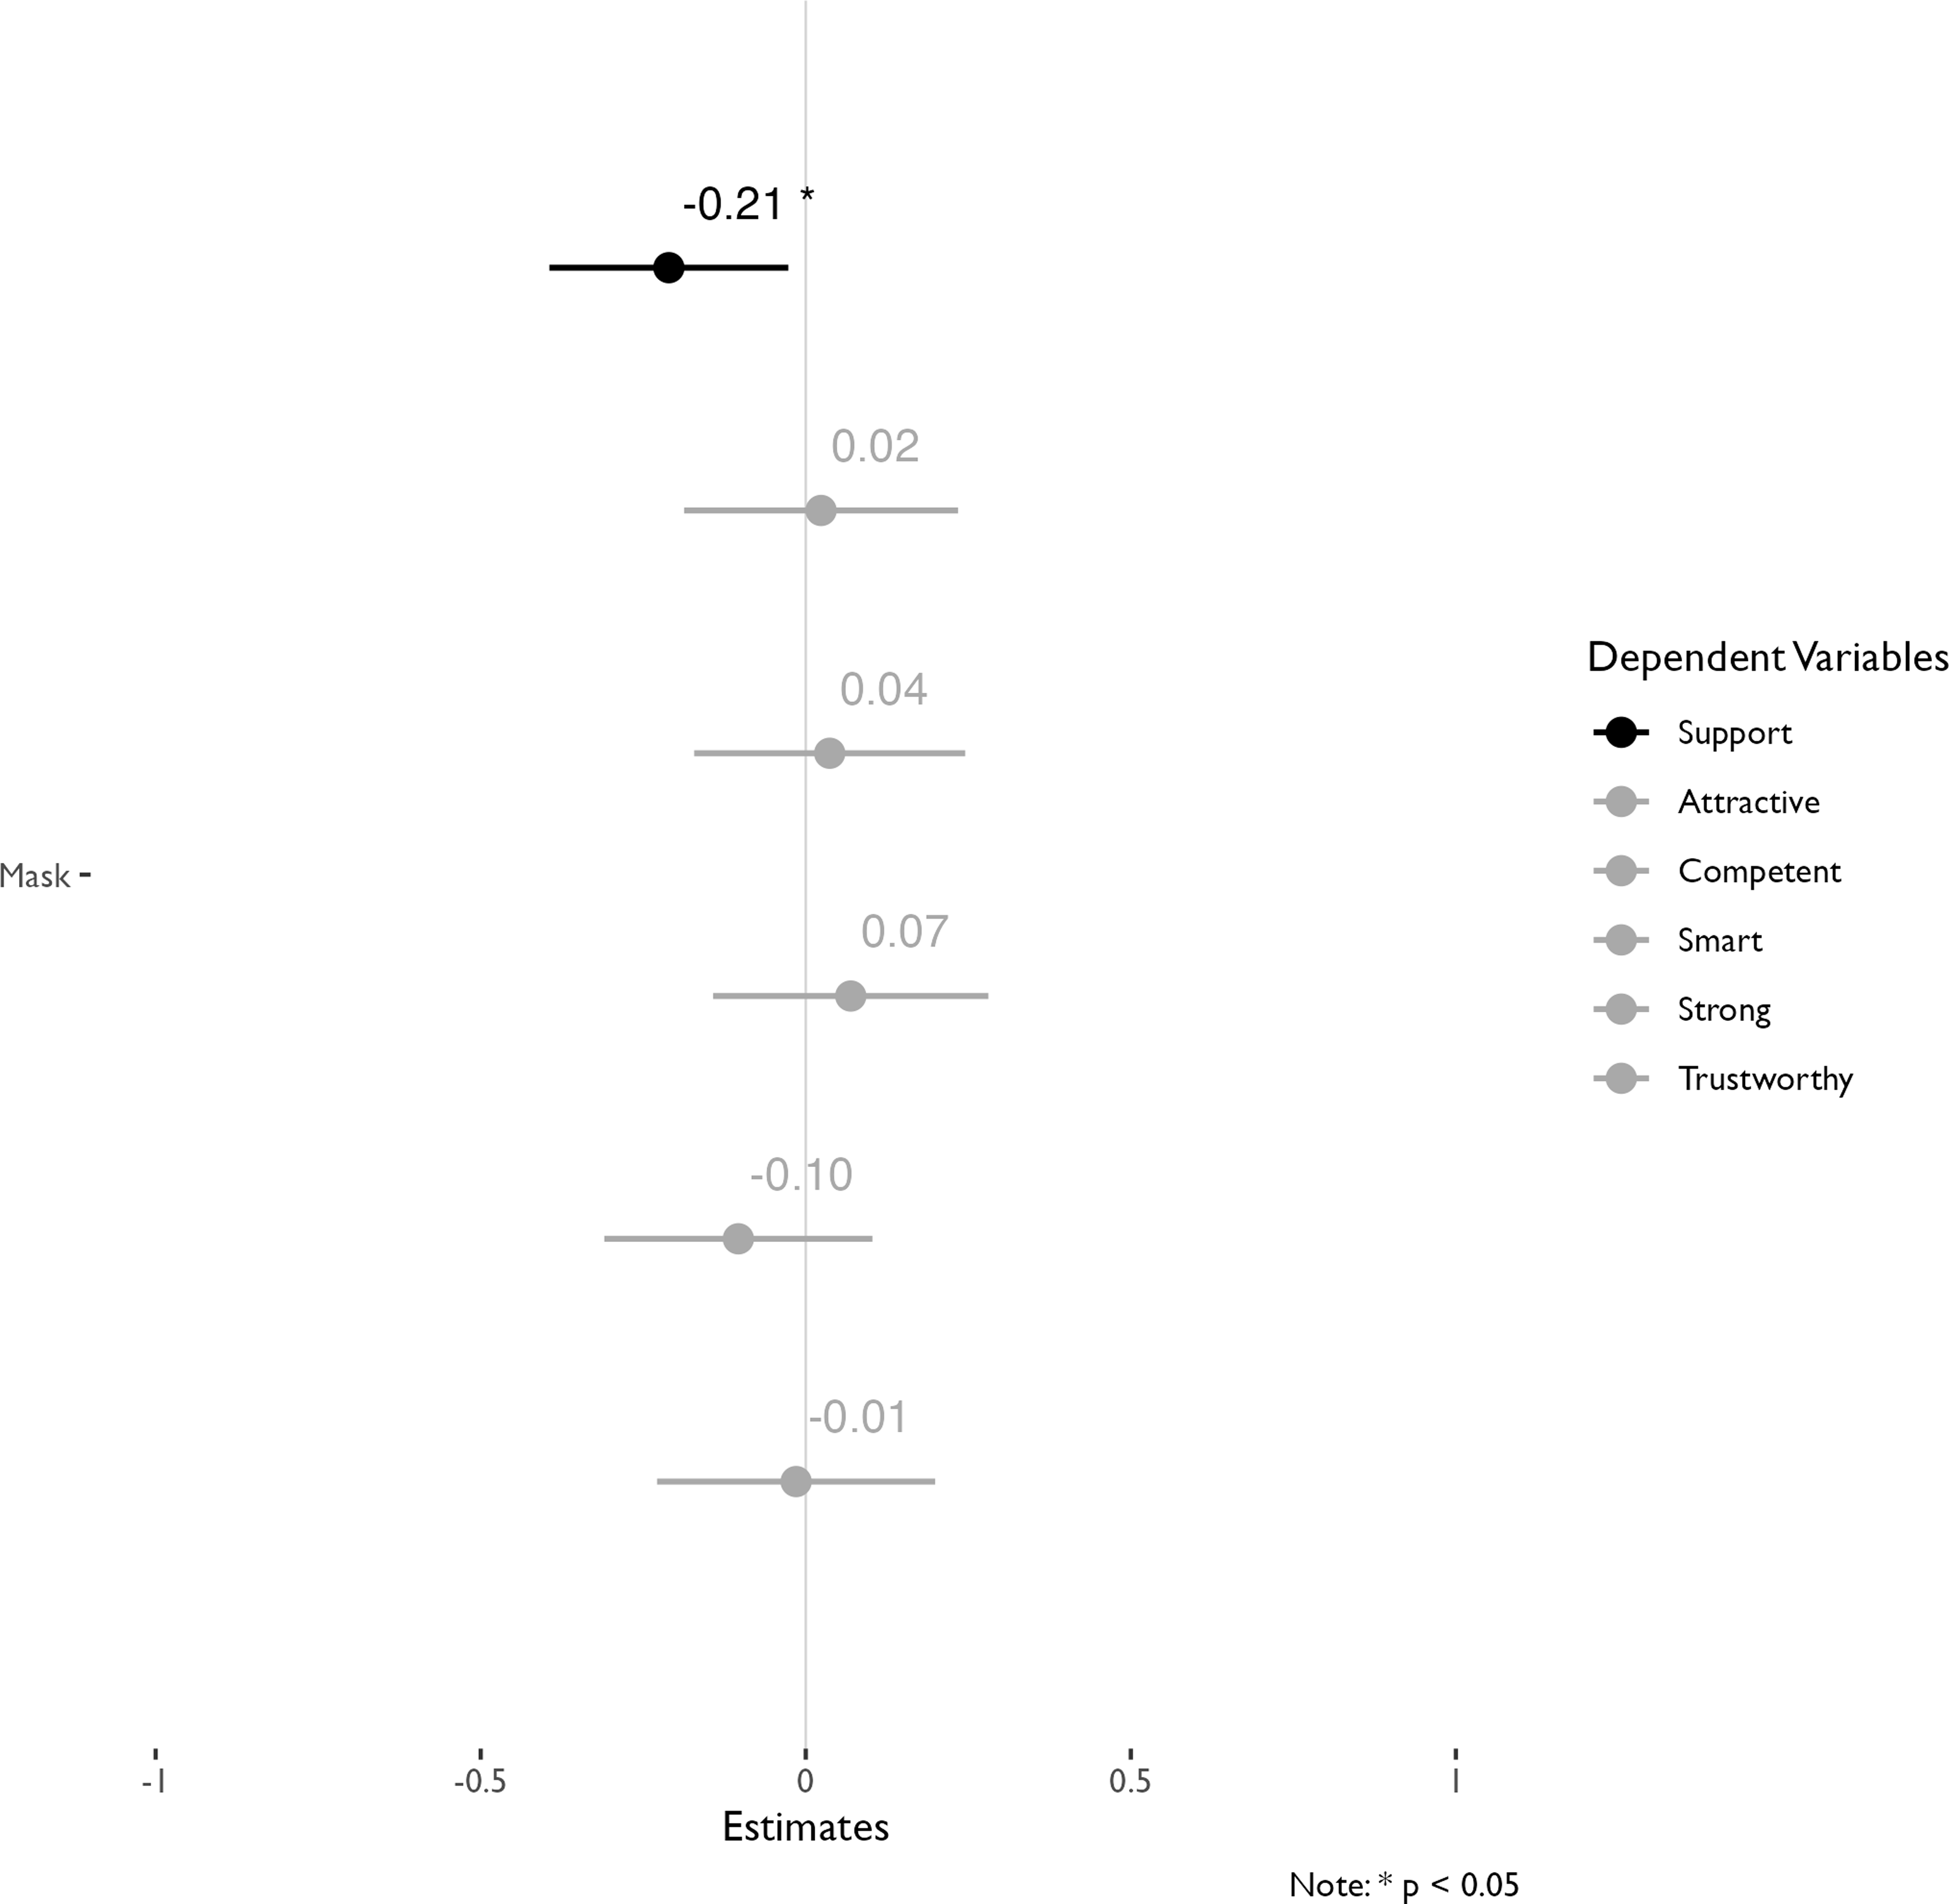
Figures 2 and B.1 show the results from our two sets of OLS models. Across both figures, plotted points indicated estimated coefficients, while horizontal bars represent 95 per cent confidence intervals. Starting with Figure 2, and moving down the vertical axis from the top, we see that the estimate for Mask ( ${b_1}$
) is negative for Support, in line with our theory, but not for the other outcomes. This means that wearing a mask has a negative effect on the extent to which members of the public might support them in office. Importantly, the estimated effect for Mask on Support is relatively large, about
${b_1}$
) is negative for Support, in line with our theory, but not for the other outcomes. This means that wearing a mask has a negative effect on the extent to which members of the public might support them in office. Importantly, the estimated effect for Mask on Support is relatively large, about $ -0.21$
, or
$ -0.21$
, or $0.08$
of a standard deviation in that outcome measure, which is
$0.08$
of a standard deviation in that outcome measure, which is $3.03$
. In short, we find some empirical support for our Mask Hypothesis.
$3.03$
. In short, we find some empirical support for our Mask Hypothesis.
Masks influence public support.
Note: Plotted points denote estimated coefficients, and solid lines indicate 95 percent confidence intervals. Primary outcome is in black, and secondary outcomes are in dark grey.

But to what extent are voters more likely to punish women for wearing masks? And might this finding be driven by how respondents view women candidates with and without masks? For presentation purposes, we present full results of our interactive model, as shown in Equation 2, in the Supplementary Information. We briefly note here that we find some support for our Woman Candidate Mask Hypothesis. As predicted by our theory, the estimated coefficient for the interaction terms ( ${b_3}$
) is negative across outcome measures. The term is statistically significant for our primary outcome – Support – and for one of our secondary measures, Competent. Crucially, the estimated coefficient for the interaction term in those two models is relatively large – equivalent to roughly a
${b_3}$
) is negative across outcome measures. The term is statistically significant for our primary outcome – Support – and for one of our secondary measures, Competent. Crucially, the estimated coefficient for the interaction term in those two models is relatively large – equivalent to roughly a $0.10$
and
$0.10$
and $0.12$
standard deviation change in each outcome measure, respectively. At first glance, then, it seems like the average treatment effects presented in the top plot hide potentially important treatment effects depending on whether respondents were evaluating Abe/Koizumi or Katayama/Koike.Footnote
12
Viewed another way, it seems that the estimated effect for Mask on Support shown in Figure 2 is driven by respondents evaluating women politicians.
$0.12$
standard deviation change in each outcome measure, respectively. At first glance, then, it seems like the average treatment effects presented in the top plot hide potentially important treatment effects depending on whether respondents were evaluating Abe/Koizumi or Katayama/Koike.Footnote
12
Viewed another way, it seems that the estimated effect for Mask on Support shown in Figure 2 is driven by respondents evaluating women politicians.
To investigate these differential effects more, we plot the marginal effect of the mask treatment across men and women politicians for each of our outcomes. Figure 3 presents these results. Plotted points indicate estimated marginal effects, and vertical bars denote 95% confidence intervals. Looking across these plots, we see that the Mask treatment seems to generally make respondents perceive of Abe/Koizumi more positively but Katayama/Koike less positively – though nearly all of the coefficients are still estimated imprecisely. Focusing on our primary outcome measure – Support – we see that the effect of the Mask treatment is negative and statistically significant for women politicians but positive and statistically insignificant for men politicians.Footnote
13
The effect of mask-wearing on support for women politicians is also substantively meaningful, equal to about a $0.13$
of a standard deviation decrease, neither too large to be unbelievable nor too small to be considered trivial.
$0.13$
of a standard deviation decrease, neither too large to be unbelievable nor too small to be considered trivial.
Effects of masks vary across Abe/Koizumi and Katayama/Koike.
Note: Plotted points denote marginal effects, and solid lines indicate 95 percent confidence intervals. Primary outcome is in black, and secondary outcomes are in dark grey.

We also see that the marginal effect of wearing a mask for Abe/Koizumi is positive for both the Competent and Smart outcomes, though these effects are not statistically significant at our pre-specified alpha level (p = 0.0501 and p = 0.0839, respectively). Taken together, they suggest a possible explanation for why wearing masks seems to decrease support for Katayama/Koike politicians but not for Abe/Koizumi. It could be that when politicians wear face masks, this generally decreases their public support – but that this is offset by the public perceiving men politicians, such as Abe/Koizumi, to be more competent/smart when they wear them. This makes sense in the Japanese context, where politicians often change their style of presentation during emergencies, such as the 3.11 deadly quake and tsunami, to signal that they are on disaster footing and in command of the situation.
Figure C.1 shows the effect of wearing a mask by a politician. We see that the effect for Katayama is negative, statistically significant, and substantively large. One concern might be that the interaction effect we find in our results for Support, and, therefore, the empirical support for Women Mask Hypothesis might be primarily driven by Katayama. There are several reasons why this might be the case. One explanation is that prior work shows that candidates who appear more attractive are more likely to win election, particularly when members of the public have little information about them (Ahler et al., Reference Ahler, Citrin, Dougal and Lenz2017). Of these four, only Katayama is a member of the House of Councillors, and the other three are members of the more famous and influential House of Representatives. This might explain her result if mask-wearing decreases perceptions of attractiveness and thereby support. Another explanation might centre on the photos we use for Katayama. In the one without a mask, she’s smiling, unlike the others; in the one with the mask, she’s wearing a colourful cloth mask instead of a plain surgical one like the others.Footnote 14
Yet, we think that concerns about Katayama driving these results must be considered in the context of the results for Koike. Here, we see the estimated effect of the Mask treatment on our primary outcome, Support, using just data from respondents assigned to the Koike condition is negative and statistically significant at the 0.10 level (p ≈ $0.08$
). Notably, the estimated effect is substantively large, roughly equivalent to
$0.08$
). Notably, the estimated effect is substantively large, roughly equivalent to $0.12$
of a standard deviation in the outcome measure. Potentially more importantly, the 95% confidence intervals for this treatment contain a range of large values. Taken together, we think that this suggests that we should not dismiss the Koike result because it does not meet the typical threshold of statistical significance (i.e.
$0.12$
of a standard deviation in the outcome measure. Potentially more importantly, the 95% confidence intervals for this treatment contain a range of large values. Taken together, we think that this suggests that we should not dismiss the Koike result because it does not meet the typical threshold of statistical significance (i.e. $0.05$
), but should consider it as some additional support for our Women Mask Hypothesis and an indication that our findings are not specific to Katayama alone.
$0.05$
), but should consider it as some additional support for our Women Mask Hypothesis and an indication that our findings are not specific to Katayama alone.
4.1 Effect heterogeneity
To further understand our results, we investigate in an exploratory fashion the degree to which subgroup differences might drive our findings. We test the extent to which our findings might be conditional based on respondent age, gender, education, income, region, respondent evaluations of their own attractiveness, and respondent political beliefs.Footnote 15 We find, however, little evidence for treatment effect heterogeneity.
5 Conclusion
Do the public think differently about politicians based on whether they wear masks or not? The answer to this question, hitherto not particularly important, has taken on considerable practical importance in the wake of the COVID-19 pandemic. In this paper, we develop a theory about why face coverings might decrease public support for politicians. We test our hypotheses in Japan, a country where face masks were widely used before the novel coronavirus outbreak and where their use is non-partisan, by conducting a within-subjects survey experiment with a national sample of about $1500$
residents.
$1500$
residents.
Taken together, our findings provide suggestive support for both our Mask and Women Mask Hypothesis. On average, it seems that candidates pay a price for covering their face, but that this price is higher – and perhaps driven entirely by – respondents’ reaction to women politicians wearing masks. That we find this empirical pattern, where mask-wearing was relatively common before the pandemic compared to other countries, and with experimental treatments that focus on high-profile politicians, for whom the public might hold firm views, suggests that the effect of mask-wearing on support for women politicians might be higher in other countries with similar gender norms but where face coverings are less common. One additional reason to think that our effects might be larger if we replicated this study in another context is that it was conducted in the middle of a worldwide crisis. Peyton et al. (Reference Peyton, Huber and Coppock2020) show that experiments conducted during this period largely replicate prior findings, but that the substantive size of findings is often smaller, potentially because respondents pay less attention to surveys during emergency situations. The impulse to punish women politicians, but not men politicians, for wearing protective face coverings appears surprisingly consistent across subgroups.
While our experimental design allows us to investigate several possible mechanisms that might lead to this disadvantage for women, we find little evidence for them. Katayama/Koike receive less public support when wearing masks, but this does not seem to be because the public considers them less attractive, competent, intelligent, smart, strong, or trustworthy – though some evidence suggests that they might consider Abe/Koizumi to be more competent and smart when they wear masks. Our results highlight that face masks do not have a uniformly negative effect on public perceptions about their wearers, and suggest the need for a better understanding of why facial masks appear to decrease public support. This is a new theoretical puzzle worthy of unpacking, particularly in light of predictions about the prevalence of similar pandemics in the future.
Viewed in a different light, the fact that support is affected by mask-wearing but not the other outcomes suggests another puzzle. We can think of at least two reasons why this was the case. One explanation is that survey respondents are likely to be asked about their support for candidates more than they are asked our other questions. Their familiarity with the question type and answer options might lead to more stable preferences and less measurement error, which could result in a statistically significant finding here but not elsewhere. Another possible competing explanation is that beliefs about the candidates are actually more stable, that is, sticky, than the degree to which respondents ‘support’ them in a diffuse sense. In this case, it might be easier to nudge support than perceptions of other candidate attributes. Both cases suggest a disjunction between overall candidate support and other beliefs about candidates that is worthy of future examination.
Our findings also suggest several directions for future research at the intersection of pandemic politics and politics and gender. First, we obtain our findings in the context of Japan, where facial coverings were in frequent use before the pandemic. A promising avenue of future research would involve probing the external validity of our findings and see if women are similarly punished in places where mask use was uncommon prior to the pandemic, such as in many non-Asian countries. The substantial effects we find for women politicians in Japan might be considerably larger in those places, with real consequences for the competitiveness of women politicians during elections held throughout the COVID-19 period. This might be particularly true in places where mask-wearing was highly politicised, like the United States.
Second, we study the effect of face masks in the context of well-known, incumbent politicians. It might well be the case that masks have a more negative effect for women – and perhaps even for men – in cases where politicians are less known, and public perceptions are less solidified. This would be in line with the literature that suggests candidate appearance matters more in cases where the public possesses less information (Koo, Reference Koo2020).
Third, we only study how face mask-wearing influences public perceptions. We know from a growing literature that face masks influence the physical and emotional states of their wearers. More work should look at how those effects might have influenced politicians and political decision-making throughout the pandemic, even after the outbreak passes. By doing so, researchers could help shed light on both the link between physical and emotional states and political performance and this important global crisis.
Supplementary material
To view supplementary material for this article, please visit https://doi.org/10.1017/S1468109924000082
Data availability statement
All data and computer code necessary to replicate the results in this analysis will be made publicly available on our web pages after publication. R 4.3.2 was the statistical package used in this study.
Acknowledgements
We thank Kostanca Dhima, Sona Golder, Rieko Kage, and Yoshikuni Ono and participants of the Asian Politics Online Seminar Series for their useful comments.



 Open access

