

Introduction
The RBP is a four-wave voter panel survey fielded between 2019 and 2021. It provides original information on Belgian citizens before and after the May 2019 federal, regional, and European elections (which occurred on the same day). The RBP panel dataset was designed to analyse citizens’ political attitudes and behaviours, with a specific focus on the different dimensions of democratic representation (substantive, procedural, and symbolic) and on democratic resentment, which we conceive as attitudes (e.g. alienation, distrust) and behaviours (e.g. protest, abstention). Additionally, its longitudinal structure allows to explore the political dynamics at play in Belgium throughout the election cycle, but also during the lengthy government formation process, as well as after the breaktrough of the Covid-19 pandemic. The RBP data is publicly available in Open Access and documented and should be of interest to scholars of public opinion and electoral studies (Walgrave et al. 2022).
The RBP was conducted by the Excellence of Science consortium RepResent (Representation & Democratic Resentment), which is a collaboration of political scientists from five Belgian universities (KULeuven, UCLouvain, Université libre de Bruxelles, Universiteit Antwerpen, Vrije Universiteit Brussel). It was coordinated by Stefaan Walgrave (Universiteit Antwerpen). The other principal investigators and co-supervisors were Sofie Marien (KULeuven), Benoit Rihoux and Virginie Van Ingelgom (UCLouvain), Emilie van Haute and Jean-Benoit Pilet (Université libre de Bruxelles), and Karen Celis and Kris Deschouwer (Vrije Universiteit Brussel).
The RBP can be combined with other election studies fielded previously in the country (Deschouwer et al. 2010, 2015). In particular, the teams in charge of the RepResent project have already conducted longitudinal surveys during 2009 Regional and the 2014 Federal, Regional and European elections, under the projects PartiRep I (2007–2011, coordinated by Kris Deschouwer, VUB; PIs: Marc Hooghe, KULeuven, Pascal Delwit, ULB, Stefaan Walgrave, UA) and PartiRep II (2012–2017, coordinated by Kris Deschouwer, VUB; PIs: Marc Hooghe, KULeuven, Pascal Delwit, ULB, Stefaan Walgrave, UA, benoit Rihoux, UCLouvain) funded by the federal Belgian science policy, Belspo. These datasets are also fully documented and available in open access (Deschouwer et al. 2009, 2014).
Before presenting the RBP dataset, we first discuss the context of the Belgian political system. We then describe the RBP study design, its technical validation, and the main areas of investigation of the survey. Finally, we discuss potential applications of this dataset and suggest likely comparisons with existing data.
The Belgian political system
Belgium is a parliamentary democracy and a federal system. It elects its members of parliament, at national and regional level, under a list proportional representation (PR) system with multiple multi-member districts.Footnote 1 The party system is extremely fragmented, with an effective number of parties of 9.7 in the Chamber of Representatives after the 2019 federal elections (Delwit and van Haute Reference Delwit and van Haute2021). Since the split of traditional party families along the French-Dutch linguistic divide, Belgium is characterized by two party systems operating separately: Dutch-speaking parties compete in Flanders, whereas French-speaking parties compete in Wallonia (Deschouwer Reference Deschouwer2012; Deschouwer et al. Reference Deschouwer, Pilet, van Haute and Deschouwer2017). Consequently, Dutch- and French- speaking parties do not present a list of candidates in the same electoral district, except in the bilingual district of Brussels.
Historically, the Dutch-speaking party system leans to the right, while the French-speaking party system is more to the left (van Haute and Deschouwer Reference Van Haute and Deschouwer2018). Because of the extreme party system fragmentation and of the differences between the Dutch-and French-speaking party systems, forming a coalition at the federal level is very complex and requires a lot of time: the longest period to form a federal government was 541 days in 2010. It also necessitates an agreement between many parties: the federal government put in place after the 2019 elections comprises of 7 parties. Further, Belgian elections are peculiar since voting is compulsory. However, although not showing up at the polling station on the day of the elections may result in a fine, such sanctions have not been applied over the last fifteen years.
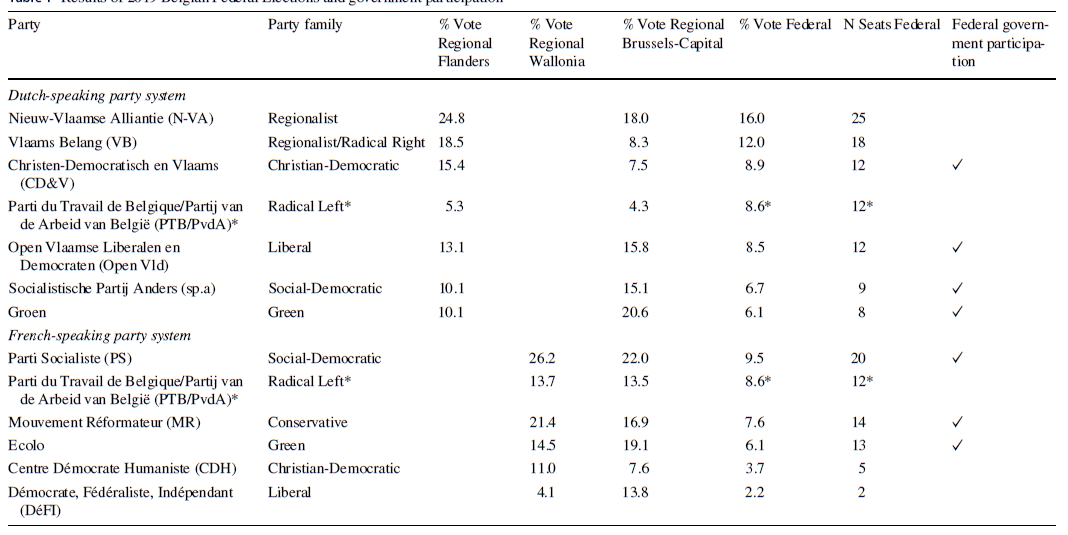
The 2019 elections that are covered by the RBP dataset, confirm the elements that we have just mentioned. The federal, regional, and European elections were held simultaneously on May 26th. First, turnout is high, and stable over time, because of compulsory voting (88.4%). Second, the party systems remained very fragmented, and twelve parties elected at least one MP in the lower house of the federal parliament. Both largest parties nationwide are located in Flanders: the Dutch-speaking Conservative Regionalists N-VA (New Flemish Alliance, Nieuw-Vlaamse Alliantie, 16% of all valid votes) and the radical right party VB (Flemish Interest, Vlaams Belang, 12% of all valid votes). In French-speaking Belgium, the largest party was the left-wing party PS (Socialist Party, Parti socialiste) (Table 1). Electoral results in the regional and European elections very closely match this distribution and regional divide. Finally, forming new coalition governments was extremely complex, especially at the federal level. A first agreement was achieved to put in place a temporary cabinet to manage the first wave of COVID-19. It was only in October 2020, more than one year after the 2019 elections, that a new coalition government with full prerogatives in all policy domains was formed by seven parties (Dutch- and French- speaking Liberals, Socialists, and Greens, and the Dutch-speaking Christian Democrats).
Results of 2019 Belgian Federal Elections and government participation

The table only displays the scores of parties who obtained a seat in the lower Chamber
*The PTB/PvdA is the only party that presented lists and obtained seats in the two party systems of the country
Study design and technical validation
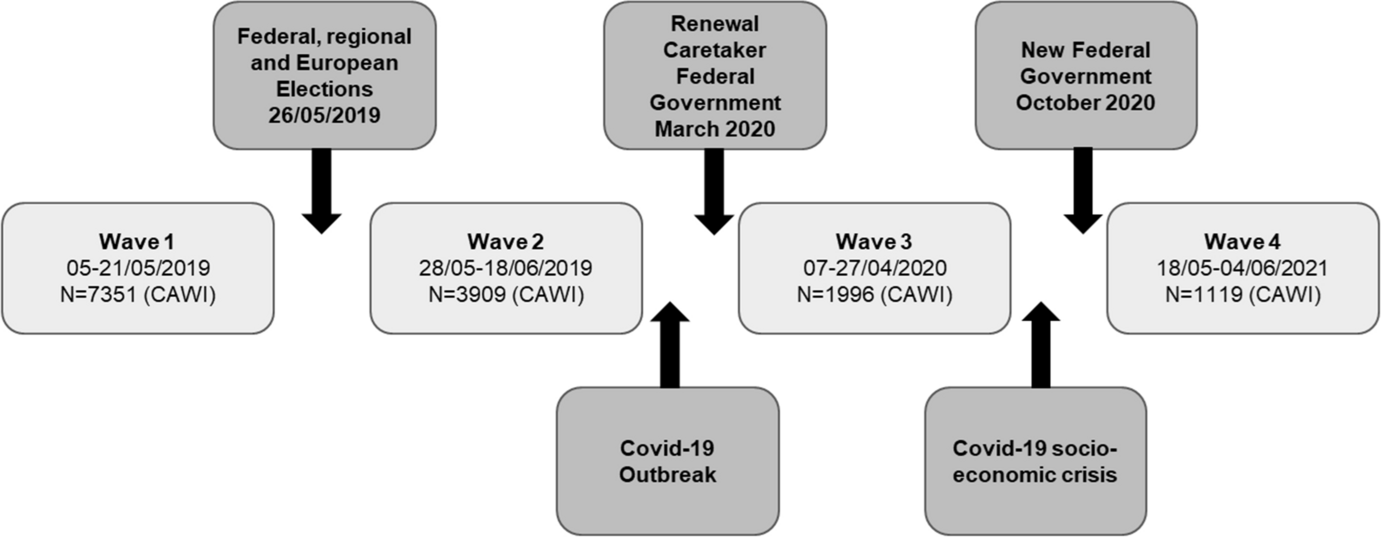
The RBP surveyed individual voters over four waves of questionnaires fielded around the federal, regional, and European elections of May 26, 2019, and prolonged until June 2021 (Fig. 1). The RPB questionnaires were administered through CAWI (Computer Assisted Web Interview) by Kantar TNS.Footnote 2 The sample consisted of respondents that were recruited from several online panels (Kantar’s own online panel as well as panels from other online companies such as Dynata), to allow for the largest possible recruitment of participants for the first panel wave. The target population of the study was the inhabitants of Flanders, Wallonia, and the Brussels Region that were eligible to vote for the elections of May 26, 2019. The target sample was a quota sample that would match the distribution of the population based on gender, age, and education levels in the three regions.
Timeline of RBP panel waves

The four waves surveyed the same initial sample of respondents, who were repeatedly contacted with the request to participate in the survey. In the first, pre-electoral wave, respondents were questioned between April 5 and May 21, 2019 (99% were interviewed before May 6). The second, post-electoral wave surveyed the same respondents immediately after the elections (between May 28 and June 18, 2019). Respondents were surveyed a third time one year after the elections (between April 7 and April 27, 2020), and a fourth time two years after the elections (between May 18 and June 4, 2021).Footnote 3
The unique, longitudinal character of the RBP dataset (4 waves, over 2 years) allows to further explore dynamics over time. Especially, waves 3 and 4 allow tracking the evolution of political attitudes and behaviours of Belgian citizens between elections, when governments are formed (elections + 1y) and take new policy decisions (elections + 2y), but also over the course of a unique health crisis due to the COVID-19 pandemic. Indeed, the outgoing (minority) federal government was managing the current affairs (caretaker government), and the negotiations to form a government were still ongoing when the pandemic occurred (May 2019-March 2020). An emergency caretaker government (Wilmès I) was formed in March 2020 with the support of opposition parties, with the specific task to handle the pandemic, while the negotiations to form a more stable government were occuring in parallel. It is only on October 1st, 2020 that the De Croo government was put in place (Fig. 1).
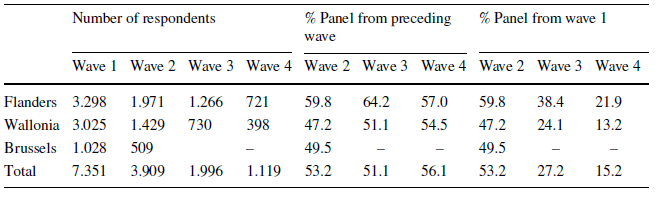
Table 2 describes the number of respondents for each wave after removing those who completed the survey in five minutes or less, who gave nonsensical responses (e.g., "fjkdqmfjdk") to open-ended questions, or straight-lined some of the matrix-style questions. Table 2 also discloses the attrition rates across the four RBP panel waves. 7351 interviews were completed in the first wave of the RPB, to maximize the responses over time and keep sizeable samples in the following panel waves. Despite the relatively important respondent attrition that can be expected in long-term panels, wave 4, that was fielded more than 2 years after wave 1, still includes 1119 respondents. Note that, due to attrition, Brussels respondents were left out of the sample after wave 2.
RBP panel attrition

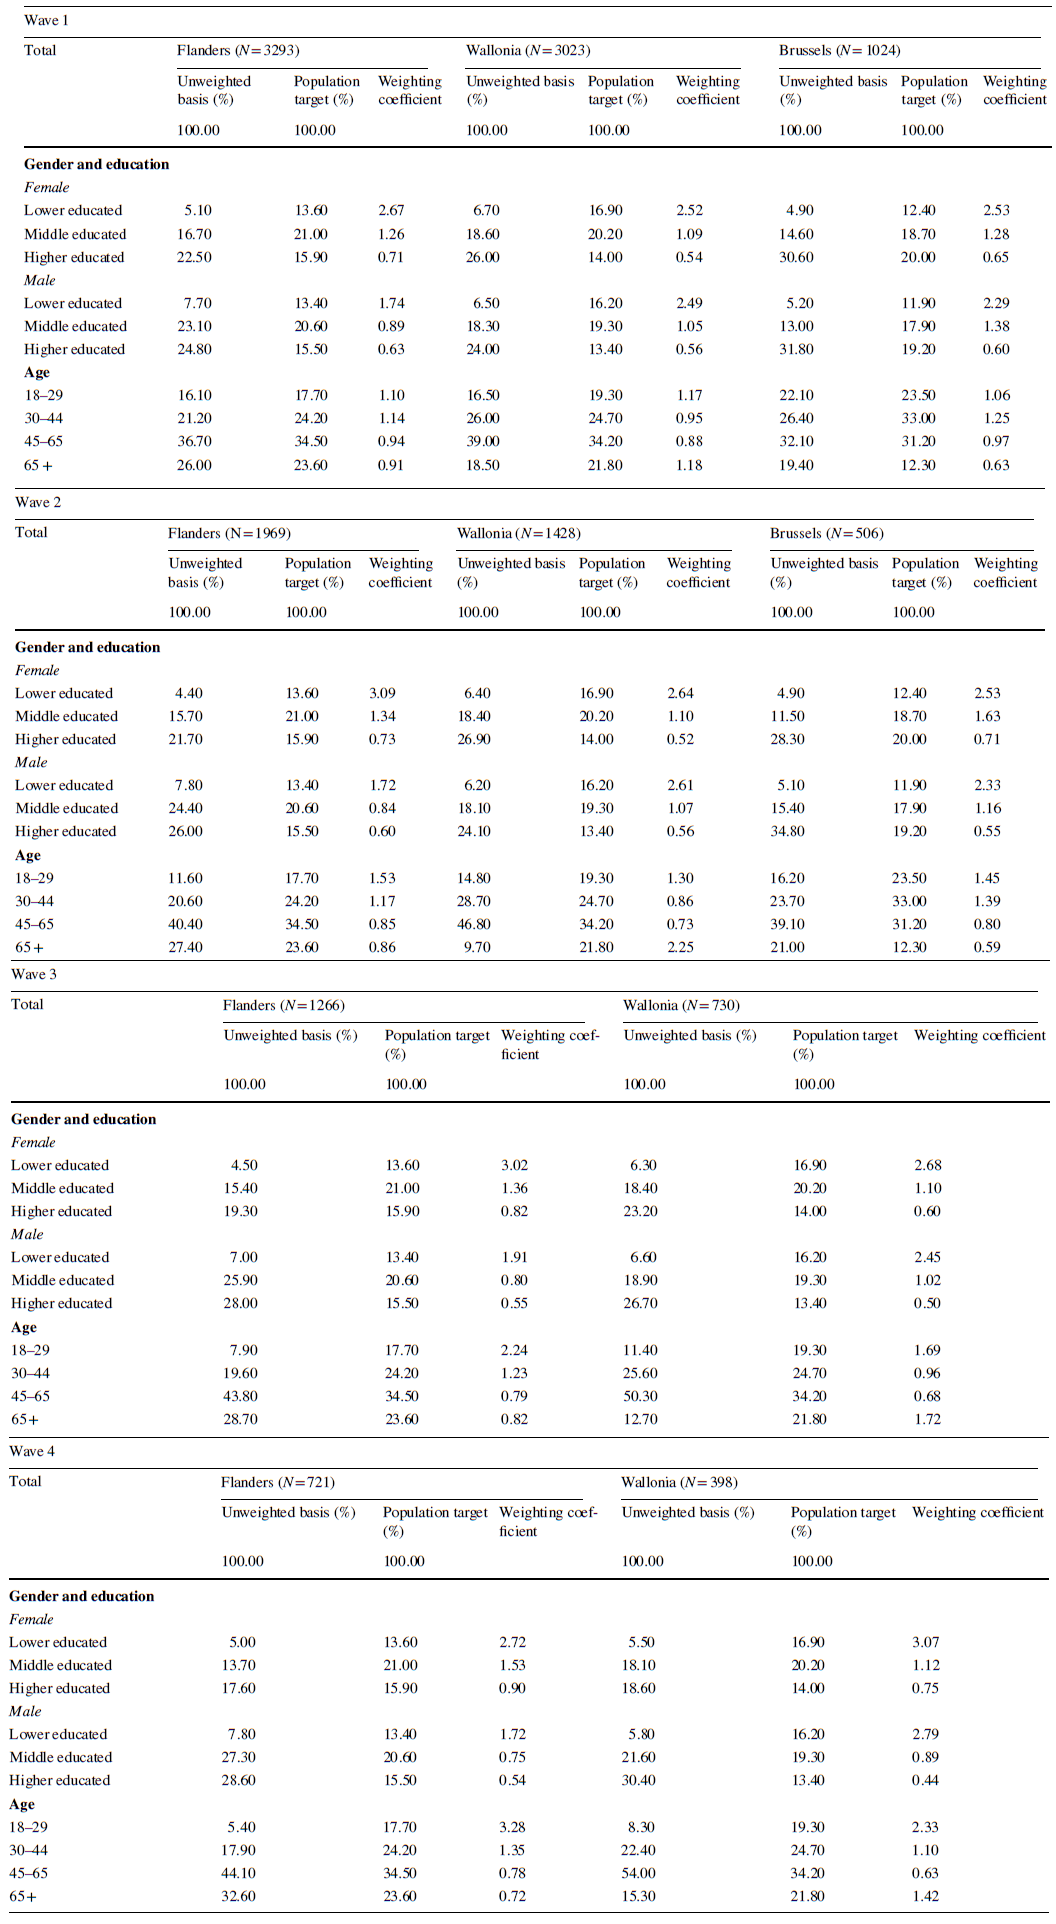
Due to non-responses—a problem for most contemporary surveys (De Heer and De Leeuw Reference De Heer, De Leeuw, Groves, Dillman, Eltinge and Little2002)—and panel attrition, the final sample slightly differs from the target population. Like several other individual-level surveys (e.g., see Jackman and Spahn Reference Jackman and Spahn2019), the initial raw sample is slightly distorted, with younger and lower educated (particularly women) individuals underrepresented. This distortion is relatively stable between the first two waves of the RBP. However, the distortion increases in the last two waves, since underrepresented individuals at the beginning of the survey are also more likely to drop out of panel surveys (see Gidron et al. Reference Gidron, Sheffer and Mor2022, for a similar dynamic regarding younger respondents). Given these differences, the RPB data includes weightings based on the distribution of the population (post-stratification). The weights were computed through iterative proportional sampling (raking) using the ipfraking module in STATA (Kolenikov 2017). This ensures that the weights correct the marginal distributions of the sample in order to match the population distribution of each region on gender and education (crossed, six categories), age (four categories), and voting behaviour for the federal elections in 2019.Footnote 4 Weighting targets and coefficients are presented in Appendix A. The weighted samples of the RBP provide unique representative data over the four waves. The questions of the RBP panel survey were designed to study the substantive, procedural, and symbolic dimensions of political representation (Pitkin Reference Pitkin1967). Furthermore, the study focused on democratic resentment (e.g. citizens’ attitudes towards democracy such as distrust and alienation, but also behaviours such as abstention, protest, or voting for anti-establishment parties). To evaluate substantive representation, the questionnaire includes a large array of standard political and policy preferences e.g. socio-cultural or socio-economic issues). Indeed, the congruence between policy and citizens’ preferences is central to the quality of democracy (Diamond and Morlino Reference Diamond and Morlino2005). To evaluate procedural representation, the RBP questionnaire includes several variables on the workings of the political system and its potential reforms (e.g., more direct, participatory, or deliberative democratic procedures). To evaluate symbolic representation, the questionnaire includes a battery of questions on “feeling” represented and on the linkage between individuals’ concerns and the concerns of institutions, political parties, and political leaders. Finally, the questionnaire conceives democratic resentment not only by using traditional indicators of political behaviour (abstention, protest, vote choice for populist or anti-establishment parties), but also by means of wider indicators on emotions, distrust, and alienation towards democracy and politics.
Furthermore, the RBP questionnaire includes two additional sets of questions. First, it includes questions on the use of Voting Advice Applications (VAA) during the campaign, on the appreciation of the results, and on the positions on the 18 VAA statements. In our sample, about 41% of Flemish respondents declared that they had used a VAA, for only 30% in Wallonia (Brussels respondents did not have a dedicated VAA available). The RBP dataset therefore allows to test the congruence between respondents’ and parties’ preferences, but also the electoral impact of using VAAs (Talukder et al. Reference Talukder, Uyttendaele, Jennart and Rihoux2021).
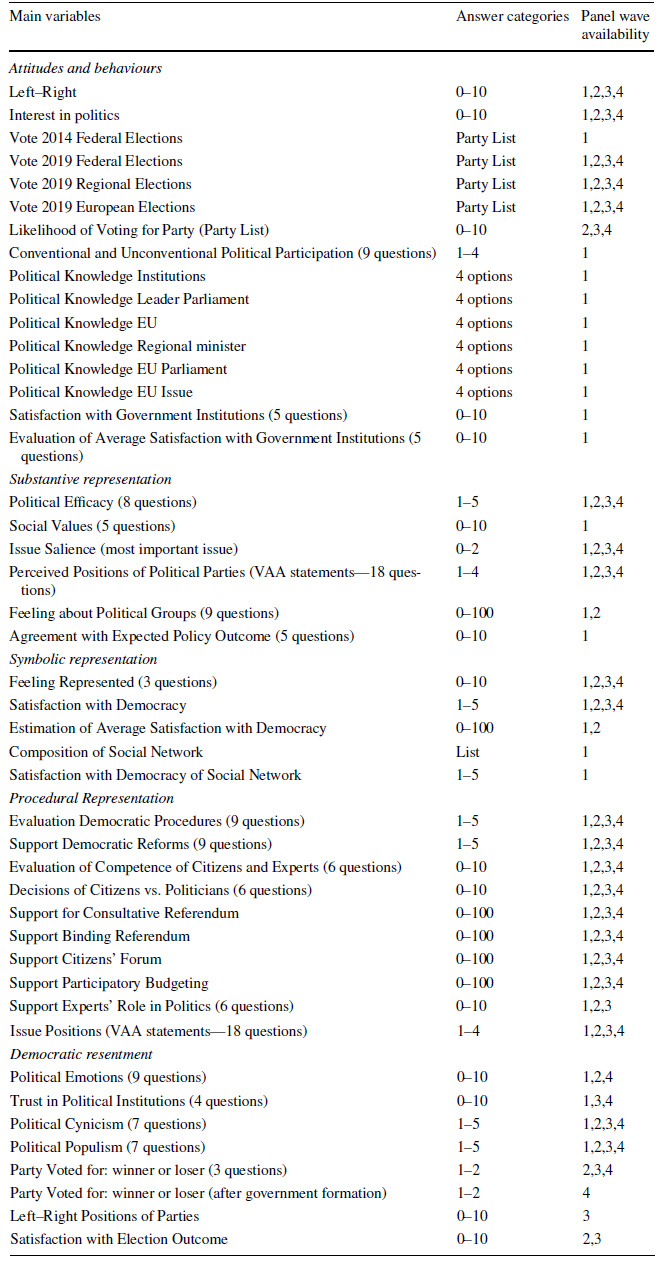
Second, the last two waves of the RBP were fielded respectively right after the outbreak of the Covid-19 pandemic (April 2020), and during the ensuing social and economic crisis (May 2021). An additional module on the pandemic was included, covering attitudes and emotions during the pandemic, agreement with Covid-19 governmental measures (and possible future measures), and the role of experts during the pandemic. The questionnaire includes more the 250 variables. Table 3 provides an overview of some of the main variables included and indicates how the variables are measured, as well as their availability in the various panel waves (see codebook in online Appendix for the full list of variables and question wording).
Overview of the main variables included in RBP

Potential applications
The RBP panel provides two examples of potential uses, and namely the study of the evolution of the electoral behaviour over time, by merging this dataset with previous studies, and the comparison of citizens’ attitudes before and after the pandemic.
Evolution in abstention potential: Belgian electoral panels over time (2009/2014/2019–2021)
The RBP can be combined with other voter panel studies fielded previously in the country. In particular, the teams in charge of the RBP project have already conducted longitudinal surveys during the 2009 regional and the 2014 federal, regional, and European elections. These datasets are also fully documented and available in open access (Deschouwer et al. 2009, 2014). Thus comparing datasets from RepResent I (2007–2011) and RepResent II (2012–2017) projects allow offers great potential to study the evolution of voting behaviours in Belgium over time. Over time, the datasets include standard variables of public opinion and political behaviour, as well as a (limited) number of shared variable on democratic attitudes that allow for longitudinal comparison. Indeed, the Belgian political system presents a series of features that are very relevant for country experts and comparative scholars alike, such as insights on vote choice or electoral volatility in extremely fragmented party systems, or on the electoral accountability of coalition governments (van Erkel et al. Reference Van Erkel, Kern and Petit2020; Pilet et al. Reference Pilet, Baudewyns, Deschouwer, Kern and Lefevere2020).
A further potential application relates to compulsory voting. Combining the RBP with the previous PartiRep I and PartiRep II datasets, we can examine the abstention potential in Belgium over the last decade (Hooghe and Deschouwer 2010; Reuchamps et al. 2015—the a question asks voters whether they would still vote if compulsory voting was abolished in BelgiumFootnote 5), or, alternatively, the causes and consequences of being a “relunctant voter” (Dassonneville et al. Reference Dassonneville, Feitosa, Hooghe, Lau and Stiers2019).
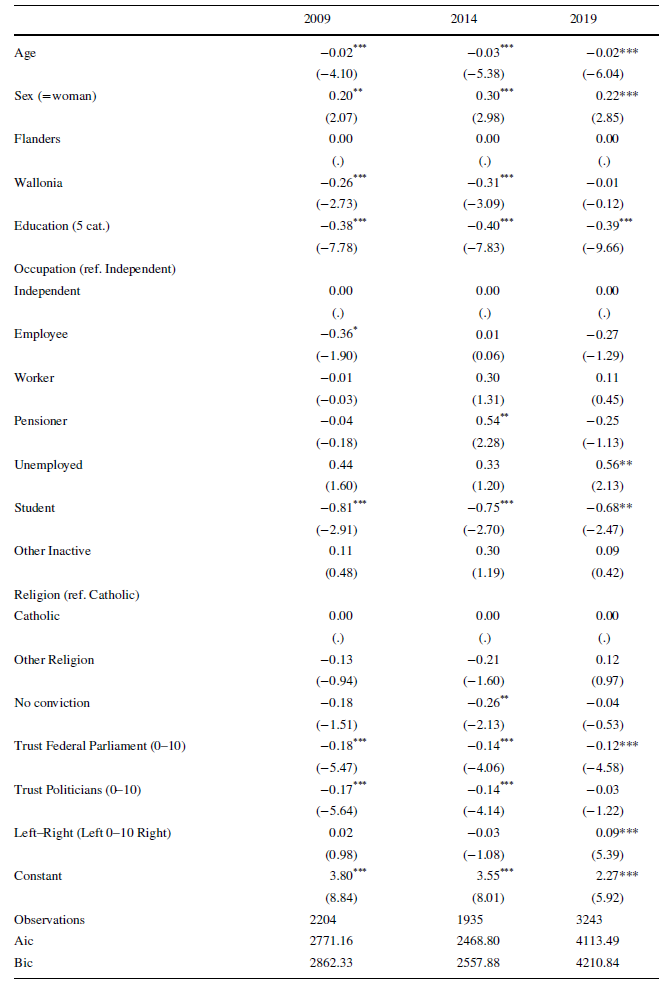
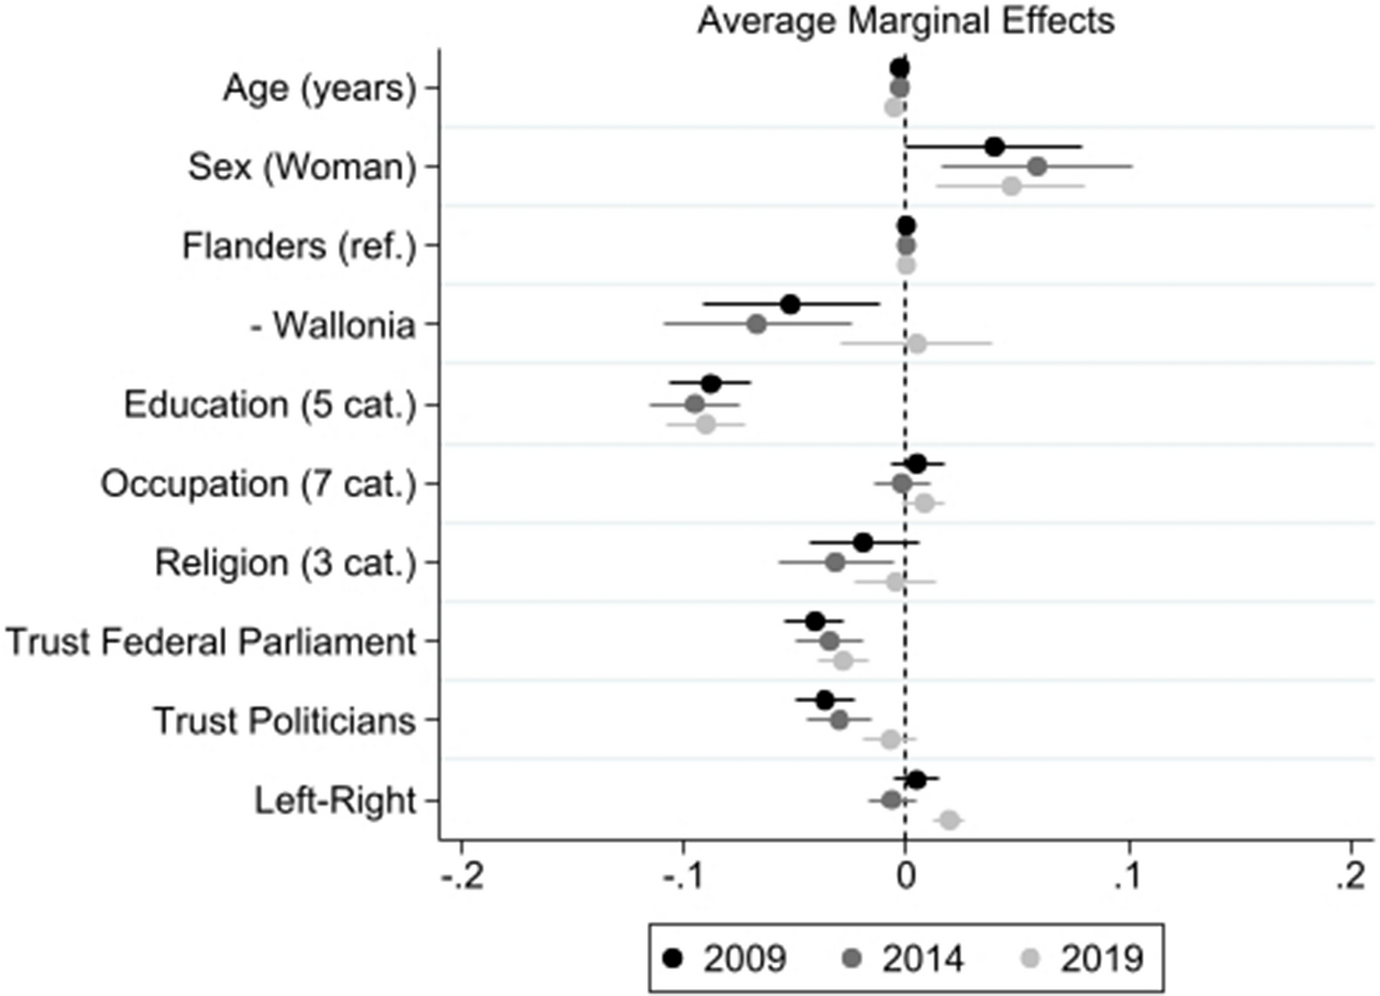
When it comes to the Belgians’ abstention potential, we can examine how answers to this question have evolved over time, and what factors influence the willingness to abstain among Belgian voters, i.e., choosing to abstain if it was legally allowed (Frognier et al. 2012). Figure 2 shows average marginal effects of major socio-demographic variables, trust, and ideology on abstention potential (see Appendix B for full model results). The association of individual-level factors with abstention potential is very stable over time: being older, male, with a higher level of education, being a student, or displaying higher levels of trust in parliament, are all negatively associated to abstention potential, to a similar extent in 2009, 2014, and 2021. However, in the most recent election of 2019, Wallonians tend to have a higher abstention potential. Interestingly, the negative effect of trusting politicians or parliament evolved over time on abstention potential is decreasing over time. These initial findings suggest that the influence of structural factors on vote choice in Belgium have evolved over time and call for further research.
Explaining the abstention potential over time (2009–2019)

Panel surveys in the times of the Covid-19 pandemic
Because of its panel design over two years, RPB has high potential for research combined with other panel studies for comparative research. One of the potential applications is to measure the political consequences of the Covid-19 crisis, as the panel started more than a year before the outbreak of the pandemic and lasted throughout 2021. This design is particularly useful, as it allows to measure variables of interest for the study of public opinion and political behaviour in times of a sanitary crisis, while measuring potential correlates (partisanship, ideology, issue preferences) at an earlier time point, pre-pandemic (to avoid endogeneity issues associated with measuring political behaviours and attitudes, or partisanship and vote choices simultaneously, see Wlezien et al. Reference Wlezien, Franklin and Twiggs1997, Bartels Reference Bartels2002). It allows to investigate the effect of political factors on evaluations or reactions to Covid-19, such as the rally around the flag effect (Baekgaard et al. 2020; Dietz et al. 2021; Kritzinger et al. Reference Kritzinger, Foucault, Lachat, Partheymüller, Plescia and Brouard2021; Schraff Reference Schraff2020). Furthermore, the RPB allows for cross-country comparison with similar Covid-19 panels (in Austria, see Kittel et al. Reference Kittel, Kritzinger, Boomgaarden, Prainsack, Eberl, Kalleitner, Lebernegg, Partheymüller, Plescia, Schiestl and Schlogl2020, 2022; in 11 democracies, see Brouard et al. Reference Brouard, Foucault, Michel, Becher, Vasilopoulos, Bono and Sormani2022). In the RBP dataset, we observe a striking stability of political attitudes throughout the Covid-19 pandemic, which is in line with the findings in other Western countries (Altiparmakis et al. Reference Altiparmakis, Bojar, Brouard, Foucault, Kriesi and Nadeau2021).
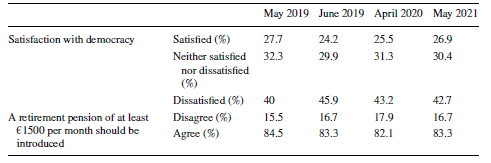
Table 4 reports the evolution of a satisfaction with democracy and a typical socio-economic policy preference (minimum pension amount) across the four waves of the panel. Both aggregate levels of satisfaction and support remain unchanged after the outbreak of the pandemic. The stability of attitudinal indicators on all dimensions of democratic representation and on most policy preferences in times of global crisis and democratic limitations, contributes to the debate on the robustness and resilience of how citizens view and evaluate democracy (Ferrin and Kriesi Reference Ferrin and Kriesi2016).
Evolution of attitudes in RBP
Appendix A: Weighting targets–Population targets are identified based on the data of Kantar TNS
Appendix B: Explaining potential abstention in Belgium over time (2009–2019)


 Open access