

1. Introduction
Under the European Green Deal, the European Commission has set a target of at least 25% of the EU’s agricultural land under organic farming compared with only 8.5% of the EU’s total Utilised Agricultural Area (UAA) in 2020 with some differences between countries (8.5% in France, 9.3% in Spain, 9.7% in Germany, 15.8% in Italy and 26.1% in Austria, see Agence-Bio, 2021). To achieve such an objective, the “farm to fork” action plan aims at stimulating conversion, boosting consumer demand and improving the economic and environmental sustainability of organic farms. At the same time, the European Commission also targets a reduction by 50% of the use of chemical fertilisers by 2030 with the aim to create incentives for changing agricultural practices and reduce soil and water contamination. The French policy also defines a 50% reduction target for the total quantity of fertilisers used from 2015 to 2025. The Dutch directive on sustainable crop protection aims at reducing impacts of fertilisers on the environment by 90% in 2023 compared to 2013.
These two objectives concerning the share of organic farming and the decrease in chemical fertilisers are particularly difficult to achieve for irrigated agricultural productions. Irrigated crops account for almost 20% of cultivated land and 35% of world agricultural production. In Europe, southern countries are well equipped (over 20% of UAA in Italy and Greece; over 10% in Spain and Portugal, over 7% in France; but also significant in the Netherlands and Denmark). In France, although the UAA decreased by 3.46% between 2010 and 2020, the share of irrigated land increased by 14.61% over the same period. Irrigation mainly concerns cereals and is almost systematic in arboriculture and predominates in vegetables, for which the demand for organic products is growing. Consumers are willing to pay a premium for organic food because they consider organic food to be healthier, of higher quality, and less harmful to the environment compared to conventional one (Meemken and Qaim, Reference Meemken and Qaim2018). While the development of organic farming will obviously reduce water contamination due to the non-use of fertilisers, the question of water withdrawal from aquifers remains for both conventional and organic farming. It is then important to analyse the consequences of farming conversion for products like fresh vegetables and fruits on the state of the resource.
The literature explaining the difficult conversion of conventional farmers to organic is important (Bakker et al., Reference Bakker, Sok, Van Der Werf and Bianchi2021; Bjørnåvold et al., Reference Bjørnåvold, David, Bohan, Gibert, Rousselle and Van Passel2022; Jacquet et al., Reference Jacquet, Jeuffroy, Jouan, Le Cadre, Litrico, Malausa, Reboud and Huyghe2022). Since organic farmers are not allowed to use synthetic inputs (no synthetic pesticides and no mineral fertilisers), they are generally less productive with smaller output levels. Seufert et al. (Reference Seufert, Ramankutty and Foley2012) showed that organic yields are 25% lower on average than conventional yields and could reached minus 35% for irrigated agriculture. Based on commercial farm data in the United States, Kniss et al. (Reference Kniss, Savage and Jabbour2016) reported organic cereal yields to be 20% lower than conventional yields but more than 50% for certain vegetables. Using an extensive dataset than Seufert et al. (Reference Seufert, Ramankutty and Foley2012), Ponisio et al. (Reference Ponisio, M’Gonigle, Mace, Palomino, De Valpine and Kremen2015) showed that the gap is lower, about 20% on average. Knapp and van der Heijden (Reference Knapp and van der Heijden2018) support this result using a reduced dataset but also demonstrate that conventional agriculture has, on average across all crops, and per unit food produced, a higher relative yield stability of 15% compared to organic agriculture. It is also well known that organic farming is less polluting than conventional farming. Fertilisers used by conventional agricultural have detrimental effects on the environment like soil erosion, water contamination, biodiversity and species richness losses or pest contamination (Shepherd et al., Reference Shepherd, Pearce, Cormack, Philipps, Cuttle, Bhogal, Costigan and Unwin2003; Gomiero et al., Reference Gomiero, Pimentel and Paoletti2011). This make organic farmers more vulnerable to pollution than non organic farmers since the use of synthetic fertilisers is for them prohibited. However organic products are priced on average 50% above conventional products with a median 30% price premium (Crowder and Reganold, Reference Crowder and Reganold2015; Meemken and Qaim, Reference Meemken and Qaim2018). It reflects the higher willingness to pay of buyers for organic products but also higher costs in production, processing, and distribution (Seufert et al., Reference Seufert, Ramankutty and Mayerhofer2017). So even if organic farmers benefit from a price premium, the lower productivity and the risk of large production losses strongly limit farmers’ willingness to reduce their fertiliser uses. In addition to these potential income reductions, several studies have highlighted technical and socio-psychological factors (Bakker et al., Reference Bakker, Sok, Van Der Werf and Bianchi2021; Bjørnåvold et al., Reference Bjørnåvold, David, Bohan, Gibert, Rousselle and Van Passel2022). All of this explains why despite National Action Plans on fertiliser use implemented in several European countries like France since 2009, fertilisers use have increased by 11% from 2010 to 2018 and sales have reached 370 million kilograms in 2018.
An efficient instrument to reduce fertilisers use and favour conversion to organic farming consists in fertiliser taxation. Several European countries like Austria, Belgium, Italy, Finland, France, Denmark, Norway and Sweden have introduced input taxes on chemical fertilisers (Finger et al., Reference Finger, Möhring, Dalhaus and Böcker2017; Slunge and Alpizar, Reference Slunge and Alpizar2019). The implementation of such taxes on synthetic fertiliser may help to promote the conversion of irrigated agriculture from conventional to organic farming. However as emphasised by Finger et al. (Reference Finger, Möhring, Dalhaus and Böcker2017), the use of tax revenues is crucial. They could be used in various ways, in the form of subsidies for organic farmers or to finance more water-efficient irrigation techniques. In general, revenues of the fertiliser tax in Sweden and Norway are not specifically used for agricultural or related purposes, while in France a portion of the tax revenues is used to internalise external effects of fertiliser use, i.e. it is used to clean water from fertiliser residues (Art. L213-10-8 Code de l’environnement). We will consider this last case as in Erdlenbruch et al. (Reference Erdlenbruch, Tidball and Zaccour2014). It implies that the implementation of such a tax is the main economic channel which can promote this conversion. Hence by reducing fertiliser uses, pollution that affect negatively all farmers and especially organic farmers is also reduced which will make it more profitable to organic farmers.
The literature on organic farming conversion in dynamic model is scarce as mentioned by Xu et al. (Reference Xu, Huet, Poix, Boisdon and Deffuant2018). These authors studies decision conversion trajectories in a dynamic agent-based model. We extent this bounded rational framework using an evolutionary approach which appears to be relevant for analysing this conversion in the presence of myopic farmers who adapt their decision according to the profits’ differential. The endogenous choice depends on the value of the fertiliser tax and is based on the well known replicator dynamics. The evolutionary game theory postulates that agents play in a myopic context (as assumed in several models on groundwater management) and adopt the most rewarding alternative strategy (Weibull, Reference Weibull1998). Moreover, it allows to distinguish extreme dynamic regimes when all farmers are either organic or conventional but also intermediate regimes in which both types of farmers coexist. Our evolutionary model is integrated in a dynamic groundwater management framework (see the seminal work of Gisser and Sanchez, Reference Gisser and Sanchez1980) with pollution and, as in Roseta-Palma (Reference Roseta-Palma2002, Reference Roseta-Palma2003) or Erdlenbruch et al. (Reference Erdlenbruch, Tidball and Zaccour2014), we assume that the dynamics of the water table depends on water extracted by farmers and on the natural recharge and we suppose that pollution depends on the fertiliser use. Moreover, as in Erdlenbruch et al. (Reference Erdlenbruch, Tidball and Zaccour2014), we assume that a water agency aims at regulating the over-exploitation of the groundwater stock and the excessive pollution by farmers. Regulation takes the form of taxes on water withdrawals and on the use of fertilisers which revenues are used to finance pollution abatement programme. In their model, farmers are not impacted by the pollution they create but water contamination may imply damage to the society for public supply of drinking water or the deterioration of groundwater dependent ecosystems. In our model we assume that pollution creates a negative externality directly on the profits for all the farmers and the negative impact is even greater for organic farmers as they may loose their organic label. We assume that a water agency implements two taxes but as the tax on water withdrawals applies to both types of farmers, it will have no impact on conversion. When water and fertilisers are complementary inputs, as we assume, the water tax will induce non-organic farmers to decrease their use of fertilisers, implying less externality for all farmers without changes in the share of organic farmers. Only the implementation of a tax on fertilisers may favour the conversion of non-organic to organic farms.
This article aims at answering the following questions:
-
1. Under which conditions conversion from conventional to organic farming can be done according to the degree of profitability, productivity and vulnerability of organic farmers?
-
2. What will be the impact of this conversion on the sustainability of the resource and the water table of the aquifer?
-
3. What will be the impact of this conversion on profit farmers taking into account pollution and on total welfare?
The paper is structured as follows. In Section 2 a hydro-economic model with two types of farmers is described in terms of constraints on the water tables and the two taxes set by a water agency. Section 3 presents the endogenous choice for farmers of being or not organic in an evolutionary dynamic framework. In Section 4 policy implications and welfare analysis are performed according to the value of the fertiliser tax in the case-study of the Western la Mancha aquifer (Spain). The last section concludes. All the proofs are displayed in a mathematical appendix.
2. The hydro-economic model
We first describe the dynamics of the aquifer and then the behaviour of farmers who can be either organic or conventional.
2.1 The aquifer dynamics
The dynamics of an aquifer is described by changes in the water table, measured by $\dot{H}=H^{\prime }(t)$
in Eq. (1). The water table increases with the constant natural recharge
$\dot{H}=H^{\prime }(t)$
in Eq. (1). The water table increases with the constant natural recharge $R\gt 0$
and is reduced by total water extraction
$R\gt 0$
and is reduced by total water extraction $W$
dedicated to irrigation. A proportion of the water used for irrigation is assumed to come back to the aquifer and
$W$
dedicated to irrigation. A proportion of the water used for irrigation is assumed to come back to the aquifer and $\mu \in (0,1)$
represents this return flow coefficient, while
$\mu \in (0,1)$
represents this return flow coefficient, while $AS\gt 0$
is the aquifer area times storativity.
$AS\gt 0$
is the aquifer area times storativity.
 \begin{equation} \dot{H}=\left [ R-(1-\mu )W\right ] \left ( \frac{1}{AS}\right ) . \end{equation}
At the steady state $\dot{H}=0$
, the water pumping is
$\dot{H}=0$
, the water pumping is
 \begin{equation} W=\frac{R}{1-\mu }, \end{equation}
and it only depends on hydrological parameters as in Gisser and Sanchez (Reference Gisser and Sanchez1980).
The total volume of water $W$
is assumed to be extracted by a
$W$
is assumed to be extracted by a $N$
size population of farmers with
$N$
size population of farmers with $W=N w$
with
$W=N w$
with $w$
individual pumping. Farmers can be of two types, organic (subscript
$w$
individual pumping. Farmers can be of two types, organic (subscript $o$
) in proportion
$o$
) in proportion $x$
and conventional (subscript
$x$
and conventional (subscript $c$
) in proportion
$c$
) in proportion $(1-x)$
with
$(1-x)$
with $x\in \left [ 0,1\right ]$
. Dynamics Eq. (1) can be rewritten as
$x\in \left [ 0,1\right ]$
. Dynamics Eq. (1) can be rewritten as
 \begin{equation} \dot{H}=\left \{ R-(1-\mu )[xNw_{o}+(1-x)Nw_{c}]\right \} \left ( \frac{1}{AS} \right ) . \end{equation}
2.2 The economic model
Organic and conventional farmers produce the same agricultural product but differs on the following points: (1) organic farmers sell agricultural good to a higher price, (2) conventional farmers use chemical fertilisers, denoted by $z$
, to increase land productivity,Footnote
1
(3) organic production has a lower productivity and is more vulnerable to pollution than conventional one. According to Roseta-Palma (Reference Roseta-Palma2003) and Erdlenbruch et al. (Reference Erdlenbruch, Tidball and Zaccour2014), the revenues of the representative conventional farmer are:
$z$
, to increase land productivity,Footnote
1
(3) organic production has a lower productivity and is more vulnerable to pollution than conventional one. According to Roseta-Palma (Reference Roseta-Palma2003) and Erdlenbruch et al. (Reference Erdlenbruch, Tidball and Zaccour2014), the revenues of the representative conventional farmer are:
 \begin{equation} Y_{c}=\left ( \alpha w_{c}-\frac{\beta }{2}w_{c}^{2}+\gamma z-\frac{\delta }{2 }z^{2}+\eta zw_{c}+\zeta \right ) p, \end{equation}
where $\alpha$
,
$\alpha$
, $\beta$
,
$\beta$
, $\gamma$
,
$\gamma$
, $\delta$
,
$\delta$
, $\eta$
,
$\eta$
, $\zeta$
are non-negative parameters. The function Eq. (4) is increasing and concave in both inputs, namely conventional water pumping
$\zeta$
are non-negative parameters. The function Eq. (4) is increasing and concave in both inputs, namely conventional water pumping $w_{c}$
and fertiliser
$w_{c}$
and fertiliser $z$
. Parameters
$z$
. Parameters $\alpha$
,
$\alpha$
, $\gamma$
,
$\gamma$
, $\zeta$
ensure increasing shape,
$\zeta$
ensure increasing shape, $\beta$
and
$\beta$
and $\delta$
ensure diminishing marginal returns, while
$\delta$
ensure diminishing marginal returns, while $\eta \geq 0$
indicates that the inputs are complementary. Finally,
$\eta \geq 0$
indicates that the inputs are complementary. Finally, $p\gt 0$
is the given price for conventional production. The following lemma holds.
$p\gt 0$
is the given price for conventional production. The following lemma holds.
Lemma 1. The revenues function Eq. (4) admits a global maximum point if
 \begin{equation} \beta \delta -\eta ^{2} \geq 0. \end{equation}
The marginal rate of technical substitution between inputs $w_{c}$
and
$w_{c}$
and $z$
(
$z$
( $ MRTS(w_{c},z)$
) is negative if
$ MRTS(w_{c},z)$
) is negative if
 \begin{equation} w_{c} \leq \frac{\alpha }{\beta },\;\forall z,\;\;\;\;\;\text{and} \;\;\;\;\;z \leq \frac{\gamma }{\delta },\;\forall w_{c}. \end{equation}
Eq. (6) implies restrictions on parameters to ensure a concave revenue function and maximum values for the inputs of a conventional farmer.
Assuming an organic premium price and a lower land productivity, the revenues of the representative organic farmer are:
 \begin{equation} Y_{o}=\left ( \alpha w_{o}-\frac{\beta }{2}w_{o}^{2}\right ) (1+\varepsilon _{p})p\varepsilon _{y}, \end{equation}
where $\varepsilon _{p}\gt 0$
represents the price premium while
$\varepsilon _{p}\gt 0$
represents the price premium while $\varepsilon _{y}\in (0,1)$
is a parameter that captures a reduction in land productivity. For the sake of simplicity, we assume a linear reduction in productivity. A value of 1 implies no productivity difference between the two types of farmers. A high value means a low decrease in productivity. Both high values of
$\varepsilon _{y}\in (0,1)$
is a parameter that captures a reduction in land productivity. For the sake of simplicity, we assume a linear reduction in productivity. A value of 1 implies no productivity difference between the two types of farmers. A high value means a low decrease in productivity. Both high values of $\varepsilon _{p}$
and
$\varepsilon _{p}$
and $\varepsilon _{y}$
increase organic production. The organic production function is affected by a scale production factor given by the product
$\varepsilon _{y}$
increase organic production. The organic production function is affected by a scale production factor given by the product $(1+\varepsilon _{p})\varepsilon _{y}$
. For a given amount of water extracted, a high scale factor increases production. The value of this factor will be important in the derivation of our results. Let us added that revenues are maximised for
$(1+\varepsilon _{p})\varepsilon _{y}$
. For a given amount of water extracted, a high scale factor increases production. The value of this factor will be important in the derivation of our results. Let us added that revenues are maximised for $ w_{o} \leq \frac{\alpha }{\beta }$
.
$ w_{o} \leq \frac{\alpha }{\beta }$
.
Assuming a tax ( $\phi \geq 0$
) on individual withdrawals levied to fight a possible groundwater over-exploitation, the marginal cost of extraction for both type of farmers is:
$\phi \geq 0$
) on individual withdrawals levied to fight a possible groundwater over-exploitation, the marginal cost of extraction for both type of farmers is:
 \begin{equation} C_{w}=c_{0}-c_{1}H+\phi, \end{equation}
while $c_{0}\gt 0$
is the fixed cost and
$c_{0}\gt 0$
is the fixed cost and $c_{1}\gt 0$
the marginal cost with respect to the water table (see Gisser and Sanchez, Reference Gisser and Sanchez1980 and Kim et al., Reference Kim, Moore, Hanchar and Nieswiadomy1989). According to Rubio and Casino (Reference Rubio and Casino2001), the ratio
$c_{1}\gt 0$
the marginal cost with respect to the water table (see Gisser and Sanchez, Reference Gisser and Sanchez1980 and Kim et al., Reference Kim, Moore, Hanchar and Nieswiadomy1989). According to Rubio and Casino (Reference Rubio and Casino2001), the ratio $H_{\max }=\frac{c_{0}}{c_{1}}$
represents the maximum water level of the aquifer. Assuming a tax, denoted by
$H_{\max }=\frac{c_{0}}{c_{1}}$
represents the maximum water level of the aquifer. Assuming a tax, denoted by $\tau \geq 0$
, on the use of fertiliser,Footnote
2
the marginal cost of fertiliser for conventional farmers is:
$\tau \geq 0$
, on the use of fertiliser,Footnote
2
the marginal cost of fertiliser for conventional farmers is:
 \begin{equation} C_{z}=c_{2}+\tau, \end{equation}
with $c_{2}\gt 0$
, as in Erdlenbruch et al. (Reference Erdlenbruch, Tidball and Zaccour2014).
$c_{2}\gt 0$
, as in Erdlenbruch et al. (Reference Erdlenbruch, Tidball and Zaccour2014).
From Eqs. (4), (7), (8) and (9) the farmers operative profits are given by:
 \begin{equation} \begin{split} R_{o}& =Y_{o}-C_{w}w_{o}=\left ( \alpha w_{o}-\frac{\beta }{2} w_{o}^{2}\right ) (1+\varepsilon _{p})p\varepsilon _{y}-(c_{0}-c_{1}H+\phi )w_{o}, \\ R_{c}& =Y_{c}-C_{w}w_{c}-C_{z}z \\ & =\left ( \alpha w_{c}-\frac{\beta }{2}w_{c}^{2}+\gamma z-\frac{\delta }{2} z^{2}+\eta zw_{c}+\zeta \right ) p-(c_{0}-c_{1}H+\phi )w_{c}-(c_{2}+\tau )z. \end{split} \end{equation}
We assume that the use of fertiliser generates pollution that affects negatively both types of farmers. Since only conventional farmers in proportion $\left ( 1-x\right )$
of the population
$\left ( 1-x\right )$
of the population $N$
use fertilisers, the generated pollution is
$N$
use fertilisers, the generated pollution is $(1-x)Nz$
. However, we assume that pollution abatement expenditures, denoted by
$(1-x)Nz$
. However, we assume that pollution abatement expenditures, denoted by $D$
and financed by fertiliser’s taxation (
$D$
and financed by fertiliser’s taxation ( $D=\tau (1-x)Nz$
) can reduce pollution as in Erdlenbruch et al. (Reference Erdlenbruch, Tidball and Zaccour2014).Footnote
3
In our case the pollution abatement programme consists in cleaning water by eliminating metabolites from pollution residues or protect aquatic systems. As mentioned by Finger et al. (Reference Finger, Möhring, Dalhaus and Böcker2017), this re-use of tax revenues to internalise the external effects on contamination is observed in France, for instance. Following Borghesi et al. (Reference Borghesi, Giovannetti, Iannucci and Russu2019), we model the pollution as:
$D=\tau (1-x)Nz$
) can reduce pollution as in Erdlenbruch et al. (Reference Erdlenbruch, Tidball and Zaccour2014).Footnote
3
In our case the pollution abatement programme consists in cleaning water by eliminating metabolites from pollution residues or protect aquatic systems. As mentioned by Finger et al. (Reference Finger, Möhring, Dalhaus and Böcker2017), this re-use of tax revenues to internalise the external effects on contamination is observed in France, for instance. Following Borghesi et al. (Reference Borghesi, Giovannetti, Iannucci and Russu2019), we model the pollution as:
 \begin{equation*} P=\lambda (1-x)Nz-\sigma D, \end{equation*}
where $\lambda \gt 0$
measures the impact of fertilisers and
$\lambda \gt 0$
measures the impact of fertilisers and $\sigma \gt 0$
stands for the effectiveness of pollution abatement expenditures. Therefore, pollution can be rewritten as:
$\sigma \gt 0$
stands for the effectiveness of pollution abatement expenditures. Therefore, pollution can be rewritten as:
 \begin{equation} P=(\lambda -\sigma \tau )(1-x)Nz. \end{equation}
To ensure positive pollution, we set $\tau \leq \frac{\lambda }{\sigma }$
. We assume that pollution enters in damage functions that reduce directly profits (see, among others, Rezai et al., Reference Rezai, Foley and Taylor2012; Hackett and Moxnes, Reference Hackett and Moxnes2015; Dao et al., Reference Dao, Burghaus and Edenhofer2017; Antoci et al., Reference Antoci, Borghesi, Iannucci and Ticci2019):
$\tau \leq \frac{\lambda }{\sigma }$
. We assume that pollution enters in damage functions that reduce directly profits (see, among others, Rezai et al., Reference Rezai, Foley and Taylor2012; Hackett and Moxnes, Reference Hackett and Moxnes2015; Dao et al., Reference Dao, Burghaus and Edenhofer2017; Antoci et al., Reference Antoci, Borghesi, Iannucci and Ticci2019):
 \begin{equation} \begin{split} \Omega _{o}& =\frac{1}{1+\theta P\varepsilon _{v}}, \\ \Omega _{c}& =\frac{1}{1+\theta P}, \end{split} \end{equation}
where $\theta \gt 0$
measures the vulnerability to pollution for both types of farmers and
$\theta \gt 0$
measures the vulnerability to pollution for both types of farmers and $\varepsilon _{v}\gt 0$
. If
$\varepsilon _{v}\gt 0$
. If $\varepsilon _v\gt 1$
then the organic farming is more vulnerable, the opposite occurs if
$\varepsilon _v\gt 1$
then the organic farming is more vulnerable, the opposite occurs if $\varepsilon _v\lt 1$
.Footnote
4
$\varepsilon _v\lt 1$
.Footnote
4
This way of modelling the impact of pollution on farmers differs from Roseta-Palma (Reference Roseta-Palma2003) which assumes that pollution may impact their production function as it is the case of salinity effects for instance. Note, however, that in the numerical application of this paper, the effect of pollution on the production function is not considered. In Erdlenbruch et al. (Reference Erdlenbruch, Tidball and Zaccour2014) farmers are not impacted by pollution due to irrigation but it is assumed that this pollution may impact drinking water or dependent-groundwater ecosystems and this requires the intervention of a regulatory agency. Our choice to introduce a direct global effect on profits in the form of a negative externality remains a simplifying assumption.
We assume that farmers behave myopically since they are not forward looking and are unable to coordinate their choices. This implies that they take as given both the water table $H$
and the pollution externality given by the damage functions
$H$
and the pollution externality given by the damage functions $\Omega _{i}$
, with
$\Omega _{i}$
, with $i\in \{o,c\}$
. See Pereau et al. (Reference Pereau, Mouysset and Doyen2018), Pereau (Reference Pereau2020), Biancardi et al. (Reference Biancardi, Iannucci and Villani2022a Reference Biancardi, Iannucci and Villani,b) for examples of the first assumption on groundwater management models, and see Antoci et al. (Reference Antoci, Russu, Sordi and Ticci2014, Reference Antoci, Galeotti, Iannucci and Russu2015), Borghesi et al. (Reference Borghesi, Giovannetti, Iannucci and Russu2019), Iannucci et al. (Reference Iannucci, Martellozzo and Randelli2022) for examples of the second assumption on second-best growth models with negative externalities. The maximisation problems of the farmer’s profit (taking into account the negative impact of pollution) are:
$i\in \{o,c\}$
. See Pereau et al. (Reference Pereau, Mouysset and Doyen2018), Pereau (Reference Pereau2020), Biancardi et al. (Reference Biancardi, Iannucci and Villani2022a Reference Biancardi, Iannucci and Villani,b) for examples of the first assumption on groundwater management models, and see Antoci et al. (Reference Antoci, Russu, Sordi and Ticci2014, Reference Antoci, Galeotti, Iannucci and Russu2015), Borghesi et al. (Reference Borghesi, Giovannetti, Iannucci and Russu2019), Iannucci et al. (Reference Iannucci, Martellozzo and Randelli2022) for examples of the second assumption on second-best growth models with negative externalities. The maximisation problems of the farmer’s profit (taking into account the negative impact of pollution) are:
 \begin{equation} \begin{split} \max _{0\leq w_{o}\leq \frac{\alpha }{\beta }}\pi _{o}=& \left [ \left ( \alpha w_{o}-\frac{\beta }{2}w_{o}^{2}\right ) (1+\varepsilon _{p})p\varepsilon _{y}-(c_{0}-c_{1}H+\phi )w_{o}\right ] \Omega _{o}, \\ \max _{\substack{ 0\leq w_{c}\leq \frac{\alpha }{\beta } \\ 0\leq z\leq \frac{ \gamma }{\delta }}}\pi _{c}=& \left [ \left ( \alpha w_{c}-\frac{\beta }{2} w_{c}^{2}+\gamma z-\frac{\delta }{2}z^{2}+\eta zw_{c}+\zeta \right ) p-(c_{0}-c_{1}H+\phi )w_{c}-(c_{2}+\tau )z\right ] \Omega _{c}. \end{split} \end{equation}
The first order conditions yield constraints on the water table and the two taxes on water and fertiliser to ensure non-negative values for the decision variables.
Proposition 1.
If $H\gt \widehat{H}_{o}$
and
$H\gt \widehat{H}_{o}$
and $\phi \lt \widehat{\phi }_{o}$
, then
$\phi \lt \widehat{\phi }_{o}$
, then
 \begin{equation} w_{o}^{\ast }=\frac{(1+\varepsilon _{p})\alpha p\varepsilon _{y}-c_{0}+c_{1}H-\phi }{(1+\varepsilon _{p})\beta p\varepsilon _{y}}, \end{equation}
otherwise, namely if $H\leq \widehat{H}_{o}$
and
$H\leq \widehat{H}_{o}$
and $\phi \geq \widehat{\phi } _{o}$
,
$\phi \geq \widehat{\phi } _{o}$
, $w_{o}^{\ast }=0$
, where
$w_{o}^{\ast }=0$
, where
 \begin{equation*} \begin{split} \widehat{H}_{o}=& \;\max \left \{ 0,\;[c_{0}+\phi -(1+\varepsilon _{p})\alpha p\varepsilon _{y}]\frac{1}{c_{1}}\right \}, \\ \widehat{\phi }_{o}=& \;(1+\varepsilon _{p})\alpha p\varepsilon _{y}. \end{split} \end{equation*}
If $H\gt \widehat{H}_{c}$
,
$H\gt \widehat{H}_{c}$
, $\phi \lt \widehat{\phi }_{c}$
, and
$\phi \lt \widehat{\phi }_{c}$
, and $\tau \lt \widehat{ \tau }_{c}$
, then
$\tau \lt \widehat{ \tau }_{c}$
, then
 \begin{equation} w_{c}^{\ast }=\frac{(\alpha p-c_{0}+c_{1}H-\phi )\delta +(\gamma p-c_{2}-\tau )\eta }{(\beta \delta -\eta ^{2})p}, \end{equation}
otherwise, namely if $H\leq \widehat{H}_{c}$
,
$H\leq \widehat{H}_{c}$
, $\phi \geq \widehat{\phi }_{c}$
, and
$\phi \geq \widehat{\phi }_{c}$
, and $\tau \geq \widehat{\tau }_{c}$
,
$\tau \geq \widehat{\tau }_{c}$
, $w_{c}^{\ast }=0$
, where
$w_{c}^{\ast }=0$
, where
 \begin{equation*} \begin{split} \widehat{H}_{c}=& \;\max \left \{ 0,\;[(c_{0}+\phi -\alpha p)\delta -(\gamma p-c_{2}-\tau )\eta ]\frac{1}{\delta c_{1}}\right \}, \\ \widehat{\phi }_{c}=& \;[(\gamma p-c_{2}-\tau )\eta +\alpha p\delta ]\frac{1}{\delta }, \\ \widehat{\tau }_{c}=& \;[(\gamma p-c_{2})\eta +\alpha p\delta ]\frac{1}{\eta }. \end{split} \end{equation*}
If $H\gt \widehat{H}_{z}$
,
$H\gt \widehat{H}_{z}$
, $\phi \lt \widehat{\phi }_{z}$
, and
$\phi \lt \widehat{\phi }_{z}$
, and $\tau \lt \widehat{ \tau }_{z}$
, then
$\tau \lt \widehat{ \tau }_{z}$
, then
 \begin{equation} z^{\ast }=\frac{(\alpha p-c_{0}+c_{1}H-\phi )\eta +(\gamma p-c_{2}-\tau )\beta }{(\beta \delta -\eta ^{2})p}, \end{equation}
otherwise, namely if $H\leq \widehat{H}_{z}$
,
$H\leq \widehat{H}_{z}$
, $\phi \geq \widehat{\phi }_{z}$
, and
$\phi \geq \widehat{\phi }_{z}$
, and $\tau \geq \widehat{\tau }_{z}$
,
$\tau \geq \widehat{\tau }_{z}$
, $z^{\ast }=0$
, where
$z^{\ast }=0$
, where
 \begin{equation*} \begin{split} \widehat{H}_{z}=& \;\max \left \{ 0,\;[(c_{0}+\phi -\alpha p)\eta -(\gamma p-c_{2}-\tau )\beta ]\frac{1}{\eta c_{1}}\right \}, \\ \widehat{\phi }_{z}=& \;[(\gamma p-c_{2}-\tau )\beta +\alpha p\eta ]\frac{1}{ \eta }, \\ \widehat{\tau }_{z}=& \;[(\gamma p-c_{2})\beta +\alpha p\eta ]\frac{1}{\beta }. \end{split} \end{equation*}
Notice that if $p\gt \frac{c_{2}}{\gamma }$
then
$p\gt \frac{c_{2}}{\gamma }$
then $\widehat{\phi }_c$
,
$\widehat{\phi }_c$
, $\widehat{ \tau }_c$
,
$\widehat{ \tau }_c$
, $\widehat{\phi }_z$
, and
$\widehat{\phi }_z$
, and $\widehat{\tau }_z$
are always positive. From Eq. (16) we obtain the following corollary.
$\widehat{\tau }_z$
are always positive. From Eq. (16) we obtain the following corollary.
Corollary 1.
The conditions $H\gt \widehat{H}$
,
$H\gt \widehat{H}$
, $\phi \lt \widehat{\phi }$
, and
$\phi \lt \widehat{\phi }$
, and $\tau \lt \widehat{ \tau }$
guarantee positive values of
$\tau \lt \widehat{ \tau }$
guarantee positive values of $w_{o}^{\ast }$
,
$w_{o}^{\ast }$
, $w_{c}^{\ast }$
,
$w_{c}^{\ast }$
, $ z^{\ast }$
, and
$ z^{\ast }$
, and $P$
, where
$P$
, where $\widehat{H} =\max \left \{ \widehat{H}_{o},\widehat{H}_{c},\widehat{H}_{z}\right \}$
,
$\widehat{H} =\max \left \{ \widehat{H}_{o},\widehat{H}_{c},\widehat{H}_{z}\right \}$
, $\widehat{\phi }=\min \left \{ \widehat{\phi }_{o},\widehat{\phi }_{c},\widehat{\phi }_{z}\right \}$
, and
$\widehat{\phi }=\min \left \{ \widehat{\phi }_{o},\widehat{\phi }_{c},\widehat{\phi }_{z}\right \}$
, and $ \widehat{\tau } =\min \left \{ \frac{\lambda }{\sigma },\widehat{\tau }_{c},\widehat{\tau }_{z}\right \}$
.
$ \widehat{\tau } =\min \left \{ \frac{\lambda }{\sigma },\widehat{\tau }_{c},\widehat{\tau }_{z}\right \}$
.
Using Eqs. (14), (15) and (16), comparative static results in Table 1 show that concerning the parameters of the production function, the water and fertiliser inputs for conventional farmers increase with $\alpha$
and
$\alpha$
and $\eta$
but decrease with
$\eta$
but decrease with $\beta$
and
$\beta$
and $\delta$
, except for organic farmers which don’t use fertiliser. A rise in the fixed cost
$\delta$
, except for organic farmers which don’t use fertiliser. A rise in the fixed cost $ c_{0}$
decreases water pumping and fertiliser which are complementary inputs while a rise in the marginal cost
$ c_{0}$
decreases water pumping and fertiliser which are complementary inputs while a rise in the marginal cost $c_{1}$
increases input uses for a given value of the water table since costs of water abstraction are reduced. A higher water table and a higher price for the agricultural good increase input uses. For organic farmers a rise in the price premium
$c_{1}$
increases input uses for a given value of the water table since costs of water abstraction are reduced. A higher water table and a higher price for the agricultural good increase input uses. For organic farmers a rise in the price premium $\varepsilon _{p}$
and a higher productivity
$\varepsilon _{p}$
and a higher productivity $\varepsilon _{y}$
increase water pumping. A rise in the water tax
$\varepsilon _{y}$
increase water pumping. A rise in the water tax $\phi$
decreases water pumping for all farmers and the use of fertilisers while an increase in the fertiliser tax
$\phi$
decreases water pumping for all farmers and the use of fertilisers while an increase in the fertiliser tax $ \tau$
reduces both water and fertiliser uses. It shows that only the use of fertiliser tax can favour conversion. Since pollution is an externality, input uses doesn’t depend on the organic production vulnerability coefficient given by
$ \tau$
reduces both water and fertiliser uses. It shows that only the use of fertiliser tax can favour conversion. Since pollution is an externality, input uses doesn’t depend on the organic production vulnerability coefficient given by $\varepsilon _{v}$
.
$\varepsilon _{v}$
.
Summary of comparative statics results: ↑ (↓,−) refers to a positive (negative, nil) relationship

Comparing the amount of water pumping by organic and conventional farmers Eqs. (14)–(15) in Eq. (16) yields Eq. (17).
Proposition 2. An organic farmer pumps more (less) water than a conventional one if the organic scale production factor is relatively high (low). It holds:
 \begin{equation} \begin{split} & w_{0}^{\ast }-w_{c}^{\ast }\geq 0\;\;\;\text{if}\;\;\;(1+\varepsilon _{p})\varepsilon _{y}\geq \Gamma, \\ & w_{0}^{\ast }-w_{c}^{\ast }\leq 0\;\;\;\text{if}\;\;\;(1+\varepsilon _{p})\varepsilon _{y}\leq \Gamma, \end{split} \end{equation}
where $\Gamma =\frac{(\beta \delta -\eta ^{2})(c_{0}-c_{1}H+\phi )}{ (c_{0}-c_{1}H+\phi )\beta \delta -[\alpha p\eta +(\gamma p-c_{2}-\tau )\beta ]\eta }$
.
$\Gamma =\frac{(\beta \delta -\eta ^{2})(c_{0}-c_{1}H+\phi )}{ (c_{0}-c_{1}H+\phi )\beta \delta -[\alpha p\eta +(\gamma p-c_{2}-\tau )\beta ]\eta }$
.
Eq. (17) gives a condition on organic scale production factor which is given by the product of coefficients $\varepsilon _{y}$
and
$\varepsilon _{y}$
and $\varepsilon _{p}$
in Eq. (7). This condition is more likely to be satisfied when the organic farmer is productive and profitable meaning a low decrease in productivity due to organic production and/or a high price premium (a high value of
$\varepsilon _{p}$
in Eq. (7). This condition is more likely to be satisfied when the organic farmer is productive and profitable meaning a low decrease in productivity due to organic production and/or a high price premium (a high value of $\varepsilon _{y}$
and/or
$\varepsilon _{y}$
and/or $\varepsilon _{p}$
). On the contrary when the scale factor is relatively low due to a low productivity and a low profitability, organic farmers pump less and also produce less. Let us remark that the threshold
$\varepsilon _{p}$
). On the contrary when the scale factor is relatively low due to a low productivity and a low profitability, organic farmers pump less and also produce less. Let us remark that the threshold $\Gamma$
is a decreasing function of the fertiliser tax
$\Gamma$
is a decreasing function of the fertiliser tax $\tau$
and the withdrawal tax
$\tau$
and the withdrawal tax $\phi$
, and is maximum when both taxes are zero.Footnote
5
Hence, higher values of
$\phi$
, and is maximum when both taxes are zero.Footnote
5
Hence, higher values of $\tau$
or
$\tau$
or $ \phi$
will make the condition
$ \phi$
will make the condition $w_{0}^{\ast }-w_{c}^{\ast }\geq 0$
more easy to be satisfied since
$w_{0}^{\ast }-w_{c}^{\ast }\geq 0$
more easy to be satisfied since $\Gamma$
is reduced.
$\Gamma$
is reduced.
According to the first order conditions, we can rewrite the optimal profits as:
 \begin{equation} \begin{split} \pi _{o}^{\ast }(H,x)& =R_{o}^{\ast }\Omega _{o}^{\ast }=\frac{ (1+\varepsilon _{p})p\varepsilon _{y}\frac{\beta }{2}(w_{o}^{\ast })^{2}}{ 1+(\lambda -\sigma \tau )(1-x)N\theta z^{\ast }\varepsilon _{v}}, \\ \pi _{c}^{\ast }(H,x)& =R_{c}^{\ast }\Omega _{c}^{\ast }=\frac{\left [ \frac{ \beta }{2}(w_{c}^{\ast })^{2}+\frac{\delta }{2}(z^{\ast })^{2}-\eta z^{\ast }w_{c}^{\ast }+\zeta \right ] p}{1+(\lambda -\sigma \tau )(1-x)N\theta z^{\ast }}. \end{split} \end{equation}
The next section analyses the evolutionary dynamics of farmers’ behaviour on the basis of their profits Eq. (18).
3. Evolutionary dynamics
This section aims at endogenising the choice of being organic and conventional through the well-know replicator dynamics (see Hofbauer and Sigmund, Reference Hofbauer and Sigmund2003 for an introduction to evolutionary dynamics and Antoci et al., Reference Antoci, Borghesi and Sodini2017 and Biancardi et al., Reference Biancardi, Iannucci and Villani2022a for applications to water issues). As we focus on steady state equilibria, adding switching costs from conventional to organic farming will not change our results. The time evolution of the share of the organic farmer is:
 \begin{equation} \dot{x}=x(1-x)[\pi _{o}^{\ast }(H,x)-\pi _{c}^{\ast }(H,x)], \end{equation}
where $\dot{x}=x^{\prime }(t)$
. Eq. (19) admits two types of steady states: corner (if
$\dot{x}=x^{\prime }(t)$
. Eq. (19) admits two types of steady states: corner (if $x\in \{0,1\}$
) and inner (if
$x\in \{0,1\}$
) and inner (if $x\in (0,1)$
). A steady state is a Nash equilibrium only if it is stable (Bomze, Reference Bomze1986) . Therefore, if a corner steady state is stable then it is a pure Nash equilibrium, while if an inner steady state is stable then it is a mixed-strategy Nash equilibrium. It holds
$x\in (0,1)$
). A steady state is a Nash equilibrium only if it is stable (Bomze, Reference Bomze1986) . Therefore, if a corner steady state is stable then it is a pure Nash equilibrium, while if an inner steady state is stable then it is a mixed-strategy Nash equilibrium. It holds $\dot{H}=0$
along the isocline
$\dot{H}=0$
along the isocline
 \begin{equation} x=\frac{R-(1-\mu )Nw_{c}^{\ast }}{(1-\mu )(w_{o}^{\ast }-w_{c}^{\ast })N}. \end{equation}
Conversely, it holds $\dot{x}=0$
if
$\dot{x}=0$
if $x\in \{0,1\}$
or along the isocline
$x\in \{0,1\}$
or along the isocline
 \begin{equation} \begin{split} x=& \;1+\frac{R_{o}^{\ast }-R_{c}^{\ast }}{(R_{o}^{\ast }-R_{c}^{\ast }\varepsilon _{v})(\lambda -\sigma \tau )\theta Nz^{\ast }} \\ =& \;1+\frac{(1+\varepsilon _{p})p\varepsilon _{y}\frac{\beta }{2} (w_{o}^{\ast })^{2}-\left [ \frac{\beta }{2}(w_{c}^{\ast })^{2}+\frac{\delta }{2}(z^{\ast })^{2}-\eta z^{\ast }w_{c}^{\ast }+\zeta \right ] p}{\left \{ (1+\varepsilon _{p})p\varepsilon _{y}\frac{\beta }{2}(w_{o}^{\ast })^{2}-\left [ \frac{\beta }{2}(w_{c}^{\ast })^{2}+\frac{\delta }{2}(z^{\ast })^{2}-\eta z^{\ast }w_{c}^{\ast }+\zeta \right ] p\varepsilon _{v}\right \} (\lambda -\sigma \tau )\theta Nz^{\ast }}. \end{split} \end{equation}
Under dynamical system Eqs. (3)–(19) three types of steady states may be observed in the plane $(H,x)$
:
$(H,x)$
:
-
• the point $E_{c}=(H_{c},0)$
, with
$H_{c}=\left [ \frac{(\beta \delta -\eta ^{2})p}{(1-\mu )\delta Nc_{1}}\right ] \left \{ R-(1-\mu )\left [ \frac{ (\alpha p-c_{0}-\phi )\delta +(\gamma p-c_{2}-\tau )\eta }{(\beta \delta -\eta ^{2})p}\right ] N\right \}$
, in which all the farmers are conventional,
$E_{c}=(H_{c},0)$
, with
$H_{c}=\left [ \frac{(\beta \delta -\eta ^{2})p}{(1-\mu )\delta Nc_{1}}\right ] \left \{ R-(1-\mu )\left [ \frac{ (\alpha p-c_{0}-\phi )\delta +(\gamma p-c_{2}-\tau )\eta }{(\beta \delta -\eta ^{2})p}\right ] N\right \}$
, in which all the farmers are conventional, -
• the point
$E_o=(H_o,1)$
with
$H_o=\left [\frac{(1+\varepsilon _p)p\beta \varepsilon _y}{(1-\mu )Nc_1}\right ]\left \lbrace R-(1-\mu )\left [\frac{ (1+\varepsilon _p)\alpha p\varepsilon _y-c_0-\phi }{(1+\varepsilon _p)p\beta \varepsilon _y}\right ]N\right \rbrace$
, in which all the farmers are organic, -
• points given by the intersection of the two isoclines Eqs. (20) and (21) in which both types of farmers may coexist.


The system Eqs. (3)–(19) is defined in the set:
 \begin{equation} \Phi =\{(H,x)\,:\,\underline{H}\leq H\leq \overline{H},\;0\leq x\leq 1\}. \end{equation}
where $\underline{H}=\max \left \{ \widehat{H},\;H_{c},\;H_{o}\right \}$
and
$\underline{H}=\max \left \{ \widehat{H},\;H_{c},\;H_{o}\right \}$
and $ \overline{H}=\min \left \{ \frac{c_{0}}{c_{1}},\;H_{c},\;H_{o}\right \}$
.
$ \overline{H}=\min \left \{ \frac{c_{0}}{c_{1}},\;H_{c},\;H_{o}\right \}$
.
At the two extreme steady state $E_{c}$
and
$E_{c}$
and $E_{o}$
, let us remark that the individual water pumping for both type of farmers are the same
$E_{o}$
, let us remark that the individual water pumping for both type of farmers are the same
 \begin{equation*} w_{c}^{\ast }=w_{o}^{\ast }=\frac {R}{\left ( 1-\mu \right ) N}, \end{equation*}
according to Eq. (2). The level of fertiliser use at steady state $E_{c}$
is
$E_{c}$
is
 \begin{equation*} z_{c}^{\ast }=\frac {R\eta p+\left ( 1-\mu \right ) \left ( \gamma -c_{2}-\tau \right ) N}{\left ( 1-\mu \right ) N\delta p}, \end{equation*}
and zero at steady state $E_{o}$
since all farmers are organic.
$E_{o}$
since all farmers are organic.
While the steady states $E_{c}$
and
$E_{c}$
and $E_{o}$
always exist, Proposition3 shows the conditions under which an inner steady state exists.
$E_{o}$
always exist, Proposition3 shows the conditions under which an inner steady state exists.
Proposition 3.
An inner steady state exists if $R_{o}^{\ast }-R_{c}^{\ast }\gt 0$
,
$R_{o}^{\ast }-R_{c}^{\ast }\gt 0$
, $ \varepsilon _{v}\gt \frac{R_{o}^{\ast }}{R_{c}^{\ast }}$
,
$ \varepsilon _{v}\gt \frac{R_{o}^{\ast }}{R_{c}^{\ast }}$
, $w_{o}^{\ast }\gt \frac{R}{(1-\mu )N}$
, and
$w_{o}^{\ast }\gt \frac{R}{(1-\mu )N}$
, and
-
• for
$w_{o}^{\ast }-w_{c}^{\ast }\gt 0$
if
$w_{c}^{\ast }\lt \frac{R}{(1-\mu )N}$
, -
• for
$w_{o}^{\ast }-w_{c}^{\ast }\lt 0$
if
$w_{c}^{\ast }\gt \frac{R}{(1-\mu )N}$
.


Moreover, the isocline $\dot{H}=0$
has negative slope if
$\dot{H}=0$
has negative slope if $w_{o}^{\ast }-w_{c}^{\ast }\gt 0$
and so
$w_{o}^{\ast }-w_{c}^{\ast }\gt 0$
and so $H_{c}\gt H_{o}$
, while it has positive slope if
$H_{c}\gt H_{o}$
, while it has positive slope if $ w_{o}^{\ast }-w_{c}^{\ast }\lt 0$
and so
$ w_{o}^{\ast }-w_{c}^{\ast }\lt 0$
and so $H_{c}\lt H_{o}$
. Finally, the isocline
$H_{c}\lt H_{o}$
. Finally, the isocline $ \dot{H}=0$
is not defined for
$ \dot{H}=0$
is not defined for $w_o^\ast -w_c^\ast =0$
.
$w_o^\ast -w_c^\ast =0$
.
Proposition3 states the existence conditions of an inner state. Firstly, at an inner steady state optimal profits for both types of farmers taking into account the environmental externality have to be equal but as organic farmers are more vulnerable to pollution, it implies that their operative profits (net of the externality) have to be higher than the ones of conventional farmers. Secondly, the vulnerability coefficient has to be greater than the ratio of the operative profits, namely the organic farming has to be more vulnerable than the conventional one. Lastly, the water use of an organic farmer has to be higher than the steady state water pumping given by Eq. (2). However, depending if the water use of a conventional farmer is above or below this steady state water pumping, the organic farmer will pump more or less water than the conventional one. It turns out that when organic farmers pump more than conventional farmers, the level of the water table at the steady state in which all the farmers are organic will be lower than the steady state when all farmers are conventional. It shows that the decrease in fertiliser use can be done only at the expense of a decrease in the water table.
Although the existence of inner steady states has been proved, it is not possible to compute analytically the number of them, hence a stability analysis is performed. The following proposition holds.
PROPOSITION 4. Two scenarios may arise:
-
• if
$w_{o}^{\ast }-w_{c}^{\ast }\gt 0$
, it may exist a mixed-strategy Nash equilibrium and so the coexistence between the two types of farmers is possible;
-
• if
$w_o^\ast -w_c^\ast \lt 0$
, the Nash equilibrium is always in pure strategies and so the market will be composed of only one type of farmers.


Proposition4 shows that when organic farmers pump more than conventional ones, three configurations can emerge. All farmers can be conventional or organic but a coexistence of the two types of farmer is also possible. However when conventional farmers pump more than organic farmers a stable inner steady state is not possible. In that case the steady state with only organic farmers implies a higher water table than conventional farmers. However, according to Eq. (17), this last case is less likely to occur since organic farmers are less productive and profitable. The coexistence of the two types of farmers requires a low gap in terms of land productivity between organic and conventional farmers together with a high price premium.
4. Policy implications
This section studies the behaviour of the model through numerical simulations. Aquifer area $AS$
, natural recharge
$AS$
, natural recharge $R$
, return flow coefficient
$R$
, return flow coefficient $\mu$
, maximum water level
$\mu$
, maximum water level $H_{\max}$
, intercept of the demand for water
$H_{\max}$
, intercept of the demand for water $g$
, slope of the demand for water
$g$
, slope of the demand for water $k$
, intercept of the pumping cost
$k$
, intercept of the pumping cost $c_0$
, and slope of the pumping cost
$c_0$
, and slope of the pumping cost $c_1$
, are from Western La Mancha aquifer data, widely used in the literature (see, among others, Esteban and Albiac, Reference Esteban and Albiac2011; Pereau et al., Reference Pereau, Pryet and Rambonilaza2019). Since farmers behave myopically, the number of farmers is large, namely
$c_1$
, are from Western La Mancha aquifer data, widely used in the literature (see, among others, Esteban and Albiac, Reference Esteban and Albiac2011; Pereau et al., Reference Pereau, Pryet and Rambonilaza2019). Since farmers behave myopically, the number of farmers is large, namely $N=500$
. The value of the price of the crop
$N=500$
. The value of the price of the crop $p$
is from Roseta-Palma (Reference Roseta-Palma2003) and Erdlenbruch et al. (Reference Erdlenbruch, Tidball and Zaccour2014), the two main reference papers. The water coefficients are an adaptation of the La Mancha data to production function, namely
$p$
is from Roseta-Palma (Reference Roseta-Palma2003) and Erdlenbruch et al. (Reference Erdlenbruch, Tidball and Zaccour2014), the two main reference papers. The water coefficients are an adaptation of the La Mancha data to production function, namely $\beta =\frac{N}{kp}$
and
$\beta =\frac{N}{kp}$
and $\alpha =\frac{g\beta }{N}$
. To save the same inputs proportion of Roseta-Palma (Reference Roseta-Palma2003) and Erdlenbruch et al. (Reference Erdlenbruch, Tidball and Zaccour2014), the fertiliser coefficients are
$\alpha =\frac{g\beta }{N}$
. To save the same inputs proportion of Roseta-Palma (Reference Roseta-Palma2003) and Erdlenbruch et al. (Reference Erdlenbruch, Tidball and Zaccour2014), the fertiliser coefficients are $\gamma =\frac{\alpha }{3}$
and
$\gamma =\frac{\alpha }{3}$
and $\delta =\frac{\beta }{6}$
. The other parameters of the production functions
$\delta =\frac{\beta }{6}$
. The other parameters of the production functions $\eta$
and
$\eta$
and $\zeta$
are from Roseta-Palma (Reference Roseta-Palma2003) and Erdlenbruch et al. (Reference Erdlenbruch, Tidball and Zaccour2014), as well as the fertiliser cost
$\zeta$
are from Roseta-Palma (Reference Roseta-Palma2003) and Erdlenbruch et al. (Reference Erdlenbruch, Tidball and Zaccour2014), as well as the fertiliser cost $c_2$
. According to the meta-analysis mentioned in the introduction (Seufert et al., Reference Seufert, Ramankutty and Foley2012; Crowder and Reganold, Reference Crowder and Reganold2015; Ponisio et al., Reference Ponisio, M’Gonigle, Mace, Palomino, De Valpine and Kremen2015), we assume a 35% price premium given by
$c_2$
. According to the meta-analysis mentioned in the introduction (Seufert et al., Reference Seufert, Ramankutty and Foley2012; Crowder and Reganold, Reference Crowder and Reganold2015; Ponisio et al., Reference Ponisio, M’Gonigle, Mace, Palomino, De Valpine and Kremen2015), we assume a 35% price premium given by $\varepsilon _p$
and a lower productivity of 20%, implying a value of 0.8 for
$\varepsilon _p$
and a lower productivity of 20%, implying a value of 0.8 for $\varepsilon _y$
.
$\varepsilon _y$
.
It is well known that organic agriculture causes fewer negative environmental externalities than conventional agriculture (Shepherd et al., Reference Shepherd, Pearce, Cormack, Philipps, Cuttle, Bhogal, Costigan and Unwin2003; Gomiero et al., Reference Gomiero, Pimentel and Paoletti2011). Non-use of synthetic fertilisers is generally associated with lower nutrient leaching. With organic farming the risk of pesticide pollution of water bodies is also lower. While these benefits are difficult to estimate at the firm level, it is also difficult to measure how organic but also conventional farmers are exposed to the pollution created by the latter. We set the value of the negative externality $\theta$
for all farmers to
$\theta$
for all farmers to $0.5$
and we consider a greater pollution vulnerability of 50% for organic farmers, i.e.,
$0.5$
and we consider a greater pollution vulnerability of 50% for organic farmers, i.e., $\varepsilon _{v}=1.5$
. This value is chosen to satisfy condition in Proposition3 which ensures a mixed market and the coexistence of organic and conventional farmers. By definition
$\varepsilon _{v}=1.5$
. This value is chosen to satisfy condition in Proposition3 which ensures a mixed market and the coexistence of organic and conventional farmers. By definition $\varepsilon _{v}$
is strictly greater than the ratio of the operative payoffs (without taking into account the evironmental externality) of the organic farmers on the conventional farmers.
$\varepsilon _{v}$
is strictly greater than the ratio of the operative payoffs (without taking into account the evironmental externality) of the organic farmers on the conventional farmers.
Finally, the fertiliser impact parameter $\lambda$
, the abatement efficiency
$\lambda$
, the abatement efficiency $\sigma$
, the tax on withdrawals
$\sigma$
, the tax on withdrawals $\phi$
and on fertliser
$\phi$
and on fertliser $\tau$
are chosen to ensure the non negativity of
$\tau$
are chosen to ensure the non negativity of $w_o^\ast$
,
$w_o^\ast$
, $w_c^\ast$
,
$w_c^\ast$
, $z^\ast$
,
$z^\ast$
, $P^\ast$
, and the existence of a stable inner steady state in the set
$P^\ast$
, and the existence of a stable inner steady state in the set $\Phi$
(see Eq. (22)).
$\Phi$
(see Eq. (22)).
All parameter values are shown in Table 2. The results of the numerical illustration should be treated with caution due to the model’s underlying assumptions: same crop for both types of farmer, same pumping costs, no conversion costs. In addition, we don’t set any initial conditions for the share of organic farmers.
Parameter values

Using Western La Mancha data, it can be show that:
Remark 1.
Organic farmers pump more than conventional farmers $w_o^\ast -w_c^\ast \gt 0$
as the value of
$w_o^\ast -w_c^\ast \gt 0$
as the value of $\Gamma$
in Eq. (17) is very low (
$\Gamma$
in Eq. (17) is very low ( $\approx 1$
) and this happens also if
$\approx 1$
) and this happens also if $\phi =0$
and
$\phi =0$
and $\tau =0$
as shown in Fig. 1.
$\tau =0$
as shown in Fig. 1.
However, the scenario $w_o^\ast -w_c^\ast \gt 0$
is the most interesting from an economic point of view, since it admits a mixed-strategy Nash equilibrium and a mixed market. In the contrary case, the coexistence of both farmers is not possible as shown in Proposition4.
$w_o^\ast -w_c^\ast \gt 0$
is the most interesting from an economic point of view, since it admits a mixed-strategy Nash equilibrium and a mixed market. In the contrary case, the coexistence of both farmers is not possible as shown in Proposition4.
Value of the threshold $\Gamma$
as a function of the water table
$\Gamma$
as a function of the water table $H$
with
$H$
with $ \phi = \tau =0$
.
$ \phi = \tau =0$
.

4.1 Comparative dynamics
This section analyses the properties of the model by changing the values of the fertiliser tax $\tau$
for a given value of the withdrawal tax
$\tau$
for a given value of the withdrawal tax $\phi$
equal to 5000
$\phi$
equal to 5000 $\unicode{x20AC}$
/Mm
$\unicode{x20AC}$
/Mm $^{3}$
. Fig. 2 shows that for a fertiliser tax equal to 13,500
$^{3}$
. Fig. 2 shows that for a fertiliser tax equal to 13,500 $\unicode{x20AC}/{\rm tons}$
all farmers will be conventional but for a higher tax equal to 14,400
$\unicode{x20AC}/{\rm tons}$
all farmers will be conventional but for a higher tax equal to 14,400 $\unicode{x20AC}/{\rm tons}$
all farmers can be organic. For an intermediate tax equal to 13,750
$\unicode{x20AC}/{\rm tons}$
all farmers can be organic. For an intermediate tax equal to 13,750 $\unicode{x20AC}/{\rm tons}$
an inner steady state with both types of farmers exists. As shown in Proposition4 the water table when all farmers are organic,
$\unicode{x20AC}/{\rm tons}$
an inner steady state with both types of farmers exists. As shown in Proposition4 the water table when all farmers are organic, $H_{o}=567$
m, is lower than the water table when all farmers are conventional,
$H_{o}=567$
m, is lower than the water table when all farmers are conventional, $H_{c}=576$
m.
$H_{c}=576$
m.
Dynamic regimes. Parameter values: $\varepsilon _p=0.35$
,
$\varepsilon _p=0.35$
, $\varepsilon _y=0.8$
, for the other ones see Table 2.
$\varepsilon _y=0.8$
, for the other ones see Table 2.

Fig. 3a shows that the proportion of organic farmers increases and the water table decreases from $H_{c}$
meters to
$H_{c}$
meters to $H_{o}$
meters with the amount of the fertiliser tax from
$H_{o}$
meters with the amount of the fertiliser tax from $\tau =13,600$
to
$\tau =13,600$
to $\tau =14,400$
for a fixed value of
$\tau =14,400$
for a fixed value of $(1+\varepsilon _{p})\varepsilon _{y}=1.08$
. Fig. 3b shows the same pattern when the product of
$(1+\varepsilon _{p})\varepsilon _{y}=1.08$
. Fig. 3b shows the same pattern when the product of $(1+\varepsilon _{p})\varepsilon _{y}$
varies from
$(1+\varepsilon _{p})\varepsilon _{y}$
varies from $1.075$
to
$1.075$
to $1.125$
for a fixed value of
$1.125$
for a fixed value of $\tau =13,750$
.
$\tau =13,750$
.
Comparative dynamics. The parameters are the same of Fig. 2c.

Welfare analysis. The parameters are the same of Fig. 2c.

4.2 Welfare analysis
The welfare function is defined as the sum of the two net payoffs taking into account the impact of pollution and the revenues of the tax water denoted as $WTR$
:
$WTR$
:
 \begin{equation} WF^\ast =x^\ast N \pi _o^\ast +(1-x^\ast )N\pi _c^\ast +WTR^\ast \end{equation}
with $WTR^\ast =[x^\ast Nw_o^\ast +(1-x^\ast )Nw_c^\ast ]\phi$
. The fertiliser tax revenues are included in the net profits since the water agency uses it to abate pollution (see Eq. (11)).
$WTR^\ast =[x^\ast Nw_o^\ast +(1-x^\ast )Nw_c^\ast ]\phi$
. The fertiliser tax revenues are included in the net profits since the water agency uses it to abate pollution (see Eq. (11)).
Fig. 4a shows a positive relationship between total welfare and fertiliser tax. Fig. 4c provides a decomposition of the different elements of total welfare and shows that a rise in $\tau$
increases the payoff of the organic farmers and the revenues of the water tax but decreases the payoff of conventional farmers. It means that since pollution is decreasing with the tax, the decrease in the gross payoff of the conventional farmers is greater than the decrease in pollution. Fig. 4b and d show a similar pattern concerning the net payoffs for a fixed value of
$\tau$
increases the payoff of the organic farmers and the revenues of the water tax but decreases the payoff of conventional farmers. It means that since pollution is decreasing with the tax, the decrease in the gross payoff of the conventional farmers is greater than the decrease in pollution. Fig. 4b and d show a similar pattern concerning the net payoffs for a fixed value of $\tau =13750$
. However, the pattern of total welfare follows the evolution of the revenues of the water tax.
$\tau =13750$
. However, the pattern of total welfare follows the evolution of the revenues of the water tax.
5. Conclusion
This article has analysed the management of aquifer by two types of farmers, organic and conventional, who differ in terms of productivity, profitability and pollution vulnerability. Organic farmers are less productive with smaller production, since they are not allowed to use chemical fertilisers, more vulnerable to pollution but able to sell their agricultural goods to a higher price. We have considered a regulatory agency aims at favouring organic agriculture and reduce the use of fertiliser by implementing a tax which revenues are used to mitigate pollution. In an evolutionary model, our results have shown that the coexistence of both type of farmers only occurs when the organic scale production factor is relatively high. It happens when the decrease in productivity due to organic production is relatively low and the price premium for organic products is high. Moreover, we have shown that at the stable inner steady state, this conversion may be done only at the expense of the aquifer sustainability with a lower water table even if conversion is welfare improving. Increasing fertiliser tax reduces pollution, increases the payoff organic farmers but decreases the payoff of conventional farmers. Again, when the organic scale production factor is relatively low, the coexistence of both type of farmers is not possible.
Our results show that the objectives of the European Commission of at least 25% of the agricultural land under organic farming and a reduction by 50% of the use of fertilisers may be achieved under strict conditions. Firstly, it can occur if the difference between organic and conventional in terms of productivity is not too large. If organic farmers are too less productive, conversion won’t be feasible even if the price of organic food is higher. Secondly, the regulatory agency has to implement a tax on fertiliser and use the revenues of the tax to reduce pollution as suggested by Finger et al. (Reference Finger, Möhring, Dalhaus and Böcker2017). Depending on the value of the tax, the regulatory agency may favour the coexistence of both farmers. However, if the tax is too low organic farming won’t be enough profitable and all farmers will be conventional. But if the tax is too high the market will be formed by only organic farmers exacerbating the negative impact on the water table. When the organic scale production factor is relatively low, the fertiliser tax have to be even more larger to favour organic conversion. It suggests that prior implementing a tax on fertiliser, the regulating agency may improve the efficiency of organic farming by adopting a different use of the revenues of the fertiliser tax for instance. Lastly, the regulating agency may have to face a trade-off between organic conversion and lower water table.
Competing interests
The authors report there are no competing interests to declare.
Mathematical Appendix
Proof of Lemma 1
The function Eq. (4) admits a global maximum if the trace of the Hessian matrix is negative ( $tr(\mathbf{H})\lt 0$
) and the determinant is positive (
$tr(\mathbf{H})\lt 0$
) and the determinant is positive ( $det(\mathbf{H}) \geq 0$
). Since
$det(\mathbf{H}) \geq 0$
). Since
 \begin{equation*} \mathbf {H}=\begin {pmatrix} \frac {\partial ^{2}Y_{c}}{\partial w_{c}^{2}} & \frac {\partial ^{2}Y_{c}}{ \partial w_{c}\partial z} \\ \frac {\partial ^{2}Y_{c}}{\partial z\partial w_{c}} & \frac {\partial ^{2}Y_{c}}{\partial z^{2}} \end {pmatrix} =\begin {pmatrix} -\beta p & \eta p \\ \eta p & -\delta p\end {pmatrix}, \end{equation*}
then $tr(\mathbf{H})=(-\beta -\delta )p$
that is always negative, while
$tr(\mathbf{H})=(-\beta -\delta )p$
that is always negative, while $det(\mathbf{H})=(\beta \delta -\eta ^{2})p^{2}$
that is positive if
$det(\mathbf{H})=(\beta \delta -\eta ^{2})p^{2}$
that is positive if $\beta \delta -\eta ^{2} \geq 0$
. Moreover, the MRTS between
$\beta \delta -\eta ^{2} \geq 0$
. Moreover, the MRTS between $w_{c}$
and
$w_{c}$
and $z$
is
$z$
is
 \begin{equation*} MRTS(w_{c},z)=-\frac {\partial Y_{c}/\partial z}{\partial Y_{c}/\partial w_{c} }=-\frac {\gamma -\delta z+\eta w_{c}}{\alpha -\beta w_{c}+\eta z}. \end{equation*}
Therefore, $MRTS(w_{c},z) \leq 0$
if
$MRTS(w_{c},z) \leq 0$
if $w_{c} \leq \frac{\alpha +\eta z}{\beta }$
and
$w_{c} \leq \frac{\alpha +\eta z}{\beta }$
and $z \leq \frac{\gamma +\eta w_{c}}{\delta }$
. Hence, the sufficient conditions
$z \leq \frac{\gamma +\eta w_{c}}{\delta }$
. Hence, the sufficient conditions $w_{c} \leq \frac{\alpha }{\beta }$
and
$w_{c} \leq \frac{\alpha }{\beta }$
and $z \leq \frac{\gamma }{ \delta }$
guarantee a negative MRTS for all inputs values.
$z \leq \frac{\gamma }{ \delta }$
guarantee a negative MRTS for all inputs values.
Proof of Proposition 1
Given the values of $H$
,
$H$
, $\Omega _{o}$
and
$\Omega _{o}$
and $\Omega _{c}$
, the first order conditions are:
$\Omega _{c}$
, the first order conditions are:
 \begin{equation*} \begin{split} \frac{\partial \pi _{o}}{\partial w_{o}}& =(\alpha -\beta w_{o})(1+\varepsilon _{p})p\varepsilon _{y}-c_{0}+c_{1}H-\phi =0, \\ \frac{\partial \pi _{c}}{\partial w_{c}}& =(\alpha -\beta w_{c}+\eta z)p-c_{0}+c_{1}H-\phi =0, \\ \frac{\partial \pi _{c}}{\partial z}& =(\gamma -\delta z+\eta w_{c})p-c_{2}-\tau =0. \end{split} \end{equation*}
From which we obtain the following values:
 \begin{equation*} \begin{split} w_{o}^{\ast }& =\frac{(1+\varepsilon _{p})\alpha p\varepsilon _{y}-c_{0}+c_{1}H-\phi }{(1+\varepsilon _{p})\beta p\varepsilon _{y}}, \\ w_{c}^{\ast }& =\frac{(\alpha p-c_{0}+c_{1}H-\phi )\delta +(\gamma p-c_{2}-\tau )\eta }{(\beta \delta -\eta ^{2})p}, \\ z^{\ast }& =\frac{(\alpha p-c_{0}+c_{1}H-\phi )\eta +(\gamma p-c_{2}-\tau )\beta }{(\beta \delta -\eta ^{2})p}. \end{split} \end{equation*}
It holds that $w_{o}^{\ast }\gt 0$
if
$w_{o}^{\ast }\gt 0$
if
 \begin{equation*} H\gt [c_0+\phi -(1+\varepsilon _p)\alpha p\varepsilon _y]\frac {1}{c_1}, \end{equation*}
which is lower than $H_{\max }=\frac{c_0}{c_1}$
if
$H_{\max }=\frac{c_0}{c_1}$
if
 \begin{equation*} \phi \lt (1+\varepsilon _p)\alpha p\varepsilon _y. \end{equation*}
Analogously, it holds that $w_{c}^{\ast }\gt 0$
if
$w_{c}^{\ast }\gt 0$
if
 \begin{equation*} H\gt [(c_0+\phi -\alpha p)\delta -(\gamma p-c_2-\tau )\eta ]\frac {1}{\delta c_1}, \end{equation*}
which is lower than $H_{\max }$
if
$H_{\max }$
if
 \begin{equation*} \phi \lt [(\gamma p-c_2-\tau )\eta +\alpha p\delta ]\frac {1}{\delta }, \end{equation*}
which is positive if
 \begin{equation*} \tau \lt [(\gamma p-c_2)\eta +\alpha p\delta ]\frac {1}{\eta }. \end{equation*}
Finally, it holds $z^{\ast }\gt 0$
if
$z^{\ast }\gt 0$
if
 \begin{equation*} H\gt [(c_0+\phi -\alpha p)\eta -(\gamma p-c_2-\tau )\beta ]\frac {1}{\eta c_1}, \end{equation*}
which is lower than $H_{\max }$
if
$H_{\max }$
if
 \begin{equation*} \phi \lt [(\gamma p-c_2-\tau )\beta +\alpha p\eta ]\frac {1}{\eta }, \end{equation*}
which is positive if
 \begin{equation*} \tau \lt [(\gamma p-c_2)\beta +\alpha p\eta ]\frac {1}{\beta }. \end{equation*}
Proof of Proposition 2
It holds $w_o-w_c^\ast \leq 0$
if
$w_o-w_c^\ast \leq 0$
if
 \begin{equation*} (1+\varepsilon _p)\varepsilon _y\leq \Gamma :=\frac {(\beta \delta -\eta ^{2})(c_{0}-c_{1}H+\phi )}{(c_{0}-c_{1}H+\phi )\beta \delta -[\alpha p\eta +(\gamma p-c_{2}-\tau )\beta ]\eta } \end{equation*}
Notice that $\Gamma \gt 1$
always, namely if
$\Gamma \gt 1$
always, namely if
 \begin{equation*} H\gt [(c_{0}+\phi -\alpha p)\eta -(\gamma p-c_{2}-\tau )\beta ]\frac {1}{\eta c_{1}}:=\widehat {H}_z \end{equation*}
Therefore, $w_o-w_c^\ast \leq 0$
if
$w_o-w_c^\ast \leq 0$
if $1\lt (1+\varepsilon _p)\varepsilon _y\leq \Gamma$
, while
$1\lt (1+\varepsilon _p)\varepsilon _y\leq \Gamma$
, while $w_o-w_c^\ast \geq 0$
if
$w_o-w_c^\ast \geq 0$
if $(1+\varepsilon _p)\varepsilon _y\geq \Gamma$
.
$(1+\varepsilon _p)\varepsilon _y\geq \Gamma$
.
Proof of Proposition3
Since $\Omega _o^\ast -\Omega _c^\ast \lt 0$
, then the equality
$\Omega _o^\ast -\Omega _c^\ast \lt 0$
, then the equality $ R_o^\ast \Omega _o^\ast -R_c^\ast \Omega _c^\ast =0$
is satisfied only if
$ R_o^\ast \Omega _o^\ast -R_c^\ast \Omega _c^\ast =0$
is satisfied only if $ R_o^\ast -R_c^\ast \gt 0$
. The range of the isocline
$ R_o^\ast -R_c^\ast \gt 0$
. The range of the isocline $\dot{H}=0$
is the interval
$\dot{H}=0$
is the interval $ (0,1)$
only if
$ (0,1)$
only if $w_o^\ast \gt \frac{R}{(1-\mu )N}$
and
$w_o^\ast \gt \frac{R}{(1-\mu )N}$
and $w_c^\ast \lt \frac{R}{(1-\mu )N}$
for
$w_c^\ast \lt \frac{R}{(1-\mu )N}$
for $w_o^\ast -w_c^\ast \gt 0$
or
$w_o^\ast -w_c^\ast \gt 0$
or $w_c^\ast \gt \frac{R}{(1-\mu )N}$
for
$w_c^\ast \gt \frac{R}{(1-\mu )N}$
for $ w_o^\ast -w_c^\ast \lt 0$
. Moreover, the range of the isocline
$ w_o^\ast -w_c^\ast \lt 0$
. Moreover, the range of the isocline $\dot{x}=0$
is the interval
$\dot{x}=0$
is the interval $(0,1)$
only if
$(0,1)$
only if $\varepsilon _v\gt \frac{R_o^\ast }{R_c^\ast }$
. Finally, it holds
$\varepsilon _v\gt \frac{R_o^\ast }{R_c^\ast }$
. Finally, it holds
 \begin{equation*} \frac {\partial \dot {H}=0}{\partial H}=\frac {-(1-\mu )^2(w_o^\ast -w_c^\ast )\frac {\partial w_c^\ast }{\partial H}N^2-(1-\mu )[R-(1-\mu )N w_c^\ast ]\left (\frac {\partial w_o^\ast }{\partial H}-\frac {\partial w_c^\ast }{\partial H} \right )N}{[(1-\mu )(w_o^\ast -w_c^\ast )N]^2} \end{equation*}
where
 \begin{equation*} \frac {\partial w_o^\ast }{\partial H}=\frac {c_1}{(1+\varepsilon _p)p\beta \varepsilon _y} \;\;\;\; \text {and}\;\;\;\;\; \frac {\partial w_c^\ast }{ \partial H}=\frac {\delta c_1}{(\beta \delta -\eta ^2)p}. \end{equation*}
Since $\frac{\partial w_o^\ast }{\partial H}-\frac{\partial w_c^\ast }{ \partial H}\gt 0$
if
$\frac{\partial w_o^\ast }{\partial H}-\frac{\partial w_c^\ast }{ \partial H}\gt 0$
if $\varepsilon _y\lt \frac{\beta \delta -\eta ^2}{ (1+\varepsilon _p)\beta \delta }$
that is always lower than condition Eq. (17), therefore, if
$\varepsilon _y\lt \frac{\beta \delta -\eta ^2}{ (1+\varepsilon _p)\beta \delta }$
that is always lower than condition Eq. (17), therefore, if $w_o^\ast -w_c^\ast \gt 0$
then
$w_o^\ast -w_c^\ast \gt 0$
then $\frac{ \partial w_o^\ast }{\partial H}-\frac{\partial w_c^\ast }{\partial H}\lt 0$
and
$\frac{ \partial w_o^\ast }{\partial H}-\frac{\partial w_c^\ast }{\partial H}\lt 0$
and $ \frac{\partial \dot{H}=0}{\partial H}\lt 0$
, while if
$ \frac{\partial \dot{H}=0}{\partial H}\lt 0$
, while if $w_o^\ast -w_c^\ast \lt 0$
then
$w_o^\ast -w_c^\ast \lt 0$
then $\frac{\partial w_o^\ast }{\partial H}-\frac{\partial w_c^\ast }{\partial H}\gt 0$
and
$\frac{\partial w_o^\ast }{\partial H}-\frac{\partial w_c^\ast }{\partial H}\gt 0$
and $\frac{\partial \dot{H}=0}{\partial H}\gt 0$
.
$\frac{\partial \dot{H}=0}{\partial H}\gt 0$
.
Proof of Proposition4
It holds:
 \begin{equation*} \begin{split} \frac{\partial \dot{H}}{\partial H}=&\; -(1-\mu )\left (\frac{1}{AS}\right )\left [x\frac{\partial w_o^\ast }{\partial H}+(1-x)\frac{\partial w_c^\ast }{ \partial H}\right ]N \\ \frac{\partial \dot{H}}{\partial x}=&\; -(1-\mu )\left (\frac{1}{AS} \right )(w_o^\ast -w_c^\ast )N \\ \frac{\partial \dot{x}}{\partial H}=&\; x(1-x)\left (\frac{\partial \pi _o^\ast }{\partial H}-\frac{\partial \pi _c^\ast }{\partial H}\right ) \\ \frac{\partial \dot{x}}{\partial x}=&\; x(1-x)\left (\frac{\partial \pi _o^\ast }{\partial x}-\frac{\partial \pi _c^\ast }{\partial x}\right ) +(1-2x)(\pi _o^\ast -\pi _c^\ast ) \end{split} \end{equation*}
In an inner steady state it holds $\pi _o^\ast -\pi _c^\ast =0$
. Since
$\pi _o^\ast -\pi _c^\ast =0$
. Since $\frac{ \partial w_o^\ast }{\partial H}\gt 0$
and
$\frac{ \partial w_o^\ast }{\partial H}\gt 0$
and $\frac{\partial w_c^\ast }{\partial H} \gt 0$
(see the Proof of Proposition3), then
$\frac{\partial w_c^\ast }{\partial H} \gt 0$
(see the Proof of Proposition3), then $\frac{\partial \dot{H}}{ \partial H}\lt 0$
. It easy to check that if
$\frac{\partial \dot{H}}{ \partial H}\lt 0$
. It easy to check that if $w_o^\ast -w_c^\ast \gt 0$
then
$w_o^\ast -w_c^\ast \gt 0$
then $\frac{ \partial \dot{H}}{\partial x}\lt 0$
, while if
$\frac{ \partial \dot{H}}{\partial x}\lt 0$
, while if $w_o^\ast -w_c^\ast \lt 0$
then
$w_o^\ast -w_c^\ast \lt 0$
then $\frac{ \partial \dot{H}}{\partial x}\gt 0$
. Moreover,
$\frac{ \partial \dot{H}}{\partial x}\gt 0$
. Moreover,
 \begin{equation*} \begin{split} \frac{\partial \pi _o^\ast }{\partial H}=&\; \frac{\partial R_o^\ast }{\partial H}\Omega _o^\ast - R_o^\ast \frac{\partial \Omega _o^\ast }{\partial H} \\ \frac{\partial \pi _c^\ast }{\partial H}=&\; \frac{\partial R_c^\ast }{\partial H}\Omega _c^\ast - R_c^\ast \frac{\partial \Omega _c^\ast }{\partial H} \end{split} \end{equation*}
Since
 \begin{equation*} \begin{split} \frac{\partial R_o^\ast }{\partial H}=&\; (1+\varepsilon _p)p\varepsilon _y\beta w_o^\ast \frac{\partial w_o^\ast }{ \partial H}=c_1 w_o^\ast \\ \frac{\partial R_c^\ast }{\partial H}=&\; \beta w_c^\ast \frac{\partial w_c^\ast }{\partial H}+\delta z^\ast \frac{\partial z^\ast }{\partial H}-\eta w_c^\ast \frac{\partial z^\ast }{\partial H}-\eta z^\ast \frac{\partial w_c^\ast }{\partial H}=c_1 w_c^\ast \end{split} \end{equation*}
The difference $\frac{\partial \pi _o^\ast }{\partial H}-\frac{\partial \pi _c^\ast }{\partial H}$
can be rewritten as:
$\frac{\partial \pi _o^\ast }{\partial H}-\frac{\partial \pi _c^\ast }{\partial H}$
can be rewritten as:
 \begin{equation*} (w_o^\ast -w_c^\ast )(\Omega _o^\ast -\Omega _c^\ast )c_1+(R_o^\ast -R_c^\ast )\left (\frac {\partial \Omega _o^\ast }{\partial H}-\frac {\partial \Omega _c^\ast }{ \partial H}\right ) \end{equation*}
Since $\Omega _o^\ast -\Omega _c^\ast \lt 0$
,
$\Omega _o^\ast -\Omega _c^\ast \lt 0$
, $R_o^\ast -R_c^\ast \gt 0$
, and
$R_o^\ast -R_c^\ast \gt 0$
, and $\frac{ \partial \Omega _o^\ast }{\partial H}-\frac{\partial \Omega _c^\ast }{\partial H} \gt 0$
(it holds
$\frac{ \partial \Omega _o^\ast }{\partial H}-\frac{\partial \Omega _c^\ast }{\partial H} \gt 0$
(it holds $\frac{-\left [(\lambda -\sigma \tau )(1-x)N\theta \varepsilon _v\frac{\partial z^\ast }{\partial H}\right ]}{(1+\theta P\varepsilon _v)^2}-\frac{-\left [(\lambda -\sigma \tau )(1-x)N\theta \frac{\partial z^\ast }{\partial H}\right ]}{(1+\theta P)^2}\gt 0$
for
$\frac{-\left [(\lambda -\sigma \tau )(1-x)N\theta \varepsilon _v\frac{\partial z^\ast }{\partial H}\right ]}{(1+\theta P\varepsilon _v)^2}-\frac{-\left [(\lambda -\sigma \tau )(1-x)N\theta \frac{\partial z^\ast }{\partial H}\right ]}{(1+\theta P)^2}\gt 0$
for $\varepsilon _v\gt 1$
), then if
$\varepsilon _v\gt 1$
), then if $ w_o^\ast -w_c^\ast \lt 0$
, it holds
$ w_o^\ast -w_c^\ast \lt 0$
, it holds $\frac{\partial \dot{x}}{\partial H}\gt 0$
, conversely, if
$\frac{\partial \dot{x}}{\partial H}\gt 0$
, conversely, if $w_o^\ast -w_c^\ast \gt 0$
, then
$w_o^\ast -w_c^\ast \gt 0$
, then $\frac{\partial \dot{x}}{\partial H}\lesseqgtr 0$
. Finally,
$\frac{\partial \dot{x}}{\partial H}\lesseqgtr 0$
. Finally,
 \begin{equation*} \begin{split} \frac{\partial \pi _o^\ast }{\partial x}=&\; (1+\varepsilon _p)p\varepsilon _y\frac{\beta }{2}(w_o^\ast )^2\frac{\partial \Omega _o^\ast }{\partial x} \\ \frac{\partial \pi _c^\ast }{\partial x}=&\; \left [\frac{\beta }{2}(w_c^\ast )^2+\frac{\delta }{2}(z^\ast )^2-\eta z w_c^\ast +\zeta \right ]p\frac{ \partial \Omega _c^\ast }{\partial x} \end{split} \end{equation*}
Since $R_c^\ast =R_o^\ast \frac{\Omega _o}{\Omega _c}$
, then
$R_c^\ast =R_o^\ast \frac{\Omega _o}{\Omega _c}$
, then $\textrm{sign}\,\left (\frac{ \partial \pi _o^\ast }{\partial x}-\frac{\partial \pi _c^\ast }{\partial x}\right )= \textrm{sign}\,\left (\frac{\partial \Omega _o^\ast }{\partial x}-\frac{\Omega _o^\ast }{ \Omega _c^\ast }\frac{\partial \Omega _c^\ast }{\partial x}\right )$
. Since
$\textrm{sign}\,\left (\frac{ \partial \pi _o^\ast }{\partial x}-\frac{\partial \pi _c^\ast }{\partial x}\right )= \textrm{sign}\,\left (\frac{\partial \Omega _o^\ast }{\partial x}-\frac{\Omega _o^\ast }{ \Omega _c^\ast }\frac{\partial \Omega _c^\ast }{\partial x}\right )$
. Since $ \frac{\partial \Omega _o^\ast }{\partial x}-\frac{\Omega _o^\ast }{\Omega _c^\ast } \frac{\partial \Omega _c^\ast }{\partial x}\gt 0$
for
$ \frac{\partial \Omega _o^\ast }{\partial x}-\frac{\Omega _o^\ast }{\Omega _c^\ast } \frac{\partial \Omega _c^\ast }{\partial x}\gt 0$
for $\varepsilon _v\gt 1$
, that is always true, then
$\varepsilon _v\gt 1$
, that is always true, then $\frac{\partial \dot{x}}{\partial x}\gt 0$
. Therefore, if
$\frac{\partial \dot{x}}{\partial x}\gt 0$
. Therefore, if $ w_o^\ast -w_c^\ast \gt 0$
, the Jacobian matrix at the inner steady state is:
$ w_o^\ast -w_c^\ast \gt 0$
, the Jacobian matrix at the inner steady state is:
 \begin{equation*} \mathbf {J}(H^\ast, x^\ast )= \begin {pmatrix} \frac {\partial \dot {H}}{\partial H}\lt 0 & \frac {\partial \dot {H}}{\partial x}\lt 0 \\ \frac {\partial \dot {x}}{\partial H}\lessgtr 0 & \frac {\partial \dot {x}}{ \partial x}\gt 0\end {pmatrix} \end{equation*}
while if $w_o^\ast -w_c^\ast \lt 0$
it is:
$w_o^\ast -w_c^\ast \lt 0$
it is:
 \begin{equation*} \mathbf {J}(H^\ast, x^\ast )= \begin {pmatrix} \frac {\partial \dot {H}}{\partial H}\lt 0 & \frac {\partial \dot {H}}{\partial x}\gt 0 \\ \frac {\partial \dot {x}}{\partial H}\gt 0 & \frac {\partial \dot {x}}{\partial x} \gt 0\end {pmatrix} \end{equation*}
This means that for $w_o^\ast -w_c^\ast \gt 0$
,
$w_o^\ast -w_c^\ast \gt 0$
, $det(\mathbf{J} (H^\ast, x^\ast ))\lessgtr 0$
, and so the inner steady state can be stable as well as unstable. Conversely, for
$det(\mathbf{J} (H^\ast, x^\ast ))\lessgtr 0$
, and so the inner steady state can be stable as well as unstable. Conversely, for $w_o^\ast -w_c^\ast \lt 0$
,
$w_o^\ast -w_c^\ast \lt 0$
, $det(\mathbf{J} (H^\ast, x^\ast )\lt 0$
, and so the inner steady state is always unstable.
$det(\mathbf{J} (H^\ast, x^\ast )\lt 0$
, and so the inner steady state is always unstable.


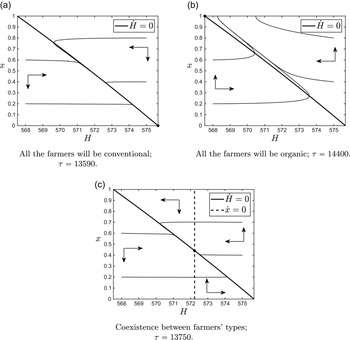


 Open access