





1. Introduction
The glacier equilibrium-line altitude (ELA) is the elevation at which annual accumulation (net gain) and ablation (net loss) are equal. Hence, ELAs can be considered important gauges of climate, reflecting temperature and precipitation at that point on the glacier. More importantly, changes to glacier ELAs can be treated as indicators of spatial and temporal response to climate forcing over the instrumental era, as well as providing insights into past climate, and potential responses to future forcing. Time series of ELAs may be analysed to track how glacier mass balance changes from year to year (WGMS, 2017). From these annual data, a climatically representative ELA can be calculated corresponding to the ELA averaged over a standard 30-year window (Sutherland, Reference Sutherland1984; Rabatel and others, Reference Rabatel, Letréguilly, Dedieu and Eckert2013) or the zero-net balance ELA (znb-ELA) can be calculated as the y-intercept value yielded through linear regression of a time series of annual specific net mass balance and ELA, which assumes the glacier is in equilibrium with climate (Rea, Reference Rea2009).
However, and despite its usefulness, the znb-ELA is rarely calculated, since direct mass-balance data which are notoriously labour-intensive and time-consuming to acquire are currently available for fewer than 150 glaciers globally (Braithwaite, Reference Braithwaite2008). An alternative approach to making direct ELA measurements is to estimate the ELA using remotely sensed data, including aerial photographs and/or satellite images, by monitoring end of summer season snowlines (as a proxy for the ELA), and/or using multi-annual DEMs to calculate geodetic mass balance. However, in many cases, suitable remotely sensed data (i.e. data with sufficient spatial and temporal resolution, and with limited cloud cover) are unavailable. A further alternative is to calculate the ELAs based on the surface topography/hypsometry of glaciers. The two most widely used techniques for this calculation are the area–altitude balance ratio (AABR) and the accumulation–area ratio (AAR) methods (Carrivick and Brewer, Reference Carrivick and Brewer2004; Rea, Reference Rea2009; Mernild and others, Reference Mernild2013; Barr and Spagnolo, Reference Barr and Spagnolo2015; Pearce and others, Reference Pearce, Ely, Barr and Boston2017). Both methods generate a calculated ELA (c-ELA), assuming that the glacier is in equilibrium with climate, which is considered comparable to, and a good proxy for, the znb-ELA determined from a measured time series of field surveys (Trenhaile, Reference Trenhaile1975; Reynaud and others, Reference Reynaud, Vallon, Martin and Letreguilly1984; Rosqvist and Østrem, Reference Rosqvist and Østrem1989; Grudd, Reference Grudd1990; Nesje, Reference Nesje1992; Hagen and others, Reference Hagen, Melvold, Pinglot and Dowdeswell2003; Osmaston, Reference Osmaston2005). Given that global, relatively high-resolution DEMs are now freely available from several remote-sensing campaigns (e.g. Advanced Spaceborne Thermal Emission and Reflection Radiometer (ASTER); Shuttle Radar Topography Mission (SRTM), Farr and others, 2007; Mathieu and others, Reference Mathieu, Chinn and Fitzharris2009), and that multiple glacier outlines have also been digitised and published (from inventories such as GLIMS: Global Land Ice Measurements from Space), the AABR and AAR approaches provide the opportunity to calculate and monitor ELAs for thousands of extant glaciers (Braithwaite and Raper, Reference Braithwaite and Raper2009), even in remote regions where mass-balance records are lacking. This is also key for palaeoglacier studies where numerical (recommended), or cartographic, approaches can be used to generate 3-D reconstructions of palaeoglaciers, from which ELAs can be determined. These palaeo-ELAs are often used to infer palaeoclimate (e.g. Rea and Evans, Reference Rea and Evans2007; Bacon and others, Reference Bacon2001; Barr and others, Reference Barr2017; Ipsen and others, Reference Ipsen, Principato, Grube and Lee2017; Spagnolo and Ribolini, Reference Spagnolo and Ribolini2019; Rea and others, Reference Rea2020) using empirical relationships linking ELA, temperature and precipitation (e.g. Ohmura and others, Reference Ohmura, Kasser and Funk1992; Ohmura and Boettcher, Reference Ohmura and Boettcher2018). When palaeotemperatures are determined from other, independent proxies, reconstructed palaeo-ELAs can be used to generate quantitative estimates of palaeoprecipitation (Benn and Lehmkul, Reference Benn and Lehmkuhl2000; Mackintosh and others, Reference Mackintosh, Anderson and Pierrehumbert2017; Rea and others, Reference Rea2020), something which is difficult to achieve using other climate proxies.
In all, the hypsometry-based calculation has notable advantages for analysing contemporary and palaeoglaciers. However, the robustness of using both AABR and AAR approaches for ELA calculation has never been systematically tested using a large dataset. To address this shortcoming, here we compare AABR and AAR c-ELAs and measured znb-ELAs (based on empirical field data) for a large, dataset of modern glaciers.
2. Methods
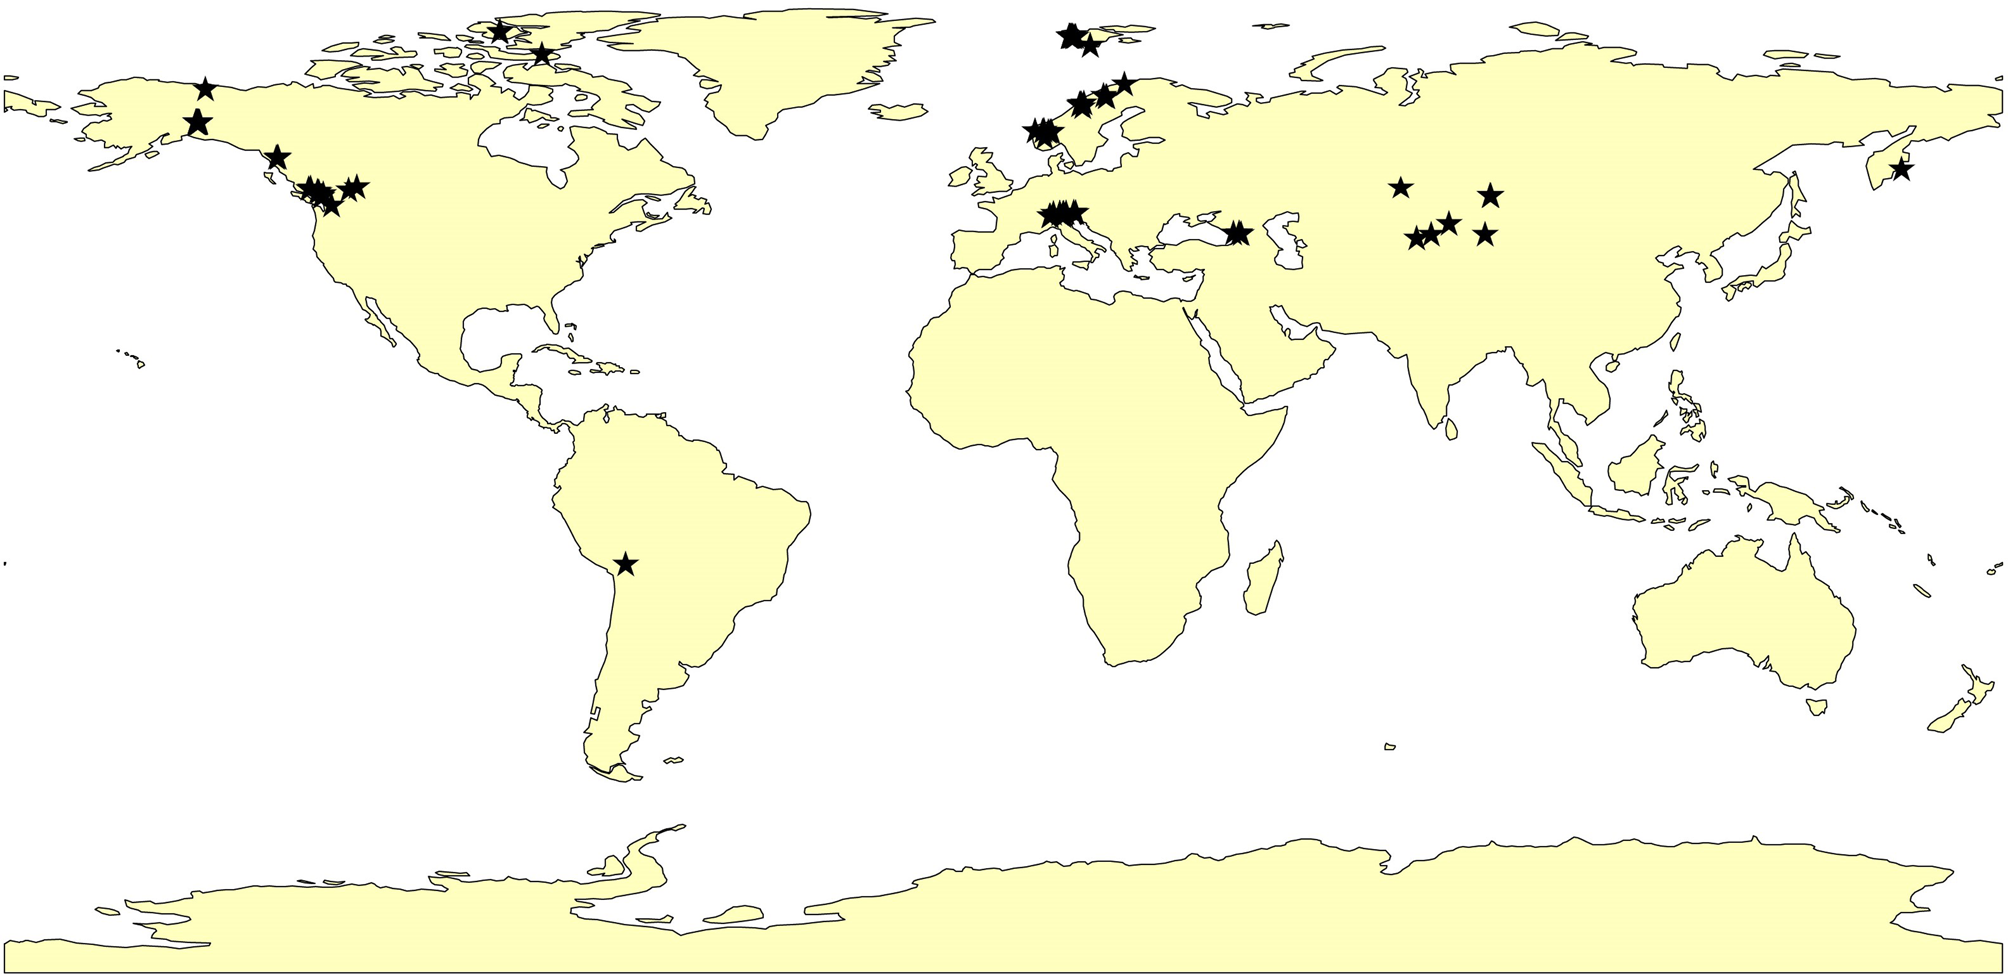
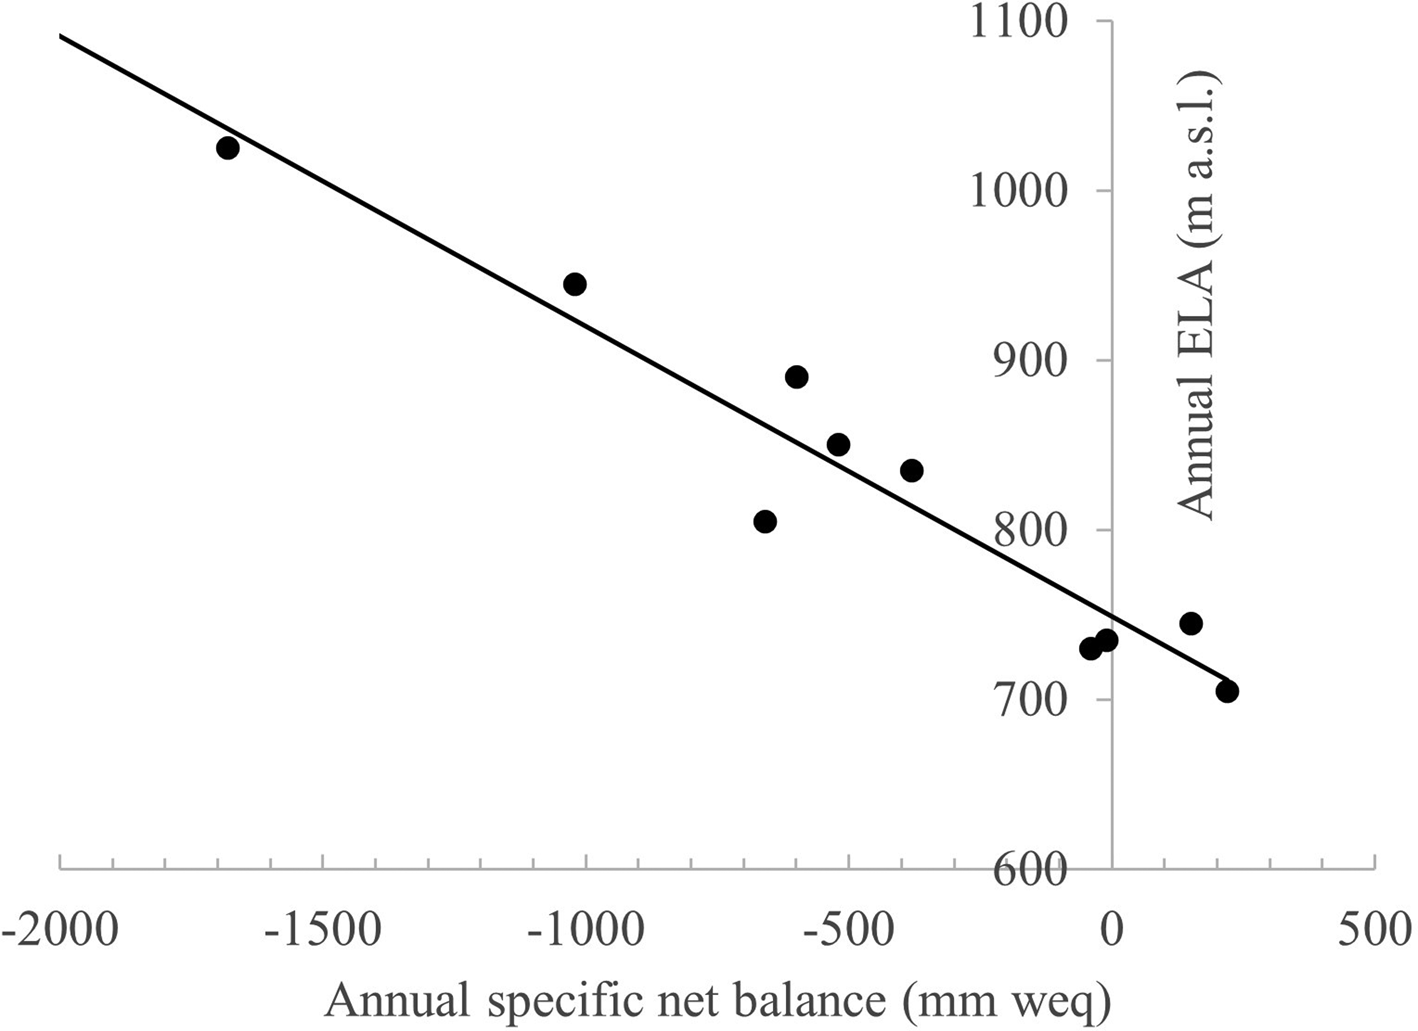
Our assessment is based on 64 glaciers (Fig. 1) for which znb-ELAs are available from Rea (Reference Rea2009). This remains the most comprehensive global inventory of znb-ELAs for which direct, field-measured mass-balance records of ⩾7 continuous years are available between 1999 and 2011 to match the time span of the corresponding ASTER V2.0 and available GLIMS polygons, and hence represents the best available control dataset against which to compare the c-ELAs. For each glacier, Rea (Reference Rea2009) derived the znb-ELA by plotting a time series of annual ELAs against the annual specific net balance, as exemplified in Fig. 2. The original dataset of Rea (Reference Rea2009) comprised of 66 glaciers. However, Kozelskiy and Ram River glaciers were excluded from the original n = 66 dataset. Kozelskiy glacier, because there is not a GLIMS polygon for the timeline overlap (GLIMS and NSIDC, 2005, updated 2018). Ram River glacier, because of problems with the outline polygon in GLIMS and the glacier coordinates in the WGMS database. Our final dataset therefore contained 64 glaciers. GLIMS outlines were chosen for this project because they were fit for purpose and the aim was to test free-to-access data. The GLIMS data viewer typically also includes the Randolph Glacier Inventory and the World Glacier Inventory if available (https://www.glims.org/maps/glims).
Distribution and location of the 64 glaciers used within this study which are the same glaciers used in Rea (Reference Rea2009).
Plot of annual specific net balance (in mm of water equivalent) vs ELA for Langfjordjøkelen for 10 consecutive years of measurement. The zero-net balance is provided by the y-intercept (748 m) i.e. specific net balance is equal to zero.
The aim of the current study is to determine the error between ELAs calculated using open-source datasets (DEMs and glacier outlines) and znb-ELAs determined from measured mass-balance time series. Ideally, we wanted overlapping time windows between the measured mass-balance znb-ELA time series, the DEM acquisition window and the GLIMS mapping year. We defined the best window as 1999–2011, which covers all the GLIMS mapping and ASTER Version 2.0 and most of the WGMS mass-balance time series used by Rea (Reference Rea2009) (Table 1).
All the glaciers that are used in the study along with their corresponding WGMS ID, GLIMS code, political unit, latitude and longitude, region (used for regional AABRs), GLIMS SRT-DATE (GLIMS acquisition date of the image used for mapping) and the window of the measured mass-balance time series
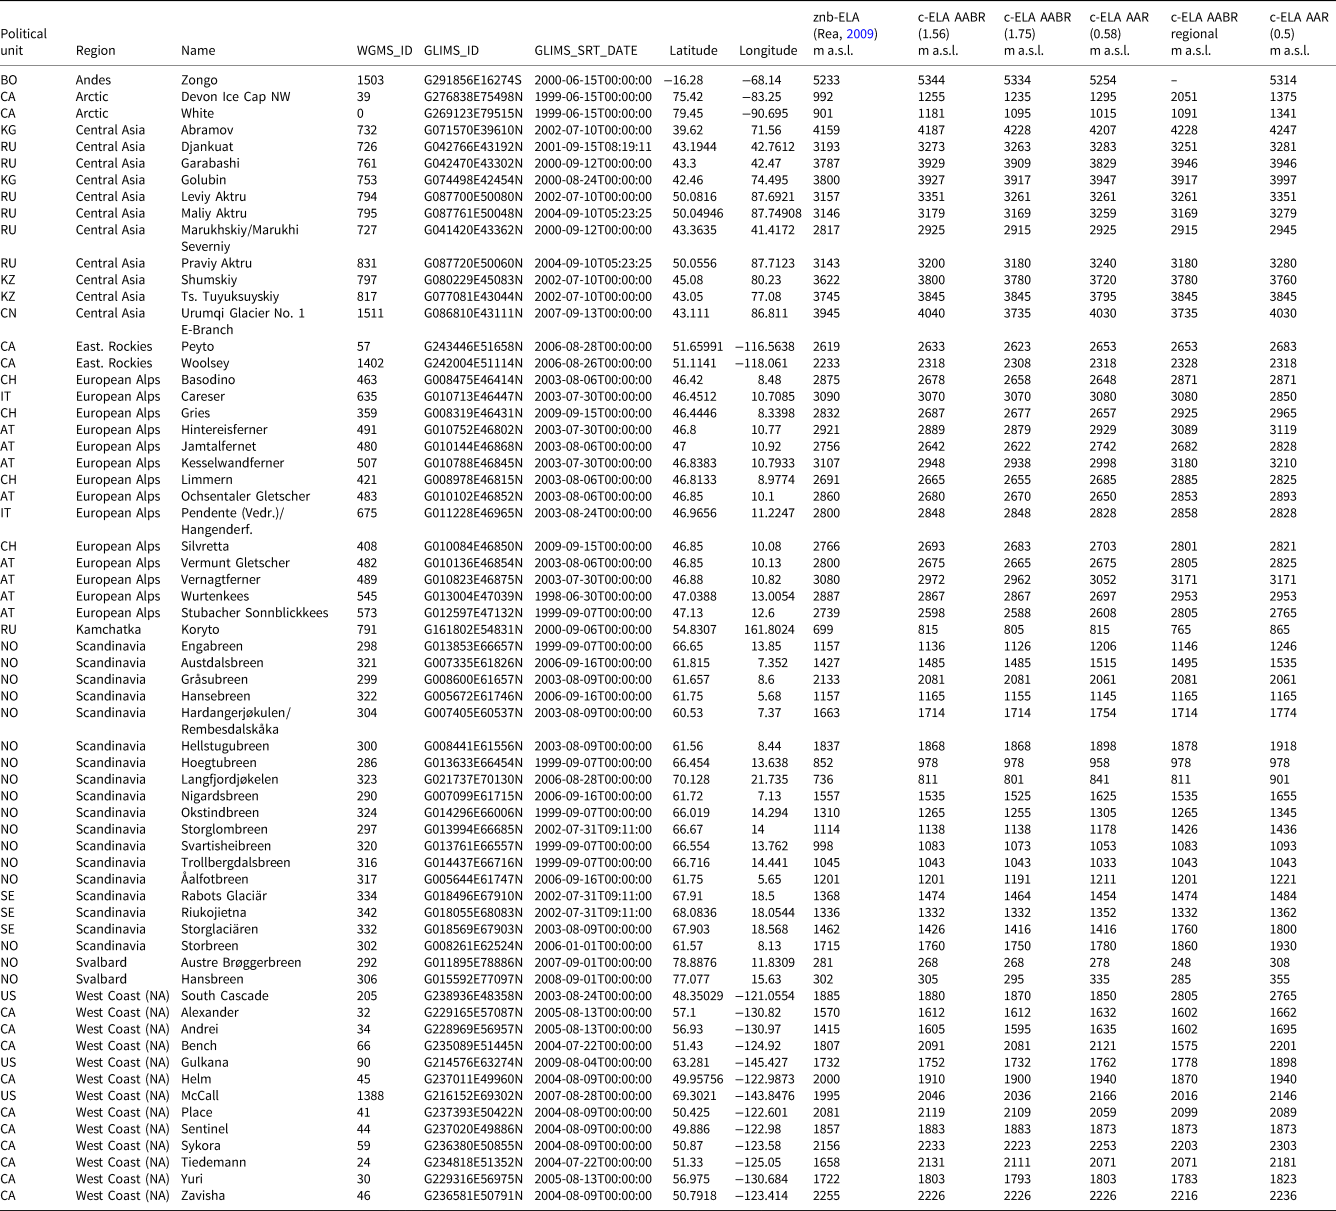
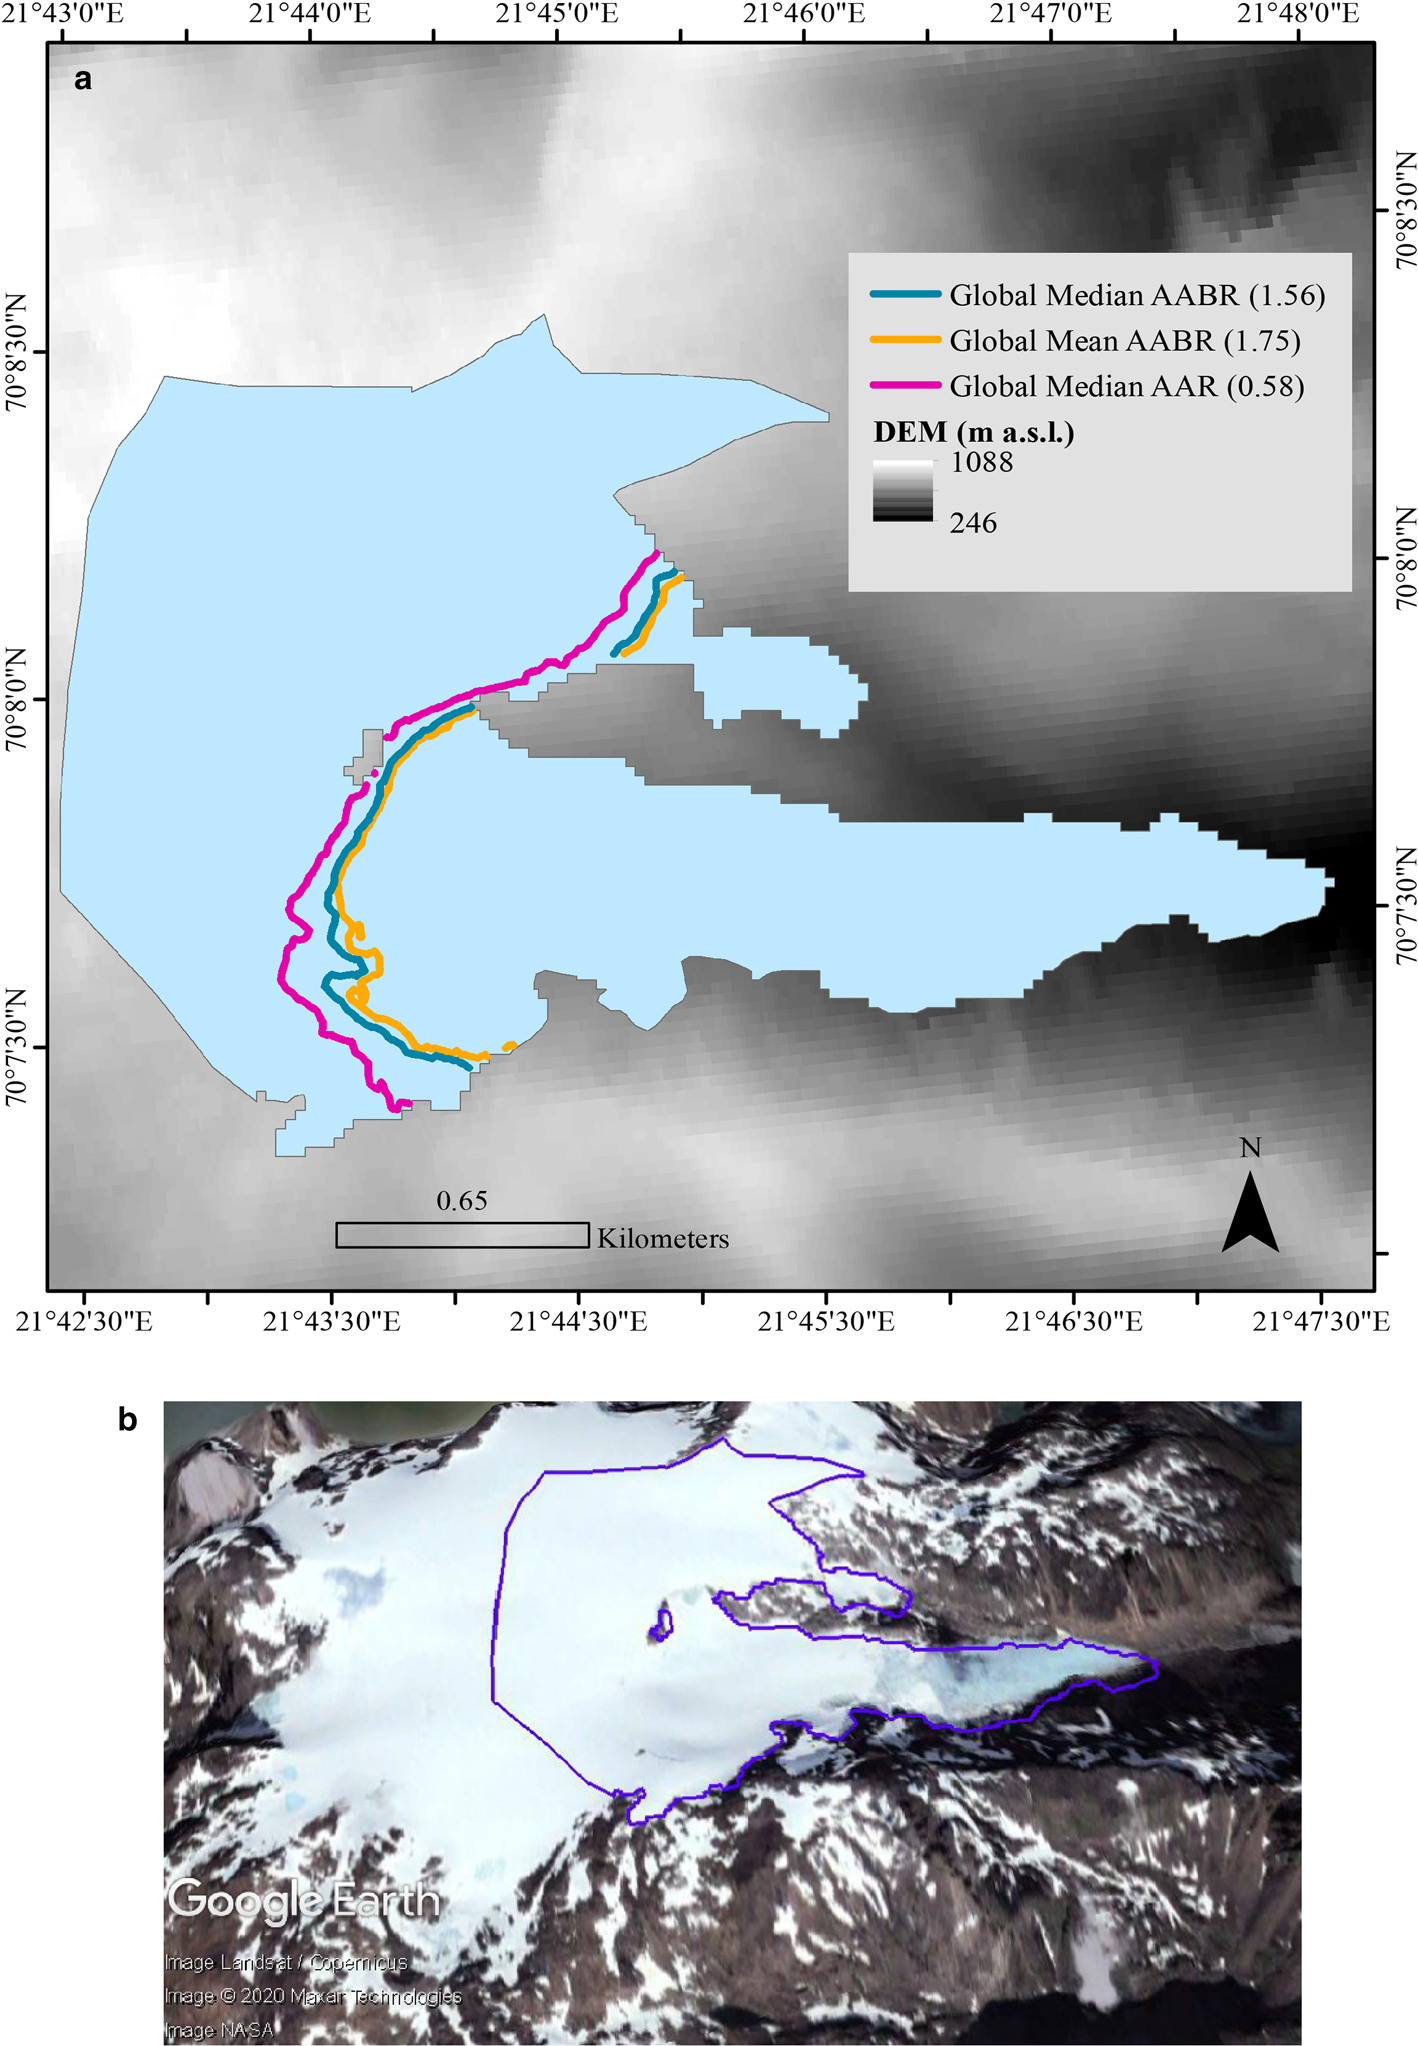
To derive c-ELAs for each glacier we used a bespoke ArcGIS toolbox that applies the AABR and AAR methods to DEM data and polygonised glacier outlines (Pellitero and others, Reference Pellitero2015). The surface topography of each glacier was extracted from ASTER GDEM Version 2, at 30 m horizontal resolution, freely available through the USGS Earth Explorer (ASTER GDEM Version 2 is a product of METI and NASA, released in October 2011). ASTER V2.0 mean elevation error is between 3.34 and 15.02 m with an average of 8.3 m and a std. dev. of 12.6 m (Tachikawal and others, Reference Tachikawal, Hatol, Kaku and Iwasaki2011). Polygons, delineating the perimeter of each glacier, were obtained from the GLIMS global glacier database (Raup and others, Reference Raup2007; GLIMS and NSIDC, 2005, updated 2018) (Fig. 3; Table 1), and each glacier was labelled using its unique GLIMS code. Google Earth imagery, where possible from the ablation season corresponding to the year of the GLIMS polygon, was used as a cross-check on glacier location and approximate geometry (Fig. 3).
(a) An example of a glacier polygon from the GLIMS database for Langfjordjøkelen (GLIMS outline acquisition date: 2006). The ELAs presented in this figure were calculated using the GIS tool (Pellitero and others, Reference Pellitero2015) described in the methodology using the global AABR and AAR values of Table 2. (b) A snapshot of Langfjordjøkelen (31 December 2006) from Google Earth Pro (Image Landsat/Copernicus) overlain with the corresponding GLIMS polygon.
In order to obtain c-ELAs from glacier surface DEMs, appropriate AABR and/or AAR values must be selected. The AABR assumes a fixed ratio between the accumulation and ablation gradients and accounts for the hypsometry of the glacier when calculating the ELA. The AAR more simply assumes the accumulation area occupies a fixed proportion of the total glacier area. Rea (Reference Rea2009) determined global mean values of 1.75 and 0.58 for the AABR and AAR indices respectively, which have been widely adopted by further studies (e.g. Bahr and others, Reference Bahr, Pfeffer, Sassolas and Meier1998; Kern and László, Reference Kern and László2010; Mills and others, Reference Mills, Grab, Rea, Carr and Farrow2012; Dong and others, Reference Dong2017). We applied a skewness test in SPSS® to the AABR and AAR datasets used by Rea (Reference Rea2009), in order to assess if the use of the means was statistically valid. Both datasets failed the test, so global medians were calculated instead, as this statistic better represents skewed distributions. The calculated global median value is 1.56 for the AABR and, fortuitously remained 0.58 for the AAR. We therefore used the median AABR to derive c-ELAs but, for the purposes of comparison with other studies that have used the mean, we also report results generated using the mean global AABR. Braithwaite and Raper (Reference Braithwaite and Raper2009) reported a strong correlation between the znb-ELA (their balanced budget ELA) and the median glacier altitude (equivalent to an AAR of 0.5). For completeness, we also determine c-ELAs using an AAR of 0.5 and 0.58 (Table 1).
In addition to considering the global values, c-ELAs were determined using AABR values specific to different regions, also derived from Rea (Reference Rea2009). This analysis was applied to regions here defined as Scandinavia (AABR = 1.5), the North America West Coast (AABR = 2.09), the European Alps (AABR = 1.29) and Central Asia (AABR = 1.75) (Table 2). Again, for completeness we also determined c-ELAs for the Arctic (AABR = 2.91), Eastern Rockies (AABR = 1.11), Kamchatka (AABR = 3.18) and Svalbard (AABR = 2.13) but note that these regional AABRs were derived from only one or two glaciers, so they should be treated with caution. Scandinavia, North America West Coast, European Alps and Central Asia regional datasets passed a skewness test, demonstrating that the mean AABRs calculated by Rea (Reference Rea2009) were valid (Table 2).
Number of glaciers in the dataset, the ratio for each methodology and the difference in the median elevation between the c-ELAs and the measured ELAs using the global median and mean AABRs, the global AAR ratio and the regional AABRs
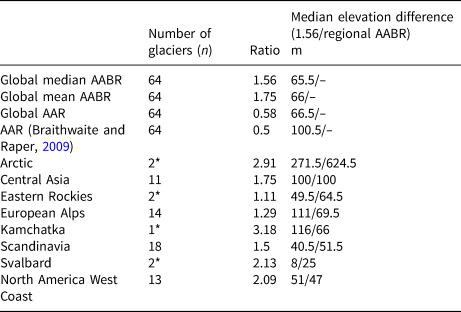
Regions noted with * are statistically insignificant but the analyses were undertaken for completeness.
It is possible that smaller ice masses, such as cirque glaciers, will have responded more rapidly to ongoing warming than larger ones such as valley or plateau glaciers (Nye, Reference Nye1965; Grudd, Reference Grudd1990; Bahr and others, Reference Bahr, Pfeffer, Sassolas and Meier1998) which could affect the comparison between c-ELA and znb-ELA. In order to assess this, we plotted glacial area, taken as a proxy for response time (Raper and Braithwaite, Reference Raper and Braithwaite2009; Zekollari and Huybrechts, Reference Zekollari and Huybrechts2015; Zekollari and others, Reference Zekollari, Huss and Farinotti2020), vs the absolute median difference between c-ELA and znb-ELA calculated using the global AABR (1.56). The relationship is statistically insignificant (r 2 = 0.09), so it is concluded that differences in glacier response times do not impact the subsequent analyses (see Supplementary data).
3. Results
3.1. c-ELAs vs znb-ELAs for global values
Figures 4a, b, c show the c-ELA determined using the global AABR and AAR values discussed in Section 2. In all instances, the correlation between c-ELA and znb-ELA is very strong (r 2 = 0.99). Frequency distributions for the absolute median elevation difference between c-ELA and znb-ELA (Figs 4d, e) show that each dataset is skewed, so the median elevation differences are a more statistically robust metric than the mean. All differences discussed from here onwards will thus refer to the absolute median difference between c-ELA and znb-ELA.
Comparison of c-ELA and znb-ELA for (a) the global median AABR (1.56), (b) the global AAR (0.58) and (c) the global mean AABR (1.75). In each case, n = 64. Histograms of the absolute median difference measurements between c-ELAs and znb-ELAs for each glacier in m, overlain with a normality curve. Note the skewness of the datasets. (d) The normality curve and histogram for the global median AABR (1.56). (e) The normality curve and histogram for the global AAR (0.58).
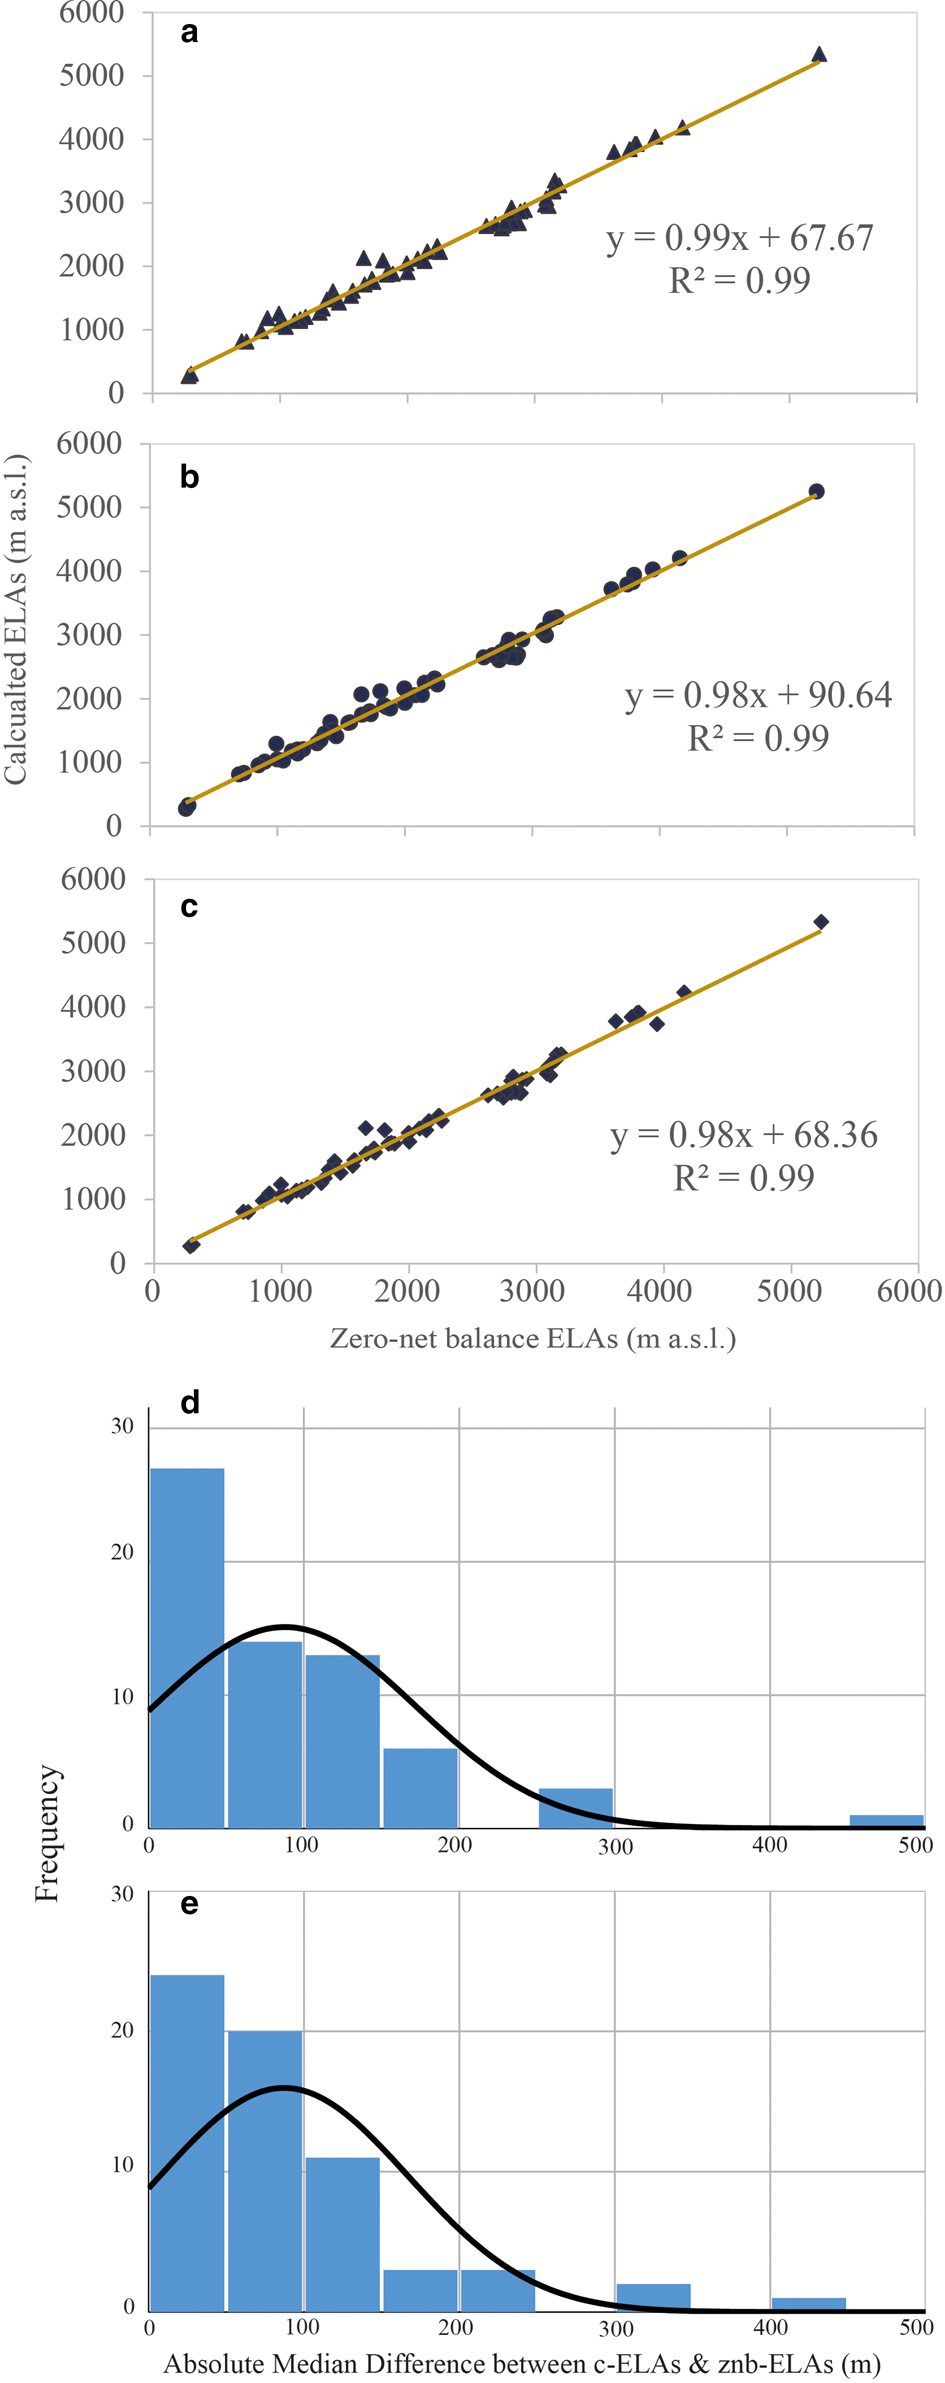
The difference between the c-ELAs and the znb-ELAs for the global median AABR (1.56) is 65.5 m (Table 2) while it is 66.5 m using the global AAR (0.58) (Fig. 4b). The results indicate that the global median AABR produces the smallest median difference between c-ELAs and znb-ELAs, but this is only marginally better than the AAR (0.58). For completeness, we also determined c-ELAs using the AAR value of 0.5 which generated an absolute median elevation difference of 100.5 m. This is worse than those derived using the global AABR (1.56) and AAR (0.58) ratios so the AAR of 0.5 will not be further discussed.
3.2. c-ELAs vs znb-ELAs for the regional AABR values
Figure 5 shows the c-ELAs determined using the regional AABRs for (a) Scandinavia, (b) the North America West Coast, (c) the European Alps and (d) Central Asia. The differences between c-ELAs and znb-ELAs are 51.5, 47, 69.5 and 100 m, respectively. Frequency distributions for the absolute median elevation difference between the c-ELAs and znb-ELAs (Fig. 5e) showed that all the regions followed the same skewness pattern as the global datasets. For Scandinavia, the dataset comprised of 18 glaciers and the c-ELA vs znb-ELAs is again strongly correlated (r 2 = 0.92), with an absolute median difference of 51.5 m. This is higher, and therefore less accurate, than the difference of 40.5 m obtained using the global median AABR (1.56) for the same 18 Scandinavian glaciers.
Cross plot showing the comparison of the c-ELAs versus the znb-ELAs for (a) Scandinavia region using the regional mean AABR of 1.5, n = 18, (b) West Coast Rocky Mountain using the regional mean AABR of 2.09, n = 3, (c) the European Alps using a new regional mean AABR of 1.29, n = 14 and (d) Central Asia using the regional mean AABR of 1.75, n = 11. Histograms of the absolute median difference between c-ELAs and znb-ELAs for each glacier in m, overlain with a normality curve. Note the skewness of the datasets. (e) Histograms and normality curves for the three regional AABRs, Scandinavia, North America West Coast, the European Alps and Central Asia.
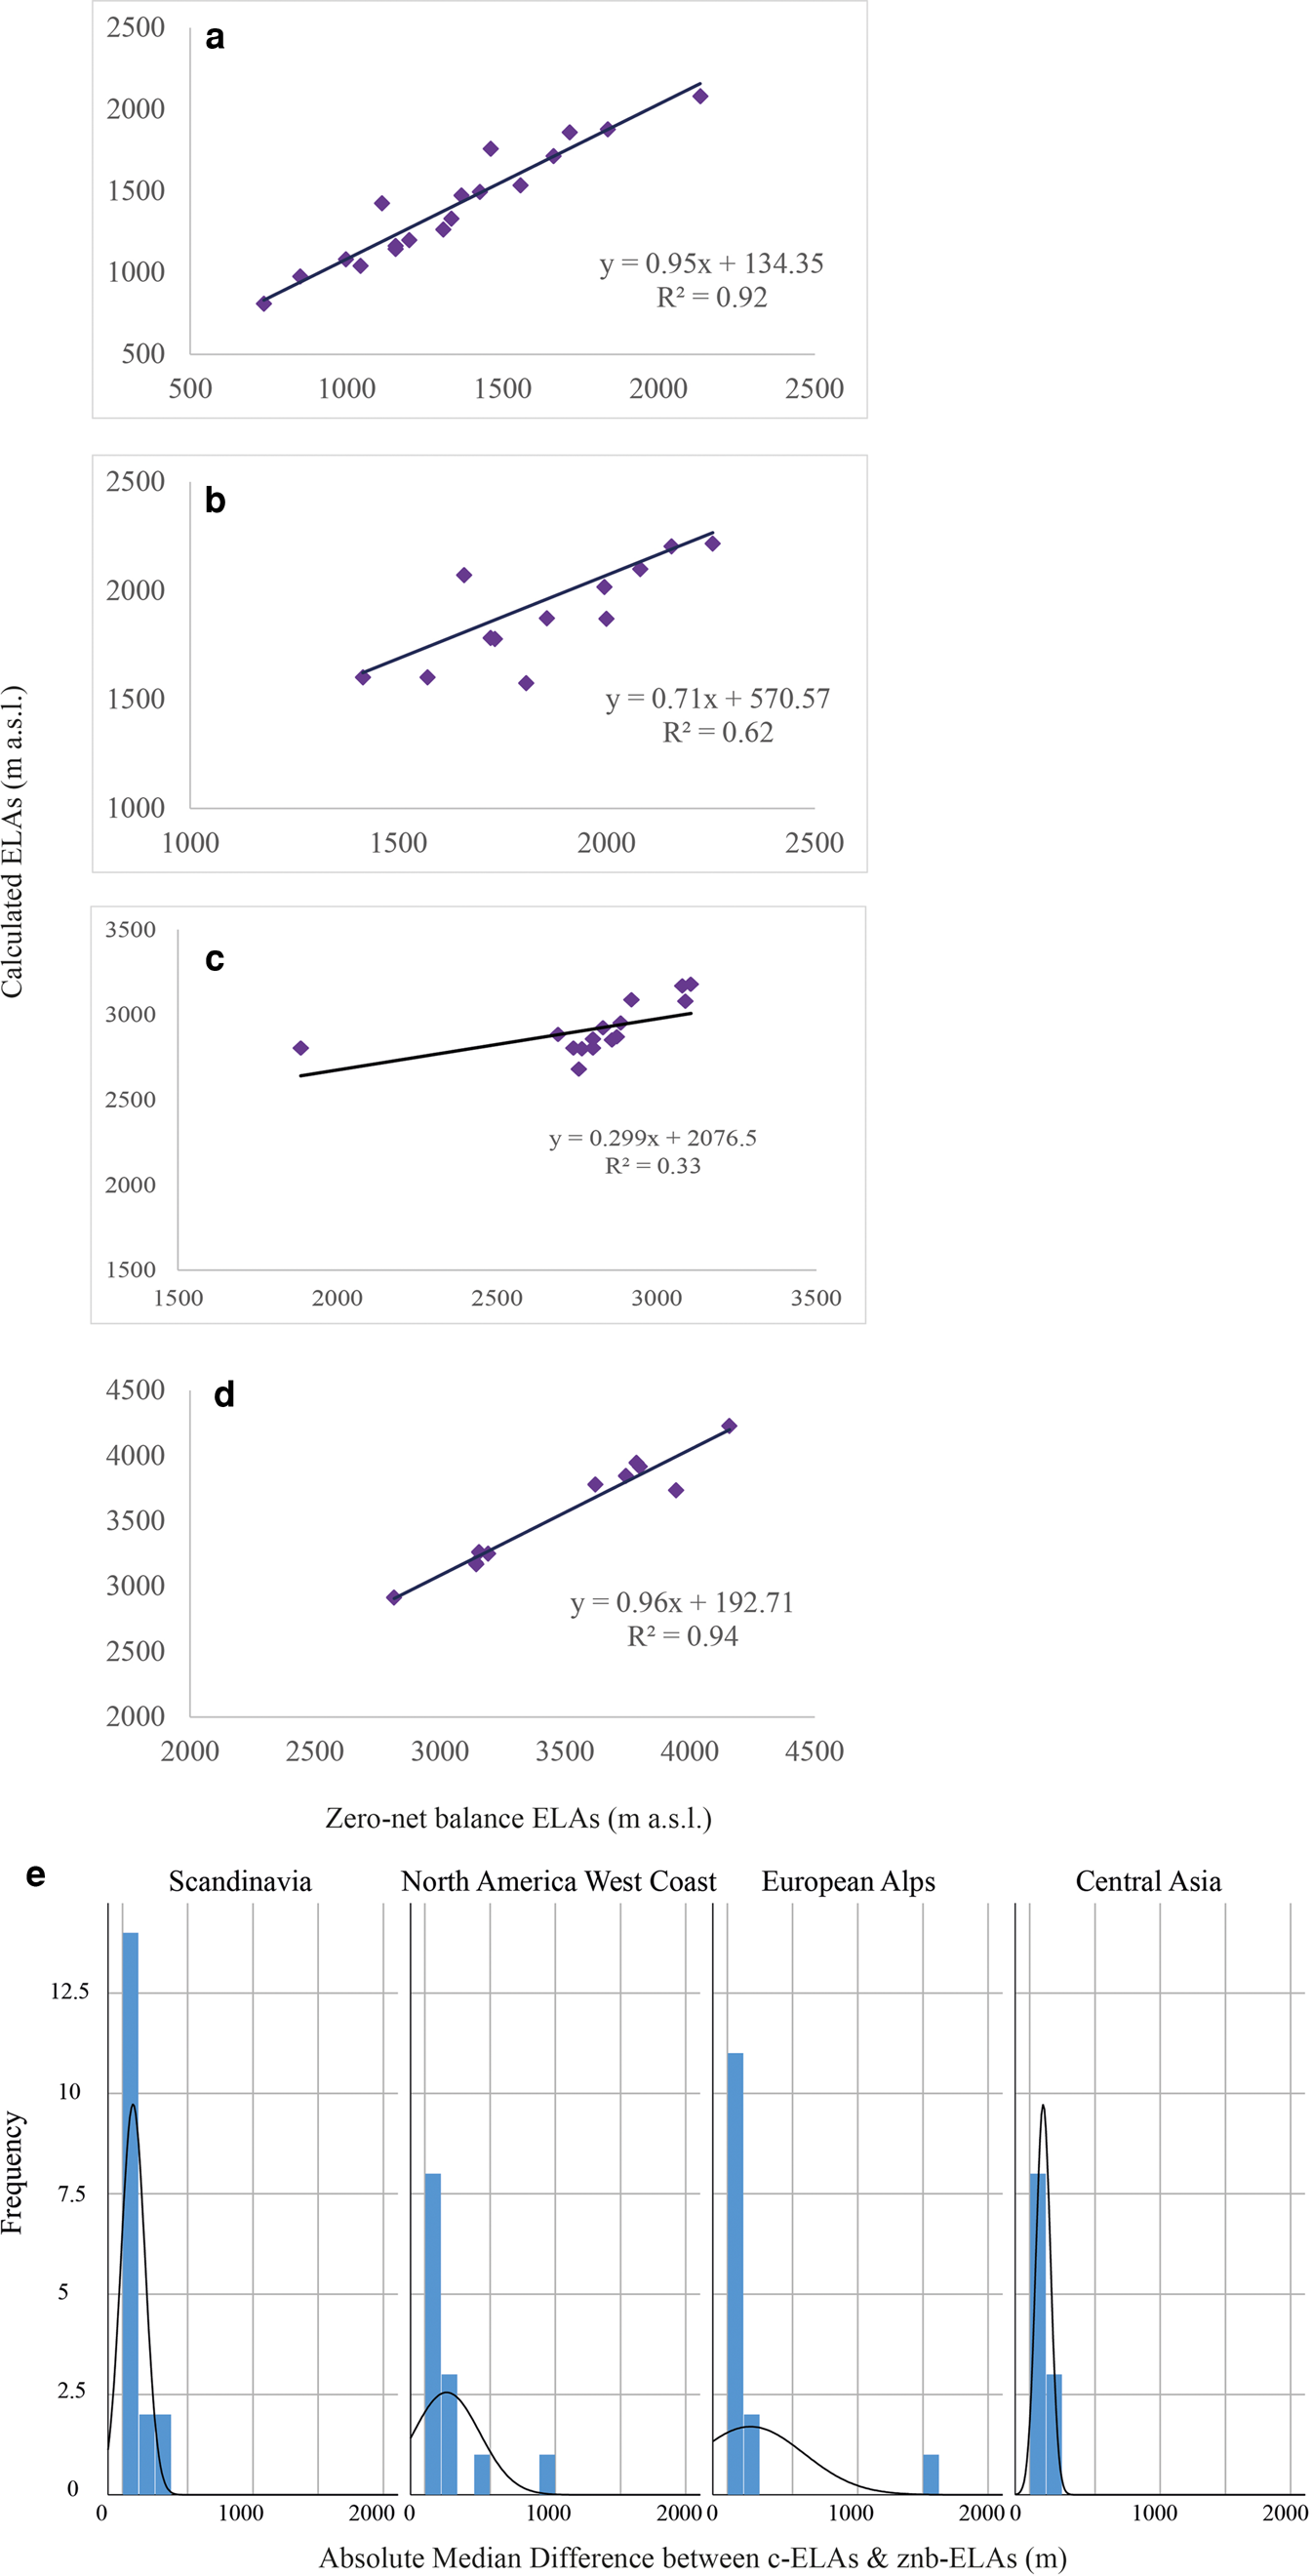
The West Coast Rocky Mountain region contained 13 glaciers and the c-ELAs vs the znb-ELAs are again strongly correlated (r 2 = 0.62). The absolute median difference is 47 m (Fig. 5b), which is a slight improvement in the result generated using the global median AABR, i.e. 51 m.
For the European Alps, we noted that Vernagtferner had a much higher AABR (2.6) than any of the others in this regional group. A Cook's distance test demonstrates that it is a statistical outlier within the dataset used by Rea (Reference Rea2009) to calculate the regional AABR for the alps. Calculating the regional AABR without Vernagtferner generated a European Alps regional mean AABR of 1.29. c-ELAs for the European Alps dataset of 14 glaciers were then calculated using this new regional AABR. However, this yields only a weak correlation between c-ELA and znb-ELA (r 2 = 0.33) with the absolute median elevation difference being 69.5 m. Although large, this elevation difference is lower than the 111 m obtained using the global median AABR.
The Central Asia dataset contained 11 glaciers with the c-ELAs and znb-ELAs having the strongest correlation (r 2 = 0.94). Despite this, it has the largest absolute median difference between the two at 100 m which is the same if the global median AABR value is used to determine the c-ELAs.
4. Discussion
4.1. Global indices
The first important result from this study relates to the frequency distribution analyses of the data used by Rea (Reference Rea2009) to generate the global mean AABR (Fig. 4). This has demonstrated that the data are skewed (i.e. not normally distributed), implying that the global mean AABR value of 1.75, calculated by Rea (Reference Rea2009), and widely adopted in many other studies (e.g. Finlayson and others, Reference Finlayson, Golledge, Bradwell and Fabel2011; Mills and others, Reference Mills, Grab, Rea, Carr and Farrow2012; Pellitero and others, Reference Pellitero2015; Pellitero and others, Reference Pellitero2016; Dong and others, Reference Dong2017; Pearce and others, Reference Pearce, Ely, Barr and Boston2017; Rea and others, Reference Rea2020) should not be used. Given the skewness of the frequency distribution, the global median AABR value of 1.56 is instead the statistically valid measure and we recommend this be used for ELA calculation going forward. The global AAR dataset of Rea (Reference Rea2009) is similarly skewed but in this instance the median has the same value as the mean (0.58).
Using the global median AABR, the results show a very strong correlation (r 2 = 0.99) between the c-ELAs and znb-ELAs, and hence that there is significant promise for using this method to upscale globally from the limited number of znb-ELA measurements we hold from hard-won annual field surveys. The differences between c-ELA and znb-ELA, calculated using the global median AABR, are not normally distributed about the mean, so we report the absolute median difference between the two as 65.5 m. This is only marginally better than the 66.5 m absolute median difference obtained using the global AAR (Figs 4a, b). These differences can be considered as the potential error associated with calculated glacier ELAs using these methods. Given the availability of open-source, community-built datasets such as GLIMS and ASTER, and the rapidity with which c-ELAs can be determined, this motivates further regional to global-scale ELA assessment to be made wherever elevation data and glacier outlines (or the possibility to retrieve them from remote imagery) are available. Such studies may be used to understand how regional to local climate affects glacier mass balance. Importantly, satellite data provide the opportunity for tracking glacier change in remote and difficult to access regions where direct measurements are lacking and unlikely to be undertaken (Rabatel and others, Reference Rabatel, Letréguilly, Dedieu and Eckert2013; Braithwaite and Hughes, Reference Braithwaite and Hughes2020). Prior to the satellite era, aerial photographs and topographic maps facilitate the determination of c-ELAs farther back in time (Meier and Post, Reference Meier and Post1962; Torsnes and others, Reference Torsnes, Rye and Nesje1993), thus offering the chance to track glacier response to climate forcing over longer periods, where changes in ELA might be larger than the potential error associated with c-ELAs. Beyond the period of historical records 3-D palaeo-glacier reconstructions allow the calculation of c-ELAs even farther back in time (Kern and László, Reference Kern and László2010; Ng and others, Reference Ng, Barr and Clark2010; Ipsen and others, Reference Ipsen, Principato, Grube and Lee2017) and these are discussed further below.
4.2. Regional AABRs
Although the global median AABR value of 1.56 has been demonstrated to work well in different parts of the world, the use of regional AABR values could represent an improvement in determining ELAs, when sufficient regional mass-balance time series are available (Table 2). For example, in the North America West Coast, the regional mean AABR gives a median difference between the c-ELAs and znb-ELAs of 47 m, which is an improvement in the 51 m difference obtained using the global median AABR. Similarly, using the regional mean AABR for the European Alps results in a decreased difference of 69.5 m between c-ELAs and znb-ELAs, compared to 111 m using the global median AABR. However, 69.5 m remains relatively high and the reason for this is unclear. It is perhaps linked to the small number of znb-ELAs available for the alps (n = 14) relative to the diversity in climate along the mountain chain ranging from maritime to continental (Reynaud and others, Reference Reynaud, Vallon, Martin and Letreguilly1984). With more measured annual ELA time series, there is the potential for determining westeast and perhaps southnorth sub-regional indices. In contrast, in Scandinavia, the difference between c-ELAs and znb-ELAs is 51.5 m, which is larger than the 40.5 m difference obtained using the global median AABR. In Central Asia, the absolute median elevation difference for the regional AABR and global median AABR results in the same outcome of 100 m. Overall, our results indicate that caution should be exercised when choosing the regional over the global AABR.
With increasing monitoring efforts by, for example, the National Institute for Research in Glaciers and Mountain Ecosystems (INAIGEM) in Peru (e.g. Fischer and others, Reference Fischer2016; Nussbaumer and others, Reference Nussbaumer2017) and inventories in the Himalayan region (Bolch and others, Reference Bolch, Wester, Mishra, Mukherji and Shrestha2019) by the Geological Survey of India, Space Application Centre, and Indian Space Research Organization in India (Singh and others, Reference Singh2016) and others such as ICIMOD (https://www.icimod.org/), the availability of long-term measured glacier mass-balance time series for these currently less represented areas (i.e. Himalaya and Andes) will likely increase. As more data become available for these areas, it will allow for the determination of additional regional AABR values. Until these become available and are shown to be superior, we recommend the use of the global median AABR of 1.56 for the determination of glacier ELAs everywhere, except for the European Alps and North America West Coast where the use of the respective regional AABR indices provides reduced uncertainty.
4.3. Palaeoclimate applications
c-ELAs have been widely applied in palaeoclimate studies where palaeoglaciers are reconstructed, and palaeo-ELAs calculated (e.g. Pearce and others, Reference Pearce, Ely, Barr and Boston2017). The general procedure is to reconstruct the 3-D surface of the palaeoglacier using an equilibrium profile approach, which requires only evidence for the ice front position, for example a frontal moraine, and the bed topography, obtained from a DEM of the glacier catchment (Pellitero and others, Reference Pellitero2016). Other less rigorous approaches have also been utilised, for example, cirque floor altitudes, toe-to-headwall altitude ratio and maximum elevation of lateral moraines (e.g. Miller and others, Reference Miller, Bradley and Andrews1975; Torsnes and others, Reference Torsnes, Rye and Nesje1993; Benn and Evans, Reference Benn and Evans2010; Barr and Spagnolo, Reference Barr and Spagnolo2015; Pellitero and others, Reference Pellitero2016; Pearce and others, Reference Pearce, Ely, Barr and Boston2017). The reconstructed 3-D surface and the AABR or AAR indices allow the c-ELAs to be easily determined (Pellitero and others, Reference Pellitero2015). For the first time it has been demonstrated here that the median absolute difference between c-ELAs, calculated using the median global AABR (1.56), and znb-ELA is 65.5 m and only marginally worse, for the global AAR (0.58) at 66.5 m. For most palaeoglacier–palaeoclimate studies this error is relatively small in comparison with the errors on other proxies required for quantification of palaeoclimate. The ELA of modern glaciers has been linked directly to climate via several empirical relationships, with Ohmura and others (Reference Ohmura, Kasser and Funk1992) and Ohmura and Boettcher (Reference Ohmura and Boettcher2018) being the most widely used. In palaeoglacier–palaeoclimate studies if the mean summer air temperature (June, July and August for the Northern Hemisphere) can be determined, for example from chironomidae (Cronin, Reference Cronin1999); Tremblay and others, Reference Tremblay, Shuster, Spagnolo, Renssen and Ribolini2018) or other proxies (Baker, Reference Baker and Gornitz2009; Farmer and Cook, Reference Farmer and Cook2013), these empirical relationships, in combination with the palaeo-c-ELAs, may be used to derive quantitative estimates of palaeoprecipitation. The latter is an extremely useful palaeoclimate parameter and is not well quantified using any other proxies. In addition, palaeoprecipitation may provide information on air mass advection which can be used at a regional scale to reconstruct past atmospheric circulation patterns (Rea and others, Reference Rea2020). Here, we consider the implications of our findings for such palaeoclimate reconstructions.
4.3.1. Uncertainty in palaeotemperature estimation using c-ELAs
In order to assess the implications of the absolute median difference between c-ELAs and znb-ELAs identified above, for palaeoclimate reconstructions, the following approach was applied. The 65.5 m is converted into a temperature difference (ΔT ELA) using a standard lapse rate of 6.5°C per 1000 m, giving a ΔT ELA of 0.42°C (Table 3). When the same methodology is applied to the regional AABR values, for Scandinavia ΔT ELA = 0.33°C, for the North America West Coast ΔT ELA = 0.31°C, for the European Alps ΔT ELA = 0.45°C and for Central Asia ΔT ELA = 0.65°C (Table 3). These levels of uncertainty compare very favourably with those associated with the palaeotemperature proxies used to determine mean summer air temperature at the ELA, which are on the order of ±1.5°C (Rea and others, Reference Rea2020). It is palaeotemperature that is mostly readily available in most instances which is then used to determine the palaeoprecipitation.
Temperature differences (ΔT ELA) resulting from differences between znb-ELAs and c-ELAs when using the global AABR and AAR, and regional AABRs where n ⩾ 10
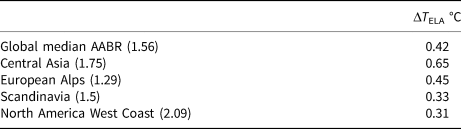
In each case, a lapse rate of 6.5°C/1000 m is assumed.
4.3.2. Uncertainty in palaeoprecipitation estimation using c-ELAs
The relationship of Ohmura and others (Reference Ohmura, Kasser and Funk1992), subsequently Ohmura and Boettcher (Reference Ohmura and Boettcher2018), is the one most widely utilised to convert palaeotemperature to palaeoprecipitation at the ELA, so this is used to assess the effect of the ΔT ELA identified above. From Ohmura and Boettcher (Reference Ohmura and Boettcher2018):

where at the ELA, T is the mean summer air temperature (J, J, A in the Northern Hemisphere), P is the annual precipitation, a = 966, b = 230 and c = 5.87. As this relationship is a second order polynomial, the implications of ΔT ELA on palaeoprecipitation (ΔPPELA) will vary, depending on T. Table 4 shows the effect of ΔT ELA, calculated for the uncertainty associated with global AABR and AAR, on ΔPPELA for a range of T from 1 to 8°C, which is appropriate and representative of many alpine environments. As an example, T = 4°C gives an annual precipitation of 2098.9 mm a−1 and±ΔT ELA (±0.42°C for the global AABR), gives an annual precipitation of 2098.9 ± 119 mm a−1, ~±5.7%. For the mean summer temperature range, 1–8°C, the ΔPPELA ranges between ±104 and 141 mm a−1 (±4.2–8.1%) (Table 4). This level of uncertainty is relatively small, and this approach remains one of the few proxies able to quantify palaeoprecipitation.
Effect of the elevation difference between measured and c-ELAs converted to precipitation at the ELA (ΔPPELA) in mm a−1 and as a percentage of total precipitation for the global median and global mean AABRs and global AAR

Precipitation varies as a polynomial function of mean summer temperature (T) so a range of T (1−8°C), representative of alpine environments are provided by way of example.
It has been demonstrated that the regional AABRs for the European Alps and the North America West Coast provide a better estimate for the znb-ELAs but the improvement for Scandinavia is very small (Table 3). Taking the uncertainty of these regional AABR values and a mean summer temperature of 4°C, gives an ΔT ELA and an ΔPPELA of ±0.33°C and 92.5 mm a−1, ±0.31°C and 85.2 mm a−1, ±0.45°C and 126.3 mm a−1 and ±0.65°C and 182.5 mm a−1, respectively, for Scandinavia, the North America West Coast, the European Alps and Central Asia. The decision to use a regional AABR value is more difficult for palaeoglaciers. To do so, makes the implicit assumption that the mass-balance regime in the past was the same as the present-day. It would seem reasonable to use the regional AABRs for Holocene reconstructions unless there was a known and significant difference in the environment relative to the present, for example a contrasting sea ice cover up-wind of the region. Beyond the Holocene, where the boundary conditions relevant to the mass-balance regime are more likely to have been substantially different, it may be more prudent to apply the global median AABR and/or AAR for palaeoglacier-climate studies.
The global mean AABR value of 1.75 reported by Rea (Reference Rea2009) has been widely used in palaeoglacier-climate studies. It has been demonstrated here that the mean is statistically invalid, so the global median AABR of 1.56 should be used for future palaeoglacier ELA calculations. However, Tables 1 and 3 show that using the median AABR makes only a minor improvement in terms of the overall uncertainty, and so is unlikely, in the vast majority of cases, to change the palaeoglacier ELAs calculated previously using the global mean AABR. This will concomitantly make little difference in subsequent palaeoclimate calculations; therefore, authors need not systematically revisit all their previous studies. The only exception to this might relate to glaciers with significantly skewed hypsometry e.g. where a large portion of the accumulation and/or ablation areas lie close to the upper or lower elevation range. In these instances, palaeoglacier ELAs, calculated using the global mean AABR, may alter significantly if the global median AABR (1.56) is used.
5. Conclusions
It has been demonstrated that glacier ELAs, comparable to the znb-ELA determined from a time series of measured annual mass balance, can be calculated for extant glaciers using satellite-derived glacier topography and geometry in combination with AABR and AAR indices. The mean global AABR value of 1.75, reported by Rea (Reference Rea2009) is statistically incorrect, and the global median AABR value of 1.56 should be used instead. ELAs calculated using the global median AABR provides the closest approximation to the measured ELAs (absolute median difference of 65.5 m). In the case of modern glaciers in the European Alps and the North America West Coast, the use of a regional mean AABR reduces the absolute median difference to 69.5 and 47 m respectively (Table 3).
In relation to the two key climate parameters that are linked to the ELA of glaciers, mean summer temperature and annual precipitation (Ohmura and Boettcher, Reference Ohmura and Boettcher2018), the absolute median elevation difference between the calculated and the znb-ELAs is relatively insignificant (Tables 3 and 4), and significantly less than, for example, the error on modern gridded climatology (New and others, Reference New, Hulme and Jones1999; Hijmans and others, Reference Hijmans, Cameron, Parra, Jones and Jarvis2005), which are often used to assess the mass balance of glaciers lacking direct climate measurements (Haylock and others, Reference Haylock2008; Mohr, Reference Mohr2008; Engelhardt and others, Reference Engelhardt, Schuler and Andreassen2012).
ELAs of reconstructed palaeoglaciers, determined using the approach outlined above, can be viewed as a robust proxy for palaeoclimate with less uncertainty than many other palaeoclimate proxies. Palaeoglacier ELAs remain one of the few proxies with which to quantify palaeoprecipitation and the errors on those estimates are more dependent on the palaeotemperature proxies. In palaeoglacier-climate research, the application of bespoke ArcGIS toolboxes (Pellitero and others, Reference Pellitero2015, Reference Pellitero2016) can rapidly yield palaeoglacier reconstructions and palaeoglacier ELAs. In the future for such research, we recommend calculating the ELA using the global median AABR value of 1.56, while cautioning the use of regional AABRs.
Supplementary material
The supplementary material for this article can be found at https://doi.org/10.1017/jog.2021.100
Acknowledgements
The Scottish Alliance for Geoscience Environment and Society (SAGES) and the University of Aberdeen are acknowledged for funding the PhD studentship awarded to Rachel P. Oien. The scientists who have over the years provided data to the WGMS and GLIMS are gratefully acknowledged, as are the USGS and NVE. Additionally, the authors thank Dr Dmitri Mauquoy for assistance regarding the statistical analyses used above. All data used in this publication are publicly available.
Data Availability
ASTER GDEM is a product of METI and NASA (ASTER GDEM Version 2: Accessed July 2019) (https://asterweb.jpl.nasa.gov/gdem.asp). GLIMS and NSIDC (2005, updated 2018): Global Land Ice Measurements from Space glacier database. Compiled and made available by the international GLIMS community and the National Snow and Ice Data Center, Boulder CO, USA. DOI: 10.7265/N5V98602 (http://www.glims.org/MapsAndDocs/ftp.html; https://www.glims.org/maps/glims). Farr, T. G. and others (2007), The Shuttle Radar Topography Mission, Rev. Geophys., 45, RG2004, doi:10.1029/2005RG000183 (https://www2.jpl.nasa.gov/srtm/). WGMS (2017): Global Glacier Change Bulletin No. 2 (2014–2015). Zemp, M., Nussbaumer, S.U., Gärtner-Roer, I., Huber, J., Machguth, H., Paul, F. and Hoelzle, M. (eds.), ICSU(WDS)/IUGG(IACS)/UNEP/UNESCO/WMO, World Glacier Monitoring Service, Zurich, Switzerland, 244 pp. Based on database version: doi: 10.5904/wgms-fog-2018-11 (https://wgms.ch/data_databaseversions/). WGMS, and National Snow and Ice Data Center (comps.). 1999, updated 2012. World Glacier Inventory, Version 1. [2018]. Boulder, Colorado USA. NSIDC: National Snow and Ice Data Center. doi: https://doi.org/10.7265/N5/NSIDC-WGI-2012-02 (January 2019) (https://nsidc.org/data/G01130/versions/1).


 Open access

