

Introduction
The construction industry, despite its importance in local economies around the world, has long been underrepresented in business historical studies and debates. In the twentieth century, a lack of perceived modernization led scholars and policymakers to deplore the industry’s alleged inefficiency and backwardness,Footnote 1 while ordinary construction enterprises were insufficiently analyzed within a business historical tradition dominated by Chandlerian views, in which internationalization and scaling up of business activities formed the principal long-term evolutions.Footnote 2
The focus was, as a result, on the few productivity gains and economies of scale that made their way into construction. Large contracting firms employing hundreds of workers were already active in public works in late seventeenth-century England,Footnote 3 but the nineteenth century was especially seen as a period of major change. Leading the way were contractors executing large-scale public works of road, railroad, and canal construction, where the straightforward and repetitive nature of the work enabled economies of scale, which, according to Chandler, promoted the formation of large-scale, hierarchically managed corporations.Footnote 4
Others stressed that these giants were not representative of most construction enterprises that remained organized on a small scale and local basis. Remarkable continuities were observed between the Ancien Régime,Footnote 5 and the industrial era, when construction remained highly fragmented. In the Netherlands, construction firms had an average of 5.4 workers, almost the lowest average workforce of all sectors in 1905.Footnote 6 In Belgium, the percentage of enterprises with fewer than 5 workers only slightly declined from 88 percent to 84 percent between 1890 and 1961, while the share of companies with more than 50 workers barely surpassed 1 percent.Footnote 7 In France, there were similarly only 1 percent of large companies in the second half of the twentieth century and a growing rate of enterprises with 1 to 5 workers: from 81 percent in 1954 to 85 percent in 1971.Footnote 8
As a result, it was argued that construction could not fit into the common long-run scheme of increasing mass production, nor could it aspire to accomplish it in the future. Instead, construction came in sight of historians working on the “other side of industrialization.”Footnote 9 The “historical alternatives to mass production” approach emerged in the mid-1980s with the key argument that the variability of demand could prevent mass production from taking over in certain industries, where producers’ specialized skills allowed them to flexibly adapt the volume and composition of output and rapidly introduce new products in response to shifts in demand and other changing circumstances.Footnote 10
Piore and Sabel mentioned construction in 1984 as the “first example of these counterprinciples in operation.”Footnote 11 In 2005, Harris and Buzzelli developed the idea into a business–historical conceptual framework for the construction sector. Drawing also on the work of economists writing on the current housing scene,Footnote 12 they argued that, in construction, economies of scale did not pay off when flexible specialization was required to address complex and differentiated working conditions. Builders always had to adapt to an unpredictable and unstable market determined by the idiosyncratic nature of construction demand and by differentiated submarkets of housing, commercial, and other types of infrastructure. This resulted in an industry consisting for the most of small-scale, transient, and volatile forms of entrepreneurship and business organization.Footnote 13
Scholarship on the business history of construction thus straddles 2 paths, with some interpreting construction as a prime example of “historical alternatives to mass production,”Footnote 14 while others stress the rise of innovative building technologies, productivity gains, and economies of scale in the sector.Footnote 15 This paper aims to bridge the gap between both strands of literature by providing a long-term analysis that quantifies the relative importance of both interpretations and how they changed over time. It questions to what extent the industry was indeed characterized by the persistent importance of flexible specialization and to what degree processes of firm growth, industrialization, and market concentration made their way into the construction sector.
To answer these questions, a quantitative empirical basis is required. This paper provides a long-term quantitative benchmark study for the construction sector using a database of 16,714 construction enterprises established in Brussels between 1830 and 1970. This approach is inspired by the recent work of Bennett et al., who studied ordinary and small-scale forms of entrepreneurship from a long-term quantitative perspective. Drawing on a database of over nine million English and Welsh entrepreneurs between 1851 and 1911, they advocated a broad definition of entrepreneurs as “those responsible for undertaking a business activity, responding to business opportunities by trying to meet or anticipate demand and organize supply, assembling factor inputs, achieving a return for their skills by successfully doing so, and bearing the risk if they failed.”Footnote 16 In this way, they reacted to narrower, Schumpeterian definitions of entrepreneurs as “those who innovate.”Footnote 17
Such a broad definition of entrepreneurship makes it possible to include the many self-employed sole proprietors running a construction business for their own account and at their own risk.Footnote 18 It yields new insights on how most businesses operate daily, and if and how that changed over time. Applying it to construction provides an excellent gateway to grasping the atypical historical position of the industry within the broader world of business and entrepreneurship. Ordinary entrepreneurs and their small-scale businesses form the cornerstone of the construction sector, about which too little is known.Footnote 19
The database makes it possible to address the research question on 3 levels. First, the relative number of enterprises (on 1,000 recently constructed buildings in the city) indicates the evolution of the extent to which the urban construction market was fragmented across many enterprises or concentrated within the hands of fewer firms. Second, firm sizes (in terms of workforce numbers) indicate long-term changes in the importance of small-scale versus large-scale enterprises. Third, the role of capital needs is studied by looking at the changing rates of company formation, which made it possible to pool capital resources within larger, more capital-intensive firms.
Each level is assessed both for the industry as a whole and for its different constituent building trades, which point to widely varying levels of labor and capital intensity within the construction sector. Later research can enrich this picture by including other variables, such as the effects of the character and availability of finance on the organization of the industry. This paper aims to provide a first long-term quantitative benchmark study for the construction sector, based on evolutions in (relative) enterprise numbers, firm sizes, and rates of company formation.
The findings make clear that between 1830 and 1970, a divergence occurred at the core of the construction sector. The labor intensity of on-site building ensured that most of the construction market remained highly fragmented over large numbers of enterprises working on a small scale, whereas dynamics of consolidation and firm size growth increasingly characterized not only the trades where capital-intensive, mechanized shop-floor production processes made economies of scale possible but gradually and to a more limited extent affected several on-site building trades.
In the next section, I provide additional context on the particularities of construction and the construction sector, first in general and then focusing on Belgium and Brussels. Next, I explain the sources and methods used to compose the database of construction enterprises, followed by 3 levels of analysis for the long-term evolution of the construction sector: enterprise numbers, firm sizes, and company formation. Each of these sections is subdivided into an analysis of the construction sector as a whole and one that distinguishes between the different building trades.
Context: Building in Belgium and Brussels
Reflecting on the peculiar nature of construction and its fragmentation across many small-scale enterprises, several scholars have identified different causal dynamics.Footnote 20 According to Lacoste, they can be reduced to 3 atypical characteristics of the industry’s final product, buildings.Footnote 21
The magnitude of buildings ensures that they must be produced on-site, where unique production conditions result in few opportunities to achieve economies of scale. On-site work also implies a need for spatial proximity between supply and demand. Given the ubiquitous demand for housing and other types of built infrastructure, construction enterprises must be equally scattered. They form an essentially localized industry, as Whitehand argued,Footnote 22 and are a vital part of local economies in cities, towns, and often even villages across the world.Footnote 23
Second, industry fragmentation is promoted by the heterogeneity of buildings, which requires the work of various specialized building trades. For them, the need for flexibility and adaptation implies the use of labor-intensive production methods with low levels of mechanization. This, in turn, produces low requirements for (initial) capital input and poses a low threshold for market entry. With the right tools and knowhow, virtually anyone can establish their enterprise. This low capital intensity enables many small construction enterprises to be newly established but hinders the accumulation of capital within firms and their development into large companies.Footnote 24
Finally, the durability of buildings ensures that they represent long-term financial investments, which makes the demand for buildings volatile, and the building sector highly susceptible to economic trends. Prosperous times resulted in the formation of many new, small firms, whereas economic crises led to high transience and turnover rates.Footnote 25 This trend susceptibility also results in a flexible composition of the labor force. Firms can rapidly contract whenever necessary, and therefore rarely aim for long-term firm growth.Footnote 26 The volatility of demand also reduces opportunities for integrating workers of all building specialisms into a single enterprise, which produces a far-reaching division of labor and the prevalence of subcontracting work to small skill-specialist firms.Footnote 27
Taken together, these dynamics form a complex set of interacting forces that constrain firm growth and promote the small-scale organization of construction enterprises. It is also broadly observed in Belgium, a country that has benefited from a broad historical interest in the production of its built (urban) space. Specifically, with regard to the economic history of construction in nineteenth- and twentieth-century Belgium, the works of Vincent Duchêne and Erik Buyst are important. Focusing on the periods 1830–1890 and 1890–1961, they reconstructed figures of capital formation in residential construction and analyzed the causal dynamics behind these long-term evolutions. They included changes on the supply side of the construction market, such as the price and availability of materials, the mechanization of production, and firm sizes in construction.Footnote 28 Based on industry censuses, they observed that construction enterprises were indeed organized on a persistently small scale. During high construction activity between 1896 and 1910, Duchêne even noticed an increased fragmentation of the industry: the proportion of enterprises with 1 to 4 workers increased from 29 to 32 percent, while enterprises with over 10 workers declined from 6 to 5 percent.Footnote 29
However, they concluded that little was known about the long-term evolution of the Belgian construction sector. Buyst recognized the first significant changes in the productivity of enterprises in the early twentieth century, with innovations in the mechanization and standardization of production due to the rise of motor power and electricity and more efficient building methods such as reinforced concrete.Footnote 30 Innovations in building technology and business organization in the Belgian building sector were further studied by Inge Bertels and Jelena Dobbels.Footnote 31 They focused on the growth of public works contractors and general contractors, among whom innovative and large players emerged and who used steam engines on construction sites from the late nineteenth century.Footnote 32 However, by excluding ordinary enterprises in many skill-specialist building trades, from carpenters to plumbers and painters, they left much-needed room for nuance and further investigation.
A valuable conclusion of their research for this study is that Belgian construction enterprises rarely focused exclusively on either residential construction or public works and other large-scale infrastructures.Footnote 33 In the sources as well, no distinction is made between enterprises executing different types of construction activities. Therefore, in this study, these different types are considered. Residential construction, however, formed the vast majority of construction activities. In Brussels, it fluctuated around 95 percent until World War II, after which it dropped to 92 percent by 1961.Footnote 34
Earlier research has made clear that the local scale, rather than the national scale, is the most relevant for studying the structure of the building industry.Footnote 35 As mentioned, construction is a highly localized sector, tied to a specific city or region, where the dynamics of growth and volatility in construction activity, market demands, housing and building cultures, property structures, and planning regulations could strongly differ from one place to the next.Footnote 36
The focus here is on Brussels, which represents a growing and industrializing capital city with expanding and diversifying housing and construction needs, as in much of nineteenth- and twentieth-century urban Europe. Population figures increased from approximately 140,000 residents in 1831, when Brussels became the capital of the new kingdom of Belgium, to a peak of around 1,075,000 in 1970, after which a deurbanization trend set in.Footnote 37 On par with that evolution, the number of buildings in the city increased from approximately 20,400 in 1831 to approximately 184,000 by 1961.Footnote 38
Figure 1 shows the long- and short-term trends in construction activity. For Brussels, only annual averages are available, based on the growth in the number of buildings between 2 population censuses. They nevertheless correspond closely with the more detailed figures for Belgium as a whole, represented as an index of capital formation in residential construction, based on the data collected by Duchêne and Buyst. Only the decades of strong urban growth around 1900 stand out, with much higher construction activity in Brussels than in Belgium as a whole.
Average annual growth in the number of buildings in the Brussels Capital Region (BCR, left Y-axis) and index capital formation in residential construction activity in Belgium (right Y-axis).
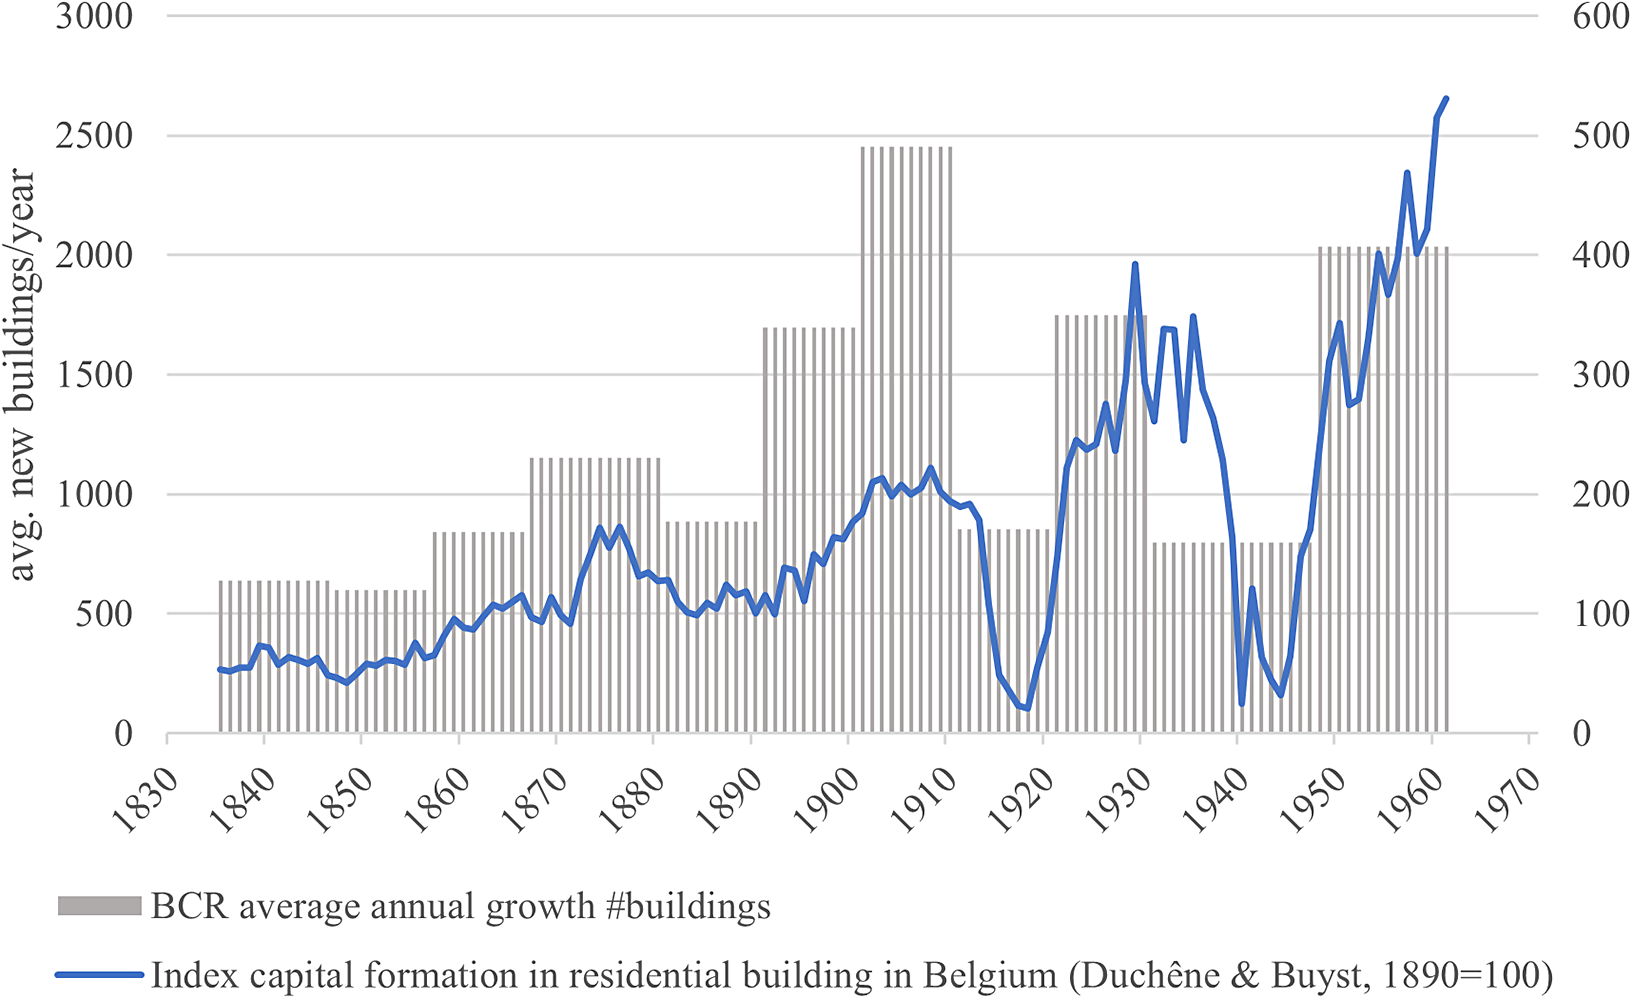
Even leaving renovations aside, this urban growth evidently impacted the local construction sector to a great extent. Based on the Belgian industry censuses, it is possible to collect total employment figures in construction (with enterprises established in Brussels), as shown in Table 1.Footnote 39
Absolute and relative evolution of construction employment in Brussels (data: population and industry censuses, Vandermotten Reference Vandyck, Degraeve, Van de Voorde, Mascarenhas-Mateus and Pires1978)
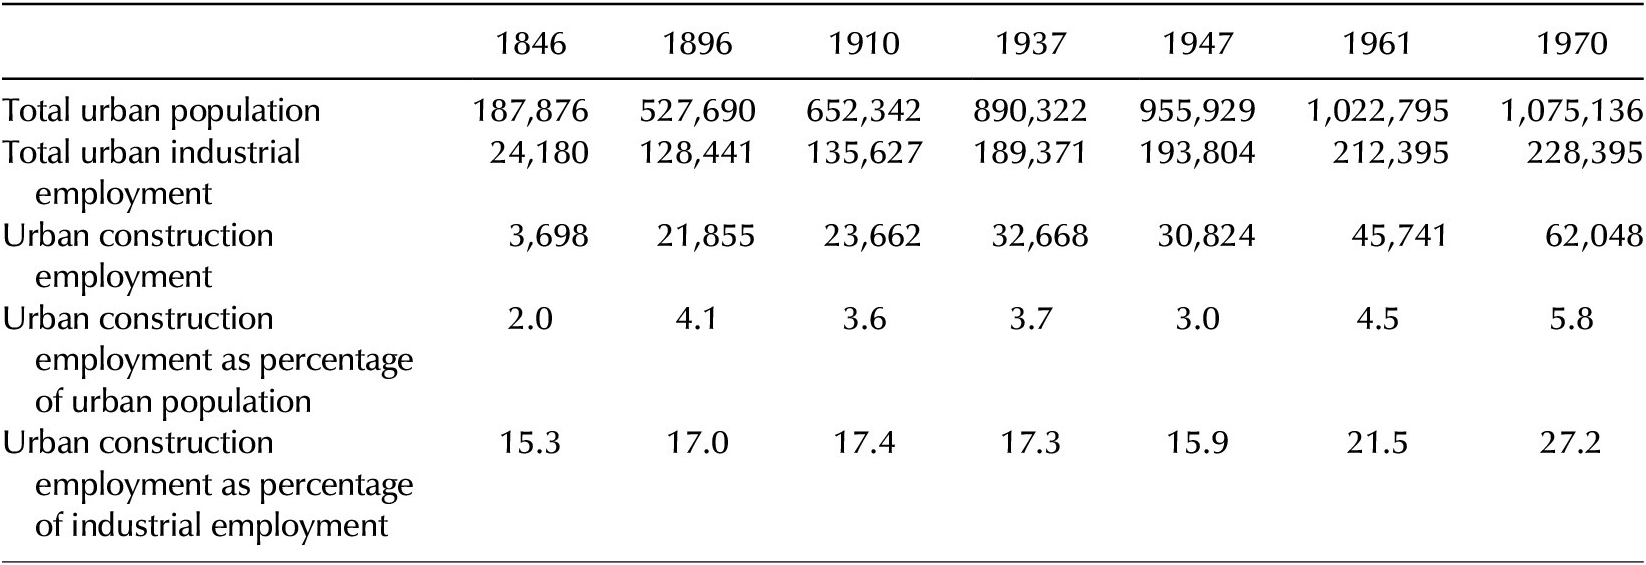
Table 1 shows that in the nineteenth century, absolute growth in construction employment reflected the scale of urban development. Between 1846 and 1896, their relative importance for the entire Brussels population more than doubled. However, as urban industry expanded in general, the relative importance of construction employment within total industrial employment remained fairly constant. In the twentieth century, the sector continued to grow in absolute numbers until World War II, when a slight setback occurred. The construction sector lost some of its importance compared to the total urban population, but it still represented a constant 16–17 percent of urban industrial employment.
However, especially the evolution after World War II exemplifies the atypicality of construction within the urban economy. The rapid postwar growth of the urban fabric ensured a strong continued growth of the construction sector, which almost doubled in importance between 1947 and 1970, not only in relation to the total urban population but also in relation to total industrial employment. While large-scale manufacturing started to leave the city in this period, construction necessarily occurred on building sites and could not be displaced toward industrial zones outside Brussels or abroad.Footnote 40
Simultaneously, the construction sector also had to adapt to the changing qualitative context of housing and building cultures, property structures, and planning regimes specific to Brussels. Brussels has an atypical fabric, which consists less of apartment blocks than of narrow plots, which allows only small, three- to four-story dwellings to be built.Footnote 41 Although they often have a similar floor plan and arrangement,Footnote 42 it produced an immense heterogeneity in housing construction that promoted a small-scale organization of the construction sector. More research on the financing of construction enterprises and speculative building is desirable, but it seems that the plots were often separately developed, either speculative or on contract, which also enabled small builders with relatively little financial means to participate in a fragmented housing development market.Footnote 43
This fragmentation was reinforced by demographic trends that made increasingly small nuclear families the main housing unit, which led to a growing demand for single-household dwellings.Footnote 44 Only from the interwar years, it was partly countered by the growth of (high-rise) apartment buildings in Brussels. New legislation in 1924 on co-ownership in apartment buildings enabled mortgage loans for the acquisition of individual apartments, which promoted investments in apartment buildings.Footnote 45
Drastic changes, specific to Belgium and Brussels, thus characterized the practices and organization of construction in the nineteenth and twentieth centuries. The question is how these changes impacted the forms of business organization and entrepreneurship in construction. Did the industry remain highly fragmented and organized on a mostly small-scale and labor-intensive basis? Or was it characterized by the rise of large-scale, capital-intensive firms and increasing levels of market concentration? Did the latter remain limited to the shop-floor production of building materials and components, or did they also affect the building trades working on-site?
Sources and methods for building a database of construction enterprises
This paper uses a database of 16,714 enterprises active in five sample years (1833, 1866, 1899, 1932, and 1965). They make it possible to compare different timeframes of construction booms, which correspond to upturns in building cycles (as shown in Figure 1).Footnote 46 They also represent different generations of entrepreneurs working under rapidly changing societal and technological conditions. Thus, it is possible to analyze the flexibility with which the construction sector reacted to the demands, opportunities, and challenges of each time frame.
Two sources, both preserved in the Brussels City Archives (BCA), make it possible to record the large number of construction firms. They list enterprises in Brussels along with information on their business activities and organization. The main sources are the city’s trade directories or almanacs of commerce and industry, published annually from 1820 to 1969 for the entire urban agglomeration.Footnote 47 In one part, entrepreneurs are listed per trade, which allowed me to enter those active in building trades into a database. For the first sample year 1833, I used an existing dataset.Footnote 48
To address the shortcomings in the comprehensiveness of almanacs until the 1860s,Footnote 49 I supplemented the first 2 samples with entrepreneurs listed in the fiscal patent registers of Brussels in 1831 and 1864.Footnote 50 These registres des patentables recorded everyone who undertook a commercial or industrial trade, which required the payment of an annual “patent” tax in Belgium between 1795 and 1919.Footnote 51 They list entrepreneurs by address, trade, number of employees, and fiscal class.Footnote 52 They are arranged geographically, so they were scanned entirely to add all construction entrepreneurs to the database.
Based on these sources, I compiled a database in which each entry represents an enterprise and contains information on the name, address, occupation, a possible specification or combination of business activities, indications of family partnerships and other company forms, and (based on the 1831 and 1864 patent registers) the size of the workforce. Because one enterprise could be mentioned in multiple occupational categories and sources, I assigned unique identifications based on similarities in name, activities, and location. This made it possible to determine how many individual enterprises were active in each sample year, the results of which are shown in Table 2.
Composition of the database: records and individual enterprises per source and sample year
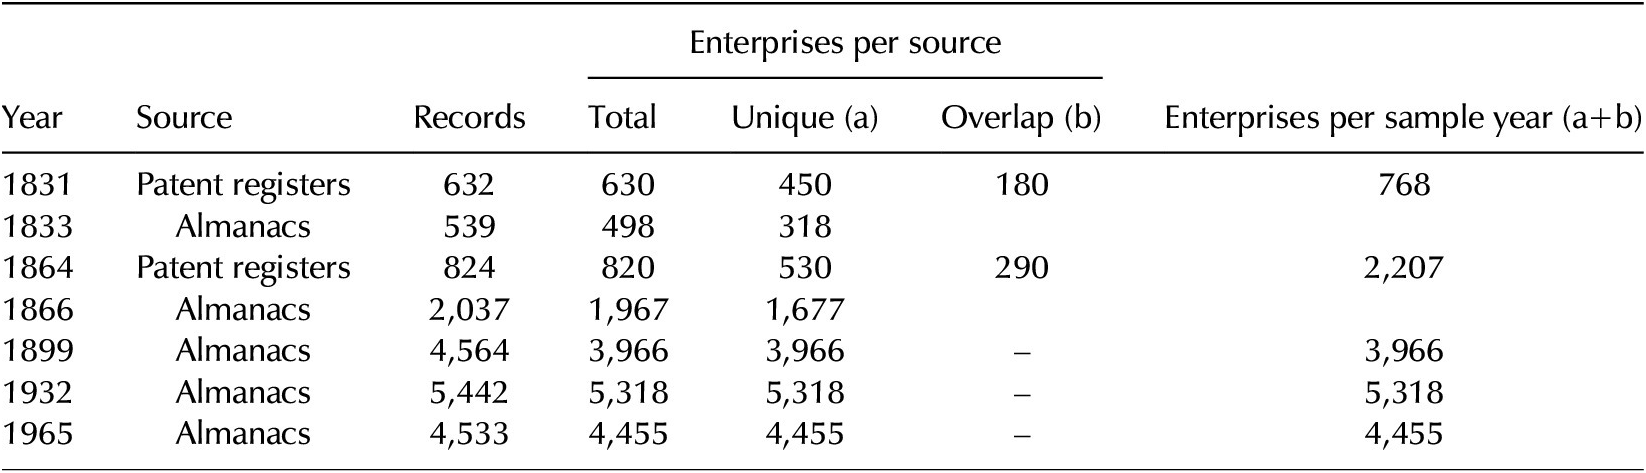
However, we must be aware of the vast gray area between wage labor and entrepreneurship in construction. On the one hand, many were working in precarious positions as falsely self-employed subcontractors. On the other hand, unregistered ventures by wage laborers working as self-employed “on the side” have contributed to an immense amount of unreported work.Footnote 53 These informal enterprises remain untraceable in these sources and should form the object of further study; however, there are no indications that their importance radically changed over time.Footnote 54 The focus here is necessarily on officially registered enterprises, which provide a representatively large image of the construction sector at any given time.
Enterprise numbers: market concentration versus fragmentation
The first approach to evaluate long-term evolutions in construction involves analyzing enterprise numbers. Absolute numbers are useful to assess the extent to which entrepreneurship kept pace with urban growth, but enterprise numbers relative to the number of recently constructed buildings in the city are more revealing because they indicate whether the construction market was concentrated in the hands of a few firms or fragmented across many enterprises. Both trends are discussed as follows: first, for the industry as a whole; then, a distinction is made between different building trades.
Long-term changes in enterprise numbers
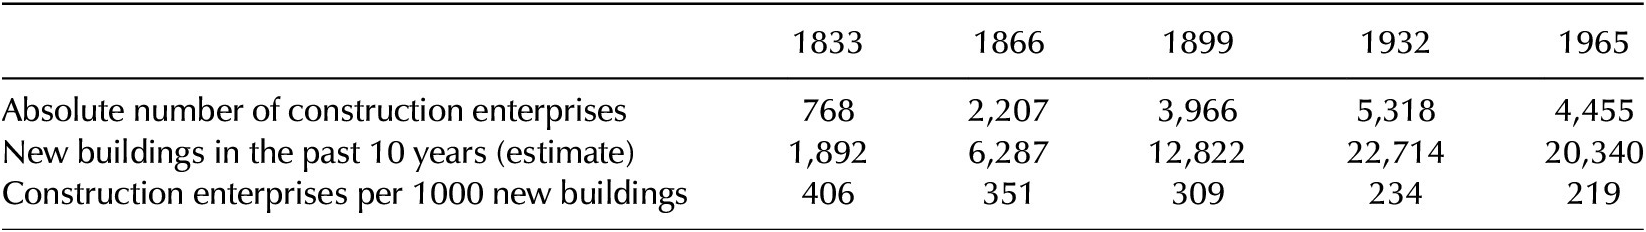
From the different methodological steps undertaken in processing the data, we arrive at the total enterprise numbers per sample year, as shown in Table 2. The first logical step in analyzing long-term change in enterprise numbers consists of verifying whether they increased nearly proportionally to the extent of urban growth, which would only be the case under constant productivity.Footnote 55 Table 3 shows the average annual change in the number of enterprises between 2 sample years and compares an index of construction enterprise numbers (1833=100) with an index of the number of buildings in the city, derived from cadastral data and population censuses, which shows the extent of urban growth.Footnote 56
Absolute numbers of construction enterprises and buildings in Brussels (data: BCA almanacs and patent registers, population censuses, cadastral data)
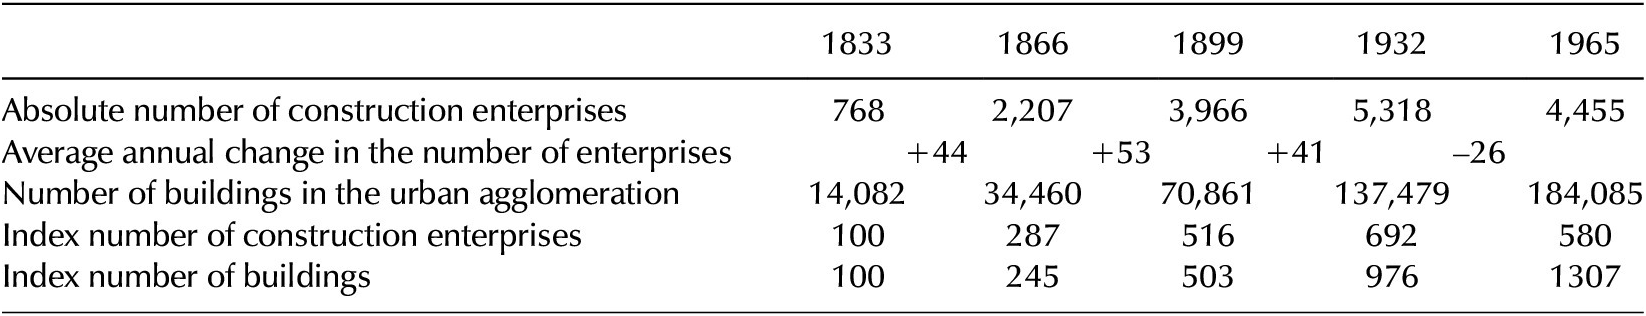
In absolute terms, the total number of construction enterprises grew until 1932. The sevenfold increase in 100 years testifies to the vast expansion of the city and the construction sector. Especially in the late nineteenth century, rapid growth occurred in approximately 53 enterprises per year. Looking at the indexed data shows that, during the nineteenth century, the expansion of the construction sector even ran slightly ahead of urban expansion itself.
This changed in the early twentieth century. Between 1899 and 1932, the annual growth in the number of construction enterprises slowed and no longer kept up with the number of buildings. Between 1932 and 1965, there was even an absolute decline in the number of enterprises, while the city continued to grow. This suggests an increasingly concentrated construction market in the twentieth century when fewer enterprises could cater to a persistently growing city. It is, however, only the manifestation of a trend that has been going on for much longer. This becomes clear by examining the number of construction enterprises relative to the changing size of the urban construction market.
Comparing the number of enterprises with the total population is not ideal because demographic shifts in household sizes and cohabitation patterns strongly impact the demand for buildings.Footnote 57 Specifically for construction, the number of buildings in the city provides a more adequate way to quantify demand. Comparing with the total number of buildings, however, includes many that did not require much construction work. To include only the actual market of newly constructed buildings, I estimated the number of recently added buildings by comparing the number of buildings from the most recent census with that from the previous one.Footnote 58 It reveals how many firms were required to erect 1,000 new buildings. This method does not consider the renovation market, nor does it distinguish between the sizes of buildings. However, since the average number of people per building declined between 1900 and 1960,Footnote 59 the growth of apartment buildings was more than offset by the simultaneous growing demand for single-household dwellings in Brussels.
In Table 4, the relative number of construction enterprises in the city, measured on 1,000 recently constructed buildings, shows a constant decrease from 406 in 1833 to 219 by 1965. Already in the nineteenth century, gradually fewer enterprises were needed to cater to the needs of the local urban market for (new) construction. This contrasts with the steadily increasing relative importance of employment figures in construction, as shown in Table 1. While the construction sector as a whole thus continued to grow, the rate of entrepreneurship decreased. This corresponds with the slowly declining trend, observed by Bennett et al., of the entrepreneurship rate in the construction sector in England and Wales between 1851 and 1911.Footnote 60 In Brussels, the high construction activity until the 1960s makes it unattributable to a decline in demand. Instead, it can be hypothesized that incremental productivity increases result in growing levels of market concentration. However, these dynamics were highly subsector-specific. By shedding light on the differences between various building trades, more conclusive statements can be made.
Relative numbers of construction enterprises in Brussels (data: BCA almanacs and patent registers, population censuses, cadastral data)
Subsectoral change: differences between building trades
From a theoretical perspective on the “historical alternatives to mass production,” more than one production method can be applied in each industry. Typically, a range of firms pursue different strategies, marked by varying degrees of flexible specialization.Footnote 61 The construction sector is similarly fragmented across different subsectors. Harris and Buzzelli argued that housebuilding falls exceptionally close to the “flexible specialization” end of the spectrum,Footnote 62 but providing empirical evidence for this requires disentangling the sector into different building trades.
I selected 10 subsectors: contractors, bricklayers, joiners–carpenters, iron and steel workers, painters, plumbers, plasterers, marble and stone masons, glaziers, and roofers. Despite technological or organizational changes within these trades, they were listed during the entire period, which enabled their analysis over the long run. The selection contains both builders working on site and those who worked (partly) in workshops for the prefabrication of building parts. The paper thus adopts a broad definition of the construction sector,Footnote 63 which makes it possible to consider different levels of labor and capital intensity and productivity changes.
Each subsector’s long-term evolution becomes clear through their absolute and relative numbers of enterprises, as shown in Figure 2.Footnote 64 The absolute figures (in gray) show their expansion in a growing city. As for the construction sector in general, the absolute numbers of joiners–carpenters, plasterers, contractors, and plumbers increased until 1932, after which they declined. Marble and stone masons, bricklayers, iron and steel workers, and glaziers had already peaked in 1899. The number of enterprises owned by roofers and painters, on the other hand, continued to increase until 1965.
Absolute (gray, left Y-axis) and relative (red, right Y-axis, per 1,000 recent buildings) numbers of enterprises per subsector and sample year (1833, 1866, 1899, 1932 and 1965) (data: BCA almanacs and patent registers).
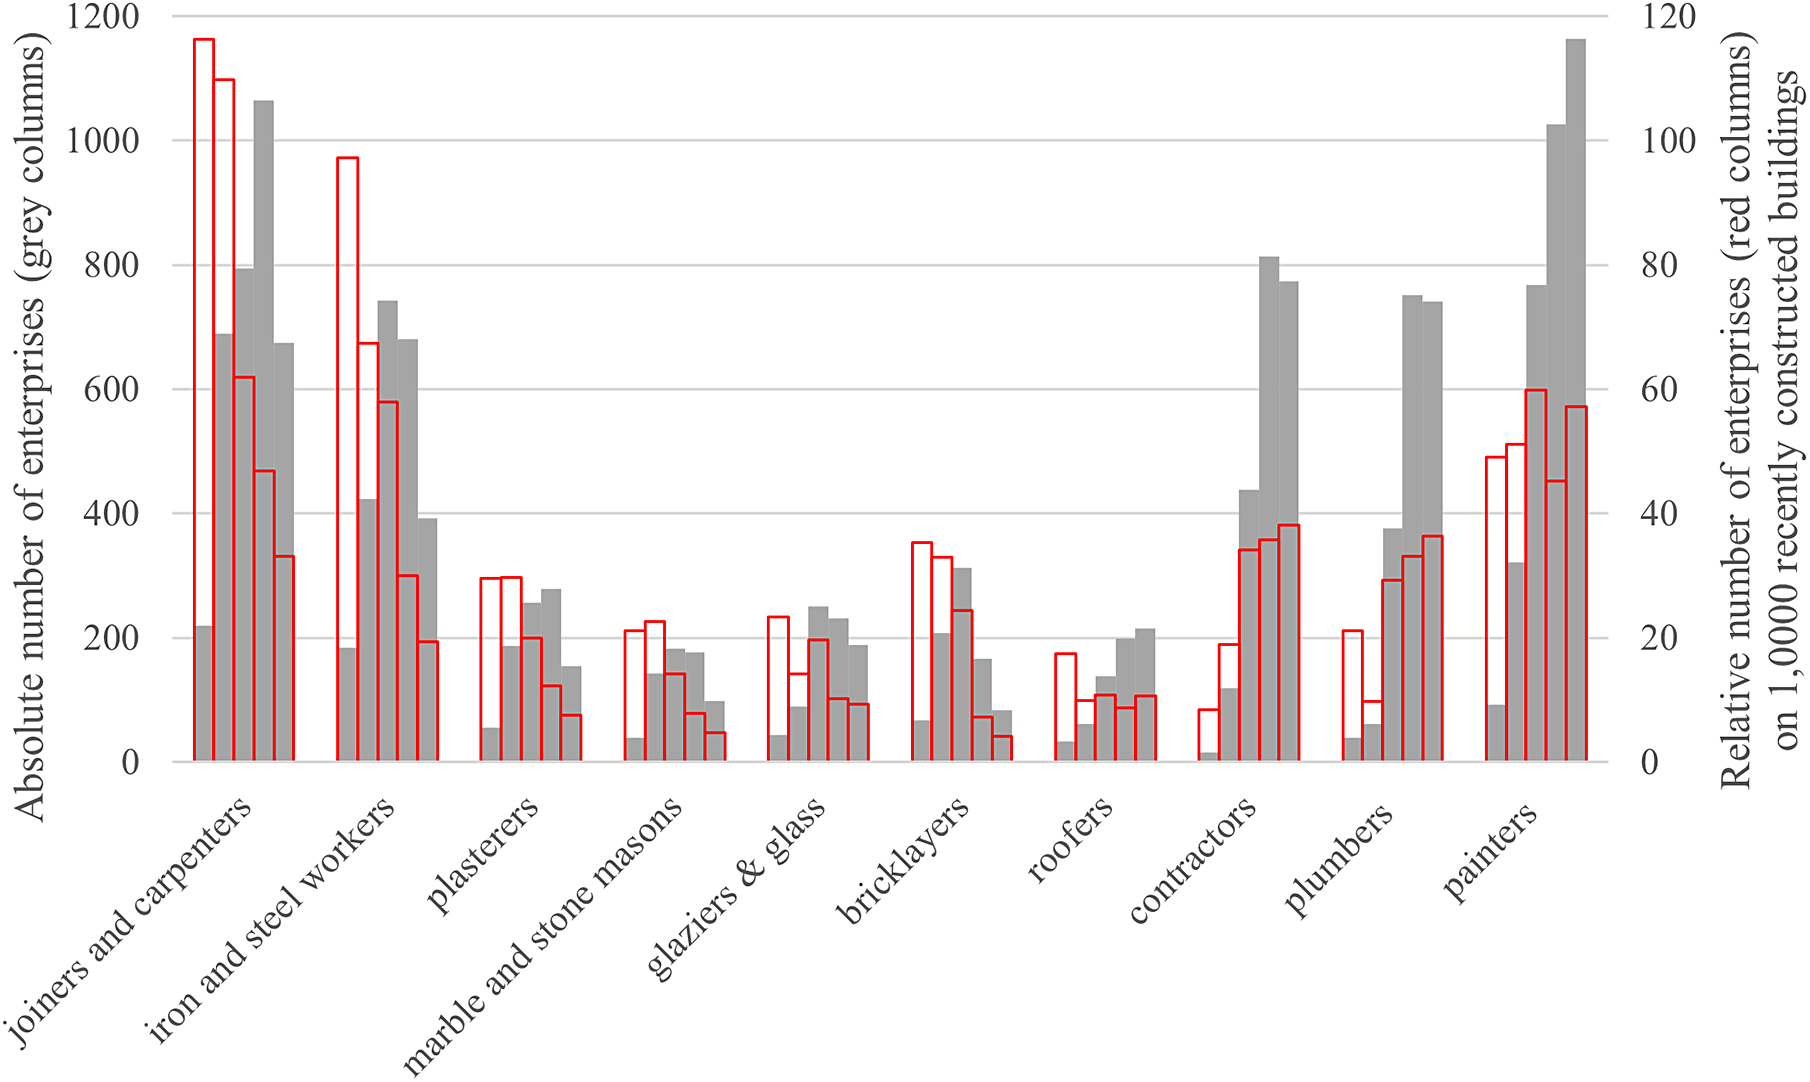
It is again from the relative figures (in red), however, that significant patterns of market fragmentation or concentration become clear. They resulted from interactions between diversification and expansion of demand, on the one hand, and supply-side dynamics with changes in productivity and technological possibilities, on the other. Different trajectories can be distinguished.
First, the long-term market concentration in the construction sector as a whole is best reflected by the numerically most important trades of iron and steel workers and joiners–carpenters. The long-term relative decline in both subsectors meant that fewer firms were required to construct 1,000 buildings. Their increasing labor productivity was at the heart of this evolution. As some of the first sectors to profit from industrialization, economies of scale were particularly achievable in iron and steel manufacturing and woodworking. For many building parts and components in iron and wood, such as locks, stoves, doors, and windows, demand for luxuriously and individually finished goods was increasingly exchanged for cheaper, mass-produced alternatives.Footnote 65 Growing shares of the work were relocated from the building site and into workshops and factories, where productivity increases resulted from mechanized and serial production processes that exchanged labor-intensive for more capital-intensive production methods.Footnote 66 Consequently, the few manufacturers who were able to make these investments outcompeted many other smaller joiners and iron and steel workers in the market, resulting in a relatively declining number of enterprises in these trades.
Several subsectors followed this path of long-term relative decline, but it was preceded or interrupted by a phase of relative expansion. Sometimes, trends in architecture and housing culture result in short-lived growth in demand. High demands for neoclassical decoration,Footnote 67 for example, led to the growth of plasterers and marble and stone masons between 1833 and 1866, after which they declined. Temporary upsurges in demand could also interrupt a long-term decline, as for glaziers (1866–1899).
Industrialization thus deeply affected the structure of the urban construction sector, resulting in long-term declining relative numbers of enterprises in several building trades. While they determined the relative decline in entrepreneurship in the construction sector as a whole, a few others countered this trend by showcasing the pervasiveness of flexible specialization.
This is exemplified, first of all, by the rise of contractors. The rapid urbanization of the nineteenth century involved a growing number, size, and complexity of construction sites. It required increased supervision and coordination, resulting in greater involvement of contractors.Footnote 68 Unlike ironworkers and woodworkers, their work necessarily remained on the building site, where they kept working in labor-intensive ways, without many possibilities for achieving economies of scale.Footnote 69 In the twentieth century, their slowed-down growth suggests that the mechanization of on-site work did result in some productivity increases,Footnote 70 but it did not prevent a continued fragmentation of the contractors’ market. In addition to coordinating and supervising, most contractors completed the construction works themselves. This resulted in the decline of other specialized building trades, such as bricklayers (after 1866) and, to a lesser extent, roofers, an evolution that Powell also observed for Britain.Footnote 71
Plumbers represent a unique pattern of decline followed by a strong expansion. Until 1866, they were similarly subject to processes of market concentration due to the industrialization of lead processing. Around that time, however, plumbers flexibly reacted to the new large-scale demands for domestic hygiene. Their reorientation toward the market of domestic sanitary facilities involved a flexible implementation of new materials, techniques, and production processes.Footnote 72 Consequently, the work of plumbers shifted in the opposite direction: away from workshops and factories and onto the building site, where they had to flexibly adapt their work to heterogeneous production contexts. As a result, plumbers underwent a unique development of increasing market fragmentation after 1866.
Finally, painters’ work remained similarly dominated by on-site labor. This submarket became increasingly fragmented in the nineteenth century and, following a slight setback in 1932, stabilized at a high level of fragmentation in the twentieth century. Followed by contractors and plumbers, painters formed the most numerous building trades in both absolute and relative terms by 1965, which makes these trades prime examples of the enduring viability of flexible specialization in construction.
Long-term trends in business size
Looking at long-term change in the number of enterprises only sketches a part of the picture. The divergent trends of market concentration and fragmentation went hand in hand with changes in the scale on which these businesses operated. If fewer enterprises catered to a growing market, this implied that these firms grew larger, while a fragmented market counted more small firms. Thus, a self-evident complementary approach considers long-term changes in firm sizes.
In contemporary studies, a preferred measure for business sizes in construction is data of physical output, such as the volume of built units,Footnote 73 or data on financial assets,Footnote 74 but their limited availability usually compels business historians to measure the firm size in terms of employment figures.Footnote 75 It has drawbacks due to incremental changes in labor productivity, and specifically for construction, due to changes in indirect employment through subcontractors.Footnote 76 Nonetheless, scholars are largely conclusive on the value of employment figures to indicate hierarchies between (construction) enterprises.Footnote 77
Whereas historiography stresses the persistently small scale of operations for construction enterprises, new evidence from Bennett et al. suggests long-term firm growth in construction. Among nonself-employed entrepreneurs in England and Wales, average firm sizes increased from 9.9 employees in 1851 to 14.7 in 1901. Furthermore, between 1851 and 1881, the number of construction entrepreneurs with 1 or 2 workers decreased, whereas those with 3 or more workers increased.Footnote 78 To what extent did larger-scale firms gain the upper hand in Brussels?
Changing firm size structures in the nineteenth century
In the patent registers, the fiscal class for entrepreneurs in manufacturing sectors was based on the number of workers, which makes it possible to analyze firm size structures.Footnote 79 In construction, only contractors were not taxed based on their labor force. However, for all others, the number of workers should still be evaluated cautiously. As the number of workers formed the basis for the tax rate, entrepreneurs were inclined to minimize it. They filed the patent requests themselves, after which the number of employees was sometimes validated by inspectors.
A second measure of caution stems from the cyclicality of building, which is determined not only by long-term building wavesFootnote 80 but also by seasonal building cycles.Footnote 81 During the off-peak winter season, firms usually lay off part of their workforce. Registration for the patent tax, however, took place at the end of the year, which may have led to an underestimation of construction workforces. However, if additional workers were hired the following year, entrepreneurs often moved to a higher fiscal class.Footnote 82 These class alterations are listed at the end of each register and are considered in this analysis.Footnote 83
Self-employed artisans without wage laborers were exempted in 1864 and were therefore also left out of the sample for 1831. In total, the 1831 sample counts 422 enterprises employing 1194 workers, or 2.8 workers on average. The 1864 sample has 778 enterprises with 4139 workers, or 5.3 workers on average. This average firm size growth is reflected by the changing relative distribution of enterprises in different firm size classes in Figure 3.
Distribution of enterprises and employment over five firm size classes in 1831 and 1864 (excluding self-employed entrepreneurs) (data: BCA patent registers).
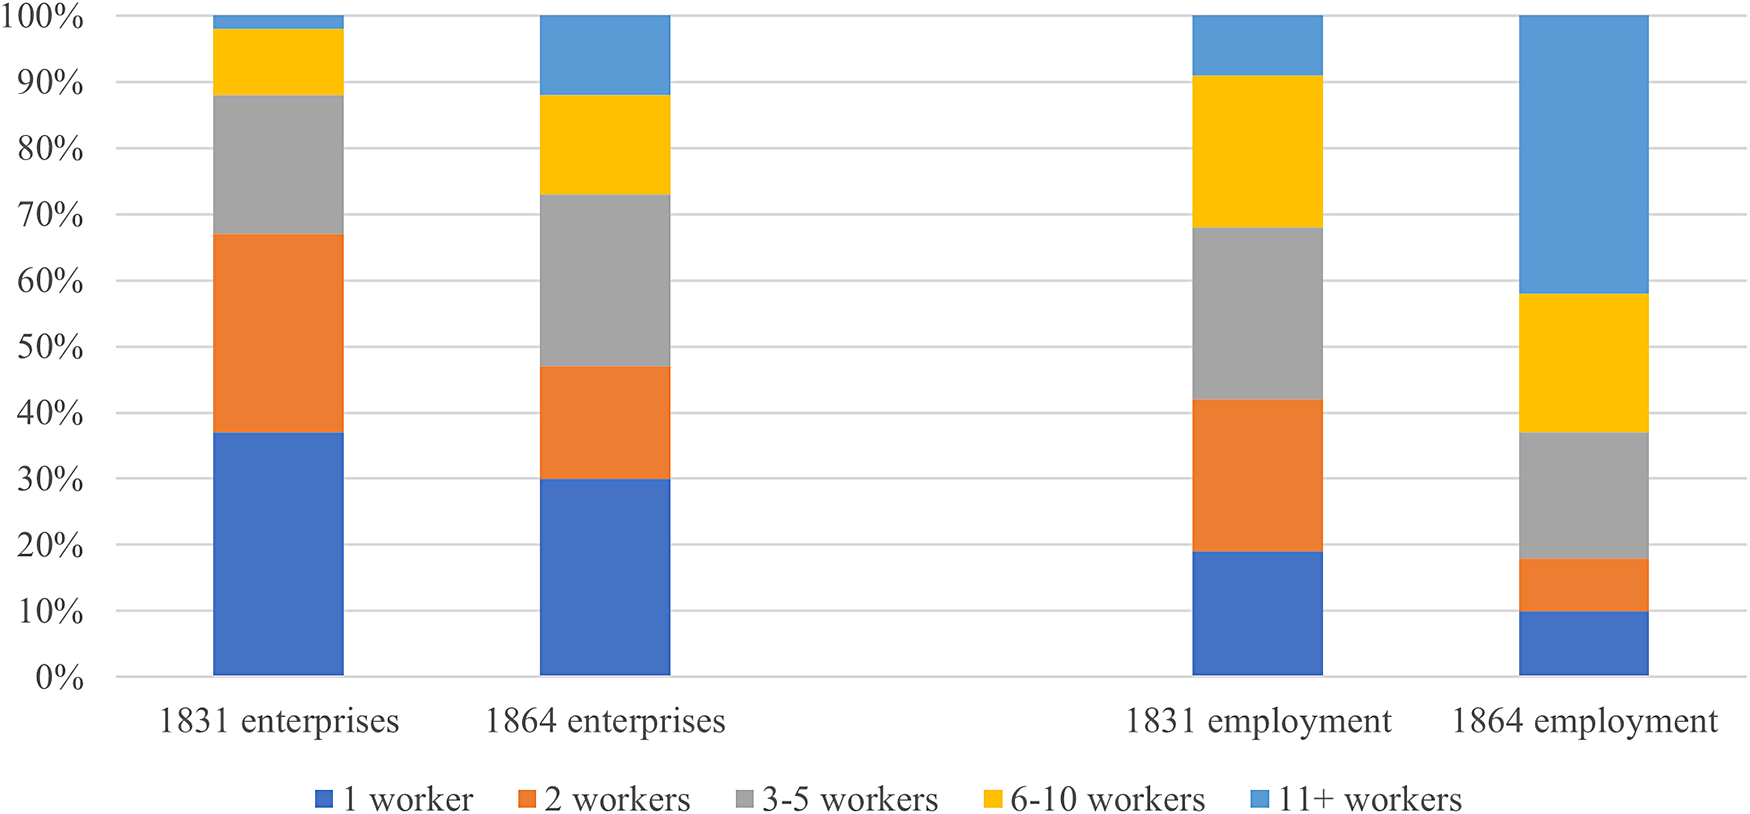
In the previous section, the mid-nineteenth century already came forward as a period of early change with initiating dynamics of market concentration. The workforce numbers show that this evolution was paired with a growth in firm size. Between 1831 and 1864, the proportion of firms with 1 or 2 workers declined, whereas each category of firms with 3 or more workers grew. The distribution of the total employment figures over the firm size categories shows declining rates for firms with fewer than or equal to 10 workers and a strong increase for firms with more than 10 workers. The estimated labor market share of the latter grew from 8 percent to approximately 40 percent in 33 years.
Much of the rare comparable data comes from Britain. In terms of employment rates, Rodger similarly observed that large building firms were disproportionally important in Scottish cities in 1851. Among the nonself-employed, 30 percent of the firms had 10 or more workers, but they employed up to 80 percent of the entire building labor force. He argues that “the Scottish construction industry was far more dependent on the smaller builder than any other part of Britain,” but it was still organized on a significantly larger scale than in Brussels. Only from 1880 did the average size of building firms start to increase in Scotland.Footnote 84 In Brussels, on the contrary, earlier stages of urbanization (1831–1864) could be paired with firm growth in construction as well.
Urban growth, however, did not necessarily result in firm growth. A comparison with data for Brussels from the 1892 patent registers, drafted by Kurgan-Van Hentenrijk,Footnote 85 reveals that instead of a uniform trend toward increasing firm sizes, a trend-susceptible cyclicality drove firm sizes in construction. Between 1864 and 1892, the share of small firms with 1 or 2 workers expanded again, from 47 to 66 percent, while those of 3 to 5 workers (from 26 to 20 percent) and 6+ workers (from 27 to 15 percent) both declined, so each category had returned more or less to its 1831 status. This indicates the cyclical nature of firm sizes in construction, caused by the high construction activity in late nineteenth-century Brussels and similarly observed by Buzzelli for late twentieth-century Canada.Footnote 86 It was also part of a broader trend of market fragmentation in the late nineteenth century, resulting from an increase in diversification and specialist production to cope with growing competition from large-scale manufacturers.Footnote 87
Long-term subsectoral trends
In the nineteenth century, firm sizes were thus highly cyclical. Did long-term firm growth occur in the twentieth century, when the previously observed dynamics of market concentration were reinforced? This trend showed major subsectoral differences, but firm sizes varied significantly between building trades.Footnote 88 While the work in some subsectors required more labor input or was susceptible to a greater division of labor and standardization, others were necessarily organized on a smaller scale, provided too few means for firm expansion, or had too little to gain from it.
Long-term subsectoral patterns in average firm sizes can be evaluated from the patent registers of 1831 and 1864, along with the Belgian censuses of commerce and industry. From 1846 to 1970, censuses were commissioned quite irregularly (on average every 15–20 years) by the government. Per subsector and municipality, they list the number of enterprises and their workforce.Footnote 89 Average firm sizes were obtained per subsector from the 1846, 1896, 1910, and 1937 censuses. In the 1961 and 1970 censuses, they are only available on an aggregated level for the construction sector as a whole.
These data should be handled equally cautiously. On the one hand, industry censuses do not easily allow the assessment of changes in a complex and transforming industry such as construction: some trades frequently switched between categories, for example, while the 1896 census categorized contractors in the municipality where they worked and not where the entrepreneur was established.Footnote 90 On the other hand, as average workforce figures per enterprise, they are influenced by high outliers and exclude information on the much greater proportion of smaller enterprises. Nevertheless, even these average figures never exceeded 13 workers per enterprise, so we can safely assume that these averages do not distort the picture of a persistently small-scale organization in construction. Figure 4 shows trends in average firm sizes per subsector (excluding contractors).
Average firm sizes per subsector (1831–1937), excluding contractors, and for the construction sector as a whole (1831–1970) (data: industry censuses, BCA patent registers 1831 and 1864).
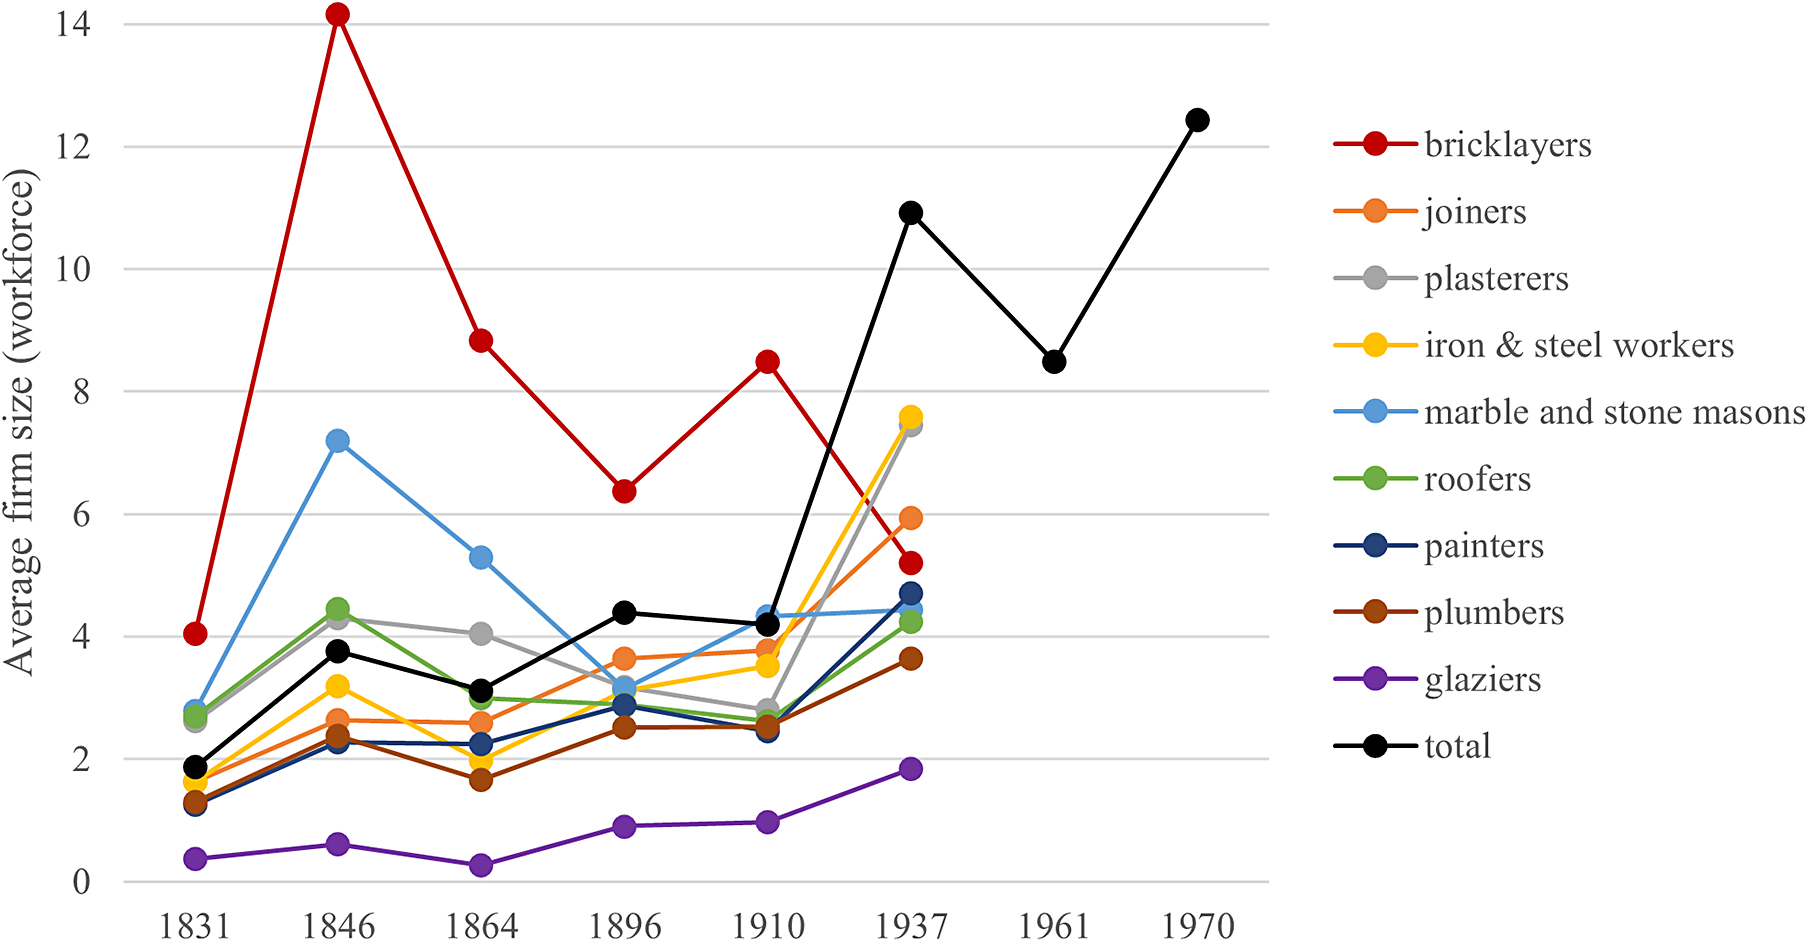
In most subsectors, the average firm size followed a general pattern that determined the long-term trend in the construction sector as a whole. Up to 1910, with less than 5 workers per enterprise, the average workforce in these subsectors remained strikingly low. In particular, glaziers worked on a very small scale. Eventually, between 1831 and 1937, however, there was a slow increase from 0.4–2.7 to 1.8–7.6 workers per enterprise. Such increasing scales of operations align with the earlier observed growth in market concentration and relatively declining enterprise numbers.
In addition to long-term firm size growth, there are noticeable fluctuations. These may have resulted from economic trends and the cyclical nature of building. Although economic growth and increasing construction activity compelled business growth, they also resulted in many new entrants and a dominant trend of market fragmentation. In times of crisis, on the other hand, many enterprises were outcompeted, and market concentration ensued. The peaks in 1846, therefore, may have resulted from higher levels of market concentration following the 1840s crisis, the downward trend between 1846 and 1864 from market fragmentation in the 1860s growth years, the upward trend between 1864 and 1896 from the 1880s crisis years, and the one between 1910 and 1937 from World War 1 and the 1930s crisis.
Nonetheless, the sources’ limitations may also explain many of these fluctuations. The 1846 census underrecorded small-scale industrial activities,Footnote 91 while the decline between 1896 and 1910 can also be explained by the recording of the workforce numbers at the very end of 1910, during the off-peak season.Footnote 92 Most importantly, the seemingly drastic impact of the 1930s crisis on increasing firm sizes should be nuanced, as self-employed entrepreneurs were not considered in 1937.Footnote 93
The general trend for 1831–1937 thus confirms, first and foremost, a persistently small scale of construction operations. To a more limited extent, they were also affected by a gradual overall increase in firm sizes because of industrialization, possibly counterbalanced by the fluctuations and cyclicalities that characterized construction in general.
Apart from this general trend, some building trades followed divergent firm size patterns. Marble and stone masons had relatively large enterprises on average until the mid-nineteenth century, after which their firm sizes rapidly declined.Footnote 94 Their evolution mirrors that of bricklayers, who had the largest firms in 1846, but afterward decline equally set in. We already saw how the rising relative importance of contractors was at the expense of bricklayers. Similarly, while bricklayers’ firm sizes declined, those of contractors steadily increased. Contractors had on average 5.5 workers in 1846, 36.5 in 1896, 25.4 in 1910,Footnote 95 and 43.2 by 1937.
Bricklayers and contractors had in common that their work occurred on the construction site. Their high average firm sizes correspond with Clarke’s observations of their extended use of wage labor on construction sites since the seventeenth century, which allowed them to extract more surplus and accumulate capital.Footnote 96 Their growth resulted from the need and ability to employ a larger body of mostly low-skilled workers on a (semi-) permanent basis on the growing number of large construction sites in a growing city, for instance, for large-scale public works commissioned by local governments,Footnote 97 and for the speculative development of new residential suburbs. However, in Brussels, the fragmented development market was not inaccessible for smaller-scale contractors as well.Footnote 98
Economies of scale, on the other hand, were not at play among contractors. Wellings showed that large on-site housebuilders in Britain did not have substantially greater profit margins than small ones. He argued that their growth is due to a complex interplay of reinvestments and accumulation of capital, extensions of the spatial range of operations, and the personal judicious qualities of entrepreneurs, such as their ability to spread and avoid risks at critical points in the building cycle.Footnote 99
The post-World War II developments are only available on an aggregate sectoral level but indicate the long-term importance of this kind of “on-site” firm growth in construction. The general decline between 1937 and 1961Footnote 100 suggests continued cyclicality and renewed fragmentation of the market, but the 1930s crisis and World War II still had a structural effect on the level of market concentration in the sector, since the general average firm size did not decrease back to the pre-1930s level. Many small firms persisted or were newly established around 1960, but the market balance was shifting in favor of the few big building firms. Between 1961 and 1970, the share of self-employed entrepreneurs increased from 55 to 62 percent of all firms, in line with the favorable economic climate and high construction activity during the 1960s. Simultaneously, however, market concentration occurred. The share of self-employed entrepreneurs in total construction employment declined from 6.9 to 5.6 percent, and the average firm size increased from 8.5 to 12.4 workers in only nine years.
In France, Martini also observed an expansion of large- and medium-sized building firms in the 1960s, largely due to their activities as project developers. Although it accelerated polarization in the construction sector, she argued that it did not fundamentally alter its fragmented structure.Footnote 101 Likewise, for the Canadian housebuilding industry in the second half of the twentieth century, Buzzelli saw that the level of market concentration did not even approach the high degree of centralization common in many other industries.Footnote 102 In Brussels, over half of all construction enterprises had fewer than 12.4 workers in 1970 and were thus still organized on a small scale.
The findings on business sizes thus confirm, first and foremost, the long-term importance of small firms in construction. Nevertheless, the comparison between firm size structures in 1831 and 1864 also indicated an early shift in market dominance in favor of firms with more than 5 workers. Gradual long-term firm growth was partly the result of industrialization and capital accumulation on construction sites. Firm growth was further promoted by crises, but in trend-susceptible industries such as construction, cyclicality and fluctuations remained the rule.
Long-term trends in company formation
Thus far, differences in the capital intensity of the production process and the possibilities for capital accumulation appeared crucial in determining the level of market concentration and firm growth in construction. Scrutinizing the varying effects of industrialization and flexible specialization therefore also requires taking into account the varying levels of capital in the construction sector. As mentioned earlier, the financing of construction enterprises is a major pathway for further research. A provisional solution consists of examining company forms and structures. Because they functioned as instruments to pool resources and mediate corresponding levels of risk, these company forms indicate the level of capital involved in a construction business.
This section discusses different company forms in Belgium, how they did or did not suit the needs of construction enterprises, and how their importance developed over time. For each sample year, I traced every construction enterprise that was not run by a sole proprietor in their personal name. It was not required to list each enterprise’s exact company form in the almanacs; therefore, they presumably represent slight underestimations. However, because an advanced form of corporate organization also functioned as a marketing tool, I assume that a representative majority is included in these figures. They are divided into 6 categories, represented in absolute numbers and percentages in Table 5.
Company forms in the construction sector per sample year (data: BCA almanacs and patent registers)
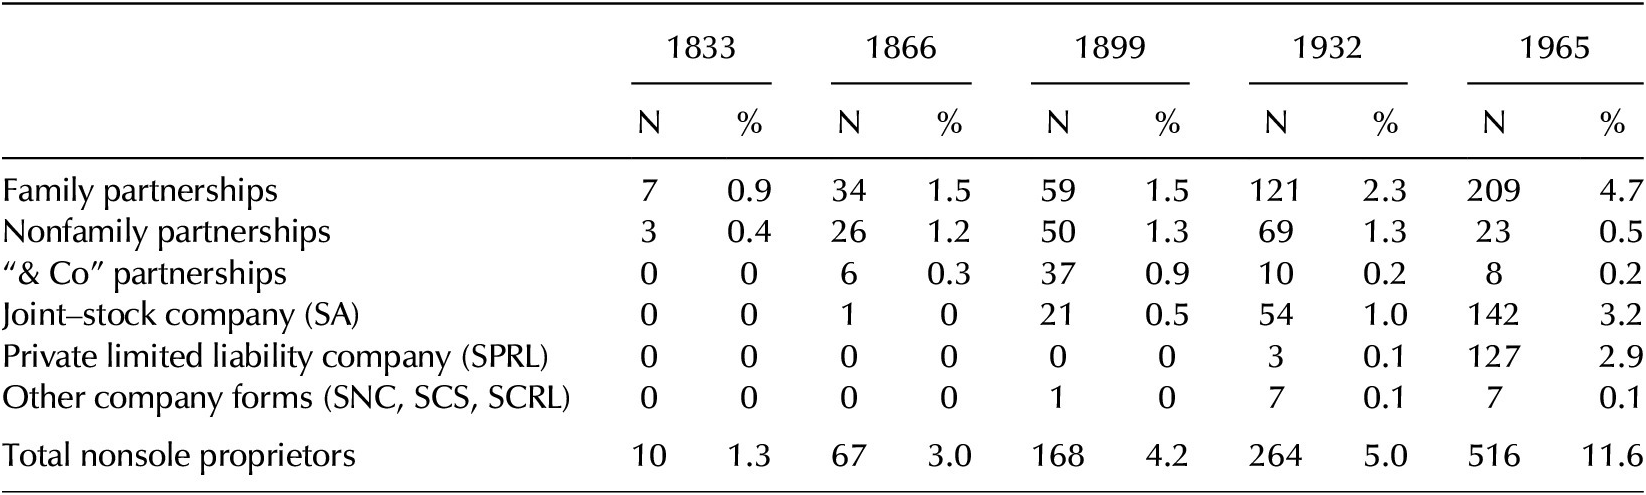
In total, these company forms represent a growing number of enterprises, but the first observation is unavoidable; they constituted only a minority of 1.3 to 11.6 percent of all enterprises. Despite the gradually declining importance of the classic sole proprietorship, it remains the most popular form of business organization. For sole proprietorships, there was no legal framework and no division between private and company property.Footnote 103 The proprietor was personally fully responsible and liable in the case of bankruptcy, so it was the riskiest form of business organization. However, the very few legal obligations, the flexibility of establishment and liquidation, and the possibilities for quick decision-making offered advantages that suited the volatile conditions in construction very well.
However, nonsole proprietorship, although less significant, requires in-depth analysis as well, as it sheds light on the reasons why these company forms were less suitable in construction. Moreover, it expanded eventually. For the small but growing proportion of nonsole proprietors, the changing needs for capital input were addressed by increasingly appropriate company forms.
Family firms and informal partnerships
Just above sole proprietors, in terms of capital needs, were family firms and other informal business partnerships. Partnerships are considered effective mechanisms for business growth by expanding expertise, skills, and capital.Footnote 104 Especially in family firms, they conveniently kept staff monitoring costs low and facilitated the process of business acquisitions.Footnote 105 Family ties were essential to raise capital,Footnote 106 provide (cheap) labor,Footnote 107 and provide training, tacit knowledge, and other informational assets.Footnote 108 Smith et al. argued that family ties particularly suited sectors characterized by smaller firms and low levels of incorporation because they formed a “flexible kind of business organization, which allowed resources to be pooled and risks managed without the costs incurred through incorporation, (…) a useful alternative to incorporation and sole proprietorship.”Footnote 109
Family partnerships were either implicit, where family members worked together as self-employed persons in the same industry, or explicit, where the partnership of 2 or more family members was listed in the company name. The latter were listed in Brussels almanacs and patent registers, allowing for a longitudinal analysis of the importance of family ties in the construction industry. In the category of family partnerships in Table 5, all businesses are included for which 2 or more family members at the head of the firm are mentioned: “and son(s),” “father and son,” “(and) children,” “brothers (and sisters),” “widow and son,” “Mrs. and son,” “and wife,” as well as undefined kinship ties between 2 persons with the same surname.
The rate of explicit family partnerships increased from 0.9 in 1833 to 4.7 percent by 1965. However, they only form a visible fraction of family firms. In England and Wales, in 1881, only 34 percent of all partnerships between fathers and sons, as well as between brothers, were explicit. In construction, there was a similar rate of 36 percent explicit partnerships.Footnote 110 Therefore, we can assume that also the actual importance of family firms in the Brussels construction sector far exceeded these percentages.
Closely related to the informality of family ties were nonfamily partnerships, between people with different family names, and “& Cie” (and Co.) partnerships. The latter especially thrived around the turn of the century as a fashionable business term.Footnote 111 Their importance declined between 1932 and 1965 when they were overtaken by incorporated partnership forms that represented more advantages for nonrelated business partners. Together with family partnerships, they can be considered as “non-incorporated partnerships.” Due to the growth of family partnerships, their joint relative importance still increased from 1.3 to 5.4 percent between 1833 and 1965. This shows that such informal partnerships, especially those undertaken within the family, formed an increasingly important middle ground in construction between sole proprietorships and incorporations.
Incorporation in construction
The role of informal partnerships grew, but even greater change can be observed with incorporated company forms in construction. In the nineteenth and twentieth centuries, various types of corporate partnerships were created and adapted in Belgian commercial legislation in response to changing economic circumstances and business needs. The most influential form was the joint-stock company or Société Anonyme (SA), established by the French Code de Commerce in 1807.Footnote 112 An SA was highly suitable for injecting a lot of capital into an enterprise and minimizing risk. Strict rules were imposed that required government authorization for its establishment. Initially, establishing an SA, therefore, was a costly and complicated venture reserved only for the nation’s largest enterprises. Unsurprisingly, very few SAs were active in the Brussels construction sector during this period. In 1866, there was 1 SA active in steel production (the SA pour la fabrication des aciers), which could imply high capital needs. Only in 1873 did the liberalization of the commercial legislation remove all government interference in the creation of an SA. As a result, growing numbers of SAs were established in construction as well, especially in the twentieth century, when a small but increasing share of firms experienced growing capital needs that were most appropriately addressed by an SA.
Three other corporate forms are only occasionally mentioned and were, therefore, probably not very well suited for the capital needs in construction. There was only 1 limited partnership (Société en Commandite Simple, SCS) in 1965. It featured both liable commissioned associates and “silent” commissioning associates, who only provided funds and were not involved in the management. Cooperative partnerships with limited liability (Société Cooperative à Responsabilité Limitée, SCRL) also had limited success. There were eight SCRLs in 1932 and 6 in 1965. Lastly, there was 1 general partnership (Société en Nom Collectif, SNC) in 1899 and 2 in 1932. They required no minimum capital, and the input of partners could also consist of labor. However, they were personally fully liable, so this type of partnership was only suitable when risks were low, which explains its limited success in the building sector.
In 1935, a new corporate partnership form was created, the personal partnership with limited liability (Société de Personnes à Responsabilité Limitée, SPRL). It bridged the gap between joint-stock companies (SA) and general partnerships (SNC), which was required to regain the trust of financial investors during the 1930s crisis. Within an SPRL, each partner was only liable for the capital they had initially invested. Especially for nonfamily partnerships in construction, limited liability partnerships presented an appropriate alternative corporate form that increased the chance of success.Footnote 113 Unsurprisingly, then, while SPRLs made a great advance in the Brussels construction sector after 1932,Footnote 114 the number of nonfamily partnerships drastically declined during this period.
Taken together, corporate partnerships represented a growing share, from 0.05 percent of construction enterprises in 1866 to 6.2 percent by 1965. Bennett et al. observed comparably low but increasing rates of business incorporation in all sectors in England and Wales, from 0.2 percent in 1851 to 2.2 percent in 1911. There, the number of incorporated firms particularly increased from the 1880s crisis years on.Footnote 115 Economic downturns appeared to accelerate a shift in market dominance in favor of the corporate sector, where higher profits could be made by a small but increasing number of enterprises that were able to grow into large, hierarchically managed concerns.Footnote 116 In the Brussels construction sector, the largest expansion in incorporation occurred between 1932 and 1965. The 1930s crisis, World War II, and the postwar urban growth produced growing needs for capital and liability in construction, as well as opportunities for business growth, which could be increasingly addressed and accommodated by these new company forms.
Capital-intensive versus labor-intensive subsectors
The rates of company formation nevertheless show large subsectoral differences. Table 6 displays the percentage of company formation per subsector, containing the 6 aforementioned categories. The sequence is based on the rates for 1965, which are ranked from high to low.
Percentage of company formation per subsector and sample year (data: BCA almanacs and patent registers)
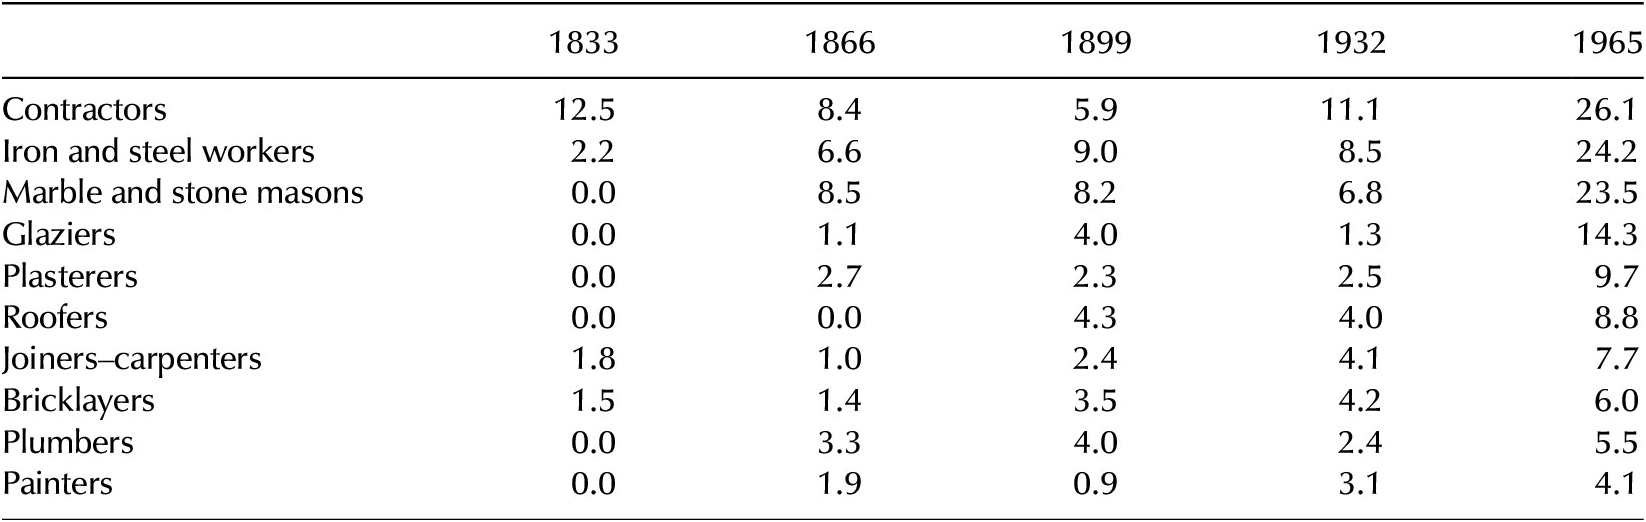
The subsectoral rates of company formation span a wide range in each sample year: from 0–12.5 percent in 1833 to 4–26 percent in 1965. Moreover, the rates appear to be relatively path-dependent. Plumbers and painters, for example, are always found at the bottom of the ranking. Together with plasterers, roofers, joiners–carpenters, and bricklayers, their rates of incorporation never exceeded 10 percent. On the other hand, marble and stone masons, iron and steel workers, and contractors consistently had relatively high percentages of company formation, particularly from the middle of the twentieth century, when their rates reached around a quarter of all registered enterprises.
These findings resonate with my earlier observations on the impact of industrialization and market concentration (such as with iron and steel workers), on on-site firm growth (with contractors), and on persistently small scales of operation (with painters, roofers, and plumbers). The high capital intensity of the mechanized production of iron and steel building parts, marble, and eventually glass also implied a need to mediate greater financial risks and ensure greater profits made through partnerships and within large, hierarchically managed concerns. Similarly, opportunities for firm growth and capital accumulation on construction sites resulted in high rates of company formation among contractors.
At the other end of the spectrum are highly labor-intensive building trades, characterized by low rates of company formation. Fewer to no economies of scale could be obtained by roofers, painters, plumbers, etc., who ceaselessly had to adapt their work to the particularities of the building site. While some joiners–carpenters mechanized production, obtained economies of scale and competed many others out of the market, many remaining ones reoriented toward the renovation market and continued working in labor-intensive ways. For them, as for the vast majority of the construction sector in general, informal and flexible forms of business organization remained the most advantageous.
Conclusion
Looking at long-term evolutions in enterprise numbers, firm sizes, and rates of company formation among construction enterprises in Brussels between 1830 and 1970, this paper argues that in this period of strong urban growth, a divergence occurred within the construction sector, under the influence of the counteracting forces of urbanization and industrialization. Owing to the variety and labor intensity of on-site construction work, nearly the entire construction market remained highly fragmented over large numbers of enterprises working on a small scale. Market fragmentation even increased in trades where on-site work became increasingly important, such as contractors and plumbers. In general, average firm sizes never exceeded 13 workers, and by 1965, 88 percent of enterprises were sole proprietors with limited capital needs.
In contrast, the construction sector was also affected by the dynamics of market concentration, firm growth, and incorporation. Relocating work from the building site into a more capital-intensive, mechanized shop-floor production process made economies of scale possible and allowed a small number of entrepreneurs to outcompete many others. On the construction site as well, dynamics of consolidation and firm size growth occurred. The expansion of labor forces, especially by contractors, caused some firms to accumulate capital and evolve into large-scale firms. Dynamics of market concentration and firm size growth were initiated in the mid-nineteenth century. Then still part of a cyclical process, they had more lasting effects in the twentieth century, accelerated by economic crises and aided by increasingly appropriate company forms.
In this way, the structure of the building sector aptly reflects the divided historiography of the industry itself. By providing a long-term quantitative framework that clarifies each side’s developing relative importance over time, this paper has aimed to bridge the gap between the scholarly work that stresses a Chandlerian track of firm growth and increasing productivity in construction,Footnote 117 and theoretical reflections on the persistent importance of flexible specialization.Footnote 118 Overall, while processes of firm growth, industrialization, and market concentration did make their way into the construction sector, this was only to a very limited extent, so most enterprises working on-site, on a small scale, and in labor-intensive ways represent the long-term viability of flexible specialization as an alternative pathway for the efficient organization of industrial activity.
While Brussels served as a representative case for the strongly growing and industrializing (capital) cities of Western Europe, the specificity of its urban fabric and development had particular effects on the organization of the urban construction industry. Scarce comparable data on construction enterprises from other cities and countries show that the fragmented property structure in Brussels, with its predominantly single-household dwellings embedded in planning policies, promoted a particularly pronounced fragmentation of the construction market. The cyclicality of construction had its effects on the capital as well. In particular, in the late nineteenth century, a major construction boom produced an immense expansion and fragmentation of the construction market, followed by a relative and absolute decline in the number of enterprises in the twentieth century.
From a broader historiographical perspective, these results demonstrate the importance of long-term quantitative analyses of entrepreneurial populations.Footnote 119 Taking the many self-employed sole proprietors into account, who took great risks and responsibilities for their survival and that of their families, allows for a broad perspective on entrepreneurship. Such quantitative studies open up major avenues for further business–historical research, both for the assessment of individual firms’ representativity or singularity and for comparisons across industries, regions, and timeframes.


 Open access