

1. Introduction
Snow avalanches can adopt different flow regimes depending on the precise conditions of the snow cover and the nature of the avalanche track. We consider powder-snow avalanches, which usually occur when the avalanching snow is dry, fine-grained and on a steep slope (Reference McClung and SchaererMcClung and Schaerer, 1993). Powder-snow avalanches reach high velocities which can range from 10 to 100 m s–1, depending on their size. With flow heights from 5 to 100m and mean densities in the range 5–50 kg m–3, the Reynolds number of a powder-snow avalanche varies from 107 to 109, and the flow is fully turbulent (Reference Bozhinskiy and LosevBozhinskiy and Losev, 1998). At such high Reynolds numbers, basal drag is small (Reference Hogg and WoodsHogg and Woods, 2001) and the dynamics are dominated by the interaction between the particle suspension and the ambient air. Snow particles, once airborne, are supported in suspension by turbulence in the interstitial air, giving the suspension a higher mean density than the surrounding air. This density contrast provides the driving force for the avalanche. The density difference is maintained by the continued entrainment of snow particles from the snow cover along the avalanche track, counteracting the dilution of the suspension by the entrainment of ambient air. Entrainment is the incorporation of one material into another, and the term is used for both the incorporation of air at the top surface of the avalanche and the incorporation of snow at the base of the avalanche. There are some arguments that a powder-snow avalanche is driven by a dense basal layer. However, at the high Reynolds numbers found in fully developed powder- snow avalanches (described above), the effects of viscosity are negligible and basal shear cannot provide sufficient force to dominate the flow. The effects of the basal layer are nevertheless important in the entrainment of the ambient snow cover.
There are many aspects of powder-snow avalanche dynamics that are still poorly understood, for example how they form from a dense granular flow of snow. Careful and detailed measurements of avalanches are necessary to understand more about their evolution and dynamics. For this reason, several avalanche test sites have been developed (Reference IsslerIssler, 1999). Vallée de la Sionne is the avalanche test site of the Swiss Federal Institute for Snow and Avalanche Research (SLF) in the Swiss Alps. At this site, large powder-snow avalanches can be artificially released with explosives to flow past a mast carrying a variety of sensors (Reference Dufour, Gruber, Bartelt and AmmannDufour and others, 2001). The three release areas where avalanches can be triggered are marked A–C in Figure 1.
Photograph of the Vallée de la Sionne test site showing the three possible release areas A–C and the 20 m high measurement mast. Photograph: F. Dufour.

Data retrieved from these avalanches have often been used to calibrate computer models predicting dense avalanche run-out distances (Reference Christen, Bartelt and GruberChristen and others, 2002). However, relatively little analysis has been undertaken comparing data from several avalanches to better understand the avalanche flows. Reference McElwaine and TurnbullMcElwaine and Turnbull (2005) used air-pressure measurements from five Vallée de la Sionne avalanches to understand the airflow inside and around powder-snow avalanches, using a similar technique to Reference Nishimura and ItoNishimura and Ito (1997) for real snow flows and Reference McElwaine, Nishimura, McCaffrey, Kneller and PeakallMcElwaine and Nishimura (2001) for ping-pong ball avalanches. In the present work, video data from Vallée de la Sionne avalanches between 2003 and 2005 are analyzed. The objective is to find general scaling laws for the avalanche front velocity and to discover the form of the volume evolution function. In the final section, we discuss the lateral spreading of powder-snow avalanches.
2. Field Experiment Summary
The map in Figure 2 shows the topography of the Vallée de la Sionne test site. The avalanche release zones A–C lie in the bowl marked Crêta Besse in the northwest region of the map. Avalanches flow downslope in the direction of the 1491 m a.s.l. spot height in the southeast corner of the map. From the regular spacing of the contours it is clear that the slope is, to a good approximation, flat with an average slope angle of about 25°. The small gully at about 1900m a.s.l. channels the avalanches towards the measurement mast below it, on which a variety of pressure and velocity sensors are mounted. The analyzed avalanches are considerably wider than the gully and it has little influence on the dynamics. Note that from release area C, the northeastern part of Crêta Besse, there are two slight channels leading onto the open slope. Large avalanches released from this area can separate into two branches. The avalanches that have branched in this way are indicated in Table 1.
Map of the Vallée de la Sionne test site, courtesy of Swisstopo (product information, Swiss Federal Office of Topography, http://www.swisstopo.ch). The gridlines are 1 km squares. The avalanche runs from the release areas A–C at Creta Besse (northwest region of the map) to the river valley in the southeast region of the map. The video recordings are made from Plan des Larzes and La Brune, marked X. M is the location of the measurement mast.

Summary of the 2003–05 Vallée de la Sionne powder-snow avalanches giving the date, fracture volume, release area, entrainment depth and flow height at the measurement mast. The symbols are those used in the plots throughout this paper. Avalanches with two symbols are those which split into two parts, giving two values of front velocity (see text)

In addition to the sensors mounted on the measurement mast, there are two main sources of data from the Vallée de la Sionne test site. The surface area of the released slab and the mean depth of the fracture line are calculated by comparing aerial photographs of the site taken before and after each avalanche. Multiplying the slab area by the mean fracture depth gives an estimate of the fracture volume, Vf, (see Table 1). The mean net depth of snow cover entrained, referred to as the entrainment depth, along the avalanche path is also found from the aerial photographs. This is an average depth of entrained snow cover based on the difference between the estimated volume of deposited snow and the estimated fracture volume. The difference in snow volume is assumed to have been entrained evenly over the powder-snow avalanche width along the track (Reference Sovilla, Burlando and BarteltSovilla and others, 2006), to give the depth of entrained snow cover used in this work (given in Table 1 to the nearest 0.05 m). The actual mean entrained snow depth will be larger since deposition occurs along the track, but we ignore this and assume that the net snow entrainment will give the correct scaling. A full description of the photogrammetry analysis for each avalanche can be found in the SLF winter reports (Reference Dufour, Gruber, Issler, Schaer, Dawes and HillerDufour and others, 1999).
Video recordings of the avalanche, synchronized by an audio signal, are made from at least two different known locations (Plan des Larzes and La Brune, each marked X on the map in Fig. 2). The front position is directly determined as the point of the avalanche furthest down the track and tracked in each video sequence (an example is shown in Fig. 3 for avalanche No. 509) at 5 s time intervals. This front position is differentiated over the time-step to find the avalanche front velocity. Additional features on the avalanche surface (e.g. a particular cleft) are also identified and tracked in each video sequence. With two or more images, the three-dimensional location of each feature can be determined. The accuracy of this spatial measurement varies as the avalanche moves down the slope; at a distance of 1500 m from the cameras the position is accurate to 1 m; at a distance of 2500 m the accuracy is reduced to 5 m (Reference Vallet, Turnbull, Joly and DufourVallet and others, 2004). The located features are linked to form a triangular mesh from which the avalanche upper surface can be reconstructed at each time-step. By projecting the feature positions vertically downwards onto a digital terrain map of the region, the avalanche volume at each time-step is calculated by summing the grid of vertical triangular prisms. The mean height of the avalanche is found by dividing this avalanche volume by the area of the reconstructed avalanche surface. This avalanche height, evaluated at the time when the avalanche front reached the measurement mast, is the avalanche flow height used in the scaling analysis and given in Table 1. A full description of the videogrammetry techniques employed to generate the data analyzed in this work is given in Reference Vallet, Turnbull, Joly and DufourVallet and others (2004).
Avalanche No. 509 powder cloud front at 5 s intervals (Reference Vallet, Turnbull, Joly and DufourVallet and others, 2004). The upper lines, at the tail of the avalanche, are artefacts of the contour processing.

The analyzed avalanches are summarized in Table 1. This table also shows the symbol for each avalanche used in the plots throughout this work. Avalanches allocated two symbols are those which have split into two distinct branches with different fronts, each front with its own symbol. For the video- and photogrammetric analyses to be worthwhile and to ensure that the triggered avalanches reach the measurement mast, it is necessary for there to have been a high level of snowfall in the days preceding the experiment, but for the experiment itself to be carried out in clear, sunny conditions.
Vallée de la Sionne avalanches are usually mixed-snow avalanches, i.e. avalanches with a dense granular flow of snow beneath a powder cloud (Reference Bozhinskiy and LosevBozhinskiy and Losev, 1998). In this paper, the analyzed measurements are of the powder cloud only. The dense granular flow is important to the powder cloud because it is the source of entrained snow, without which the powder cloud will rapidly dilute by air entrainment and come to rest. We assume that, because the Reynolds number is so large, the direct stresses between the two layers can be ignored and therefore the only important momentum exchange is due to the transfer of mass between the layers. Since the surface stresses are low from the powder cloud, this also means that if the cloud has separated from the dense layer, which can occur in complicated topography, it will no longer be able to entrain snow, unless the snowpack is exceptionally light and noncohesive. Thus, the existence of the dense layer is crucial to the entrainment of snow, but provided that the dense layer exists, its only effect is that of a lag in the entrained snow that the powder cloud sees. Since we consider only a constant entrainable snow depth, this can be ignored.
3. Results
3.1. Avalanche front velocity
The front position of avalanche No. 509, measured by the curvilinear coordinate, s, distance down the track, is plotted in Figure 4, where t is the time elapsed since the explosion triggering the avalanche. The gradient of this curve is the avalanche front velocity, and the curvature is the acceleration. Except for the first and last phases of the avalanche, the data are well fitted by a straight line, corresponding to a constant front velocity (~50 m s−1) despite small variations in slope angle. This constant front velocity extends for most of the avalanche track and supports measurements made by Reference Britter and LindenBritter and Linden (1980) of two-dimensional, continuous gravity currents of saline solution flowing on an incline. Measurements from chute flows of snow–air suspension currents (Reference TurnbullTurnbull, 2006) also found the flow front reached a steady velocity, the magnitude of which was independent of slope angle.
Avalanche No. 509 front displacement, s, vs time after explosion, t.

A constant front velocity indicates a balance of the inertia of the entrained snow and air with the driving buoyancy. At the Reynolds numbers (Re ≈ 103) expected for powder- snow avalanches, the basal drag on an avalanche can be assumed to be small compared with the drag due to the airflow around the avalanche and the retarding effect of the inertia of entrained snow and air masses. As the slope angle becomes steeper, the increased component of gravity driving the powder-snow avalanche is counteracted by an increase in air entrainment. This can be seen more clearly if the momentum equation is considered for a powder cloud of volume V and velocity u, giving the cloud a total mass M = B + (1 + χ)ρaV, where B is the buoyancy, ρa the ambient air density and x the added mass coefficient accounting for ambient air disturbed by the passing of the avalanche. From Turnbull and others (in press), the rate of change in momentum is the downslope component of the driving buoyancy
on a slope inclined at an angle θ. Thus the change in velocity is
The righthand side of the equation shows a balance between the driving buoyancy and a retarding term proportional to the rate of change in mass of the avalanche. For a steady velocity these terms must exactly balance.
The parts of the curve in Figure 4 that do not have a roughly constant gradient are where particle entrainment and deposition effects are most important. As an avalanche starts to accelerate, it entrains more particles, thereby increasing the driving buoyancy contrast and accelerating the avalanche further (Reference Bonnecaze, Huppert and ListerBonnecaze and others, 1993). As the avalanche slows down, the turbulent energy is reduced so that particles can no longer be supported in suspension. Particles are deposited, which reduces the driving buoyancy, causing the avalanche to slow down.
3.1.1. Front velocity in plume models
Reference Britter and LindenBritter and Linden (1980) considered continuous, twodimensional gravity currents of saline solution flowing down an incline (Fig. 5). The saline solution was supplied through a nozzle fixed at the top of the slope. They showed that the front velocity was dependent only on the buoyancy flux, ![]() of saline solution supplied to the current, where Q is the volume flow rate of supply of buoyant fluid and
of saline solution supplied to the current, where Q is the volume flow rate of supply of buoyant fluid and ![]() is the density-adjusted gravity. For a fluid of density ρ flowing into an ambient fluid of density ρa, Reference Britter and LindenBritter and Linden (1980) define the density-adjusted gravity as
is the density-adjusted gravity. For a fluid of density ρ flowing into an ambient fluid of density ρa, Reference Britter and LindenBritter and Linden (1980) define the density-adjusted gravity as
Thus, for the Reference Britter and LindenBritter and Linden (1980) experiments, dimensional analysis gives a non-dimensional front velocity
where ~ indicates the dimensionless quantity. The front dynamics of the Reference Britter and LindenBritter and Linden (1980) currents are therefore dominated by the driving buoyancy flux which we now discuss in the context of an avalanche flow.
An inclined gravity current fed with constant buoyancy flux, ![]() moving with front velocity Uf.
moving with front velocity Uf.

In a powder-snow avalanche, the fracture volume of snow provides the initial buoyancy which is subsequently supplemented by the snow entrained along the track. Thus, as in the Reference Britter and LindenBritter and Linden (1980) experiments, buoyancy is continuously supplied to the current. In contrast to the Reference Britter and LindenBritter and Linden (1980) experiments, the entrained snow feeds directly into the avalanche head and this buoyancy source travels with the flow. In the rest frame of the avalanche, the flow can be thought of as a plume source, of strength Q = heuf, subject to an oncoming flow of velocity uf, shown schematically in Figure 6. This configuration is similar to the constant-flux gravity currents travelling into the oncoming flow of Reference Hogg and WoodsHogg and others (2005), in that we consider both buoyancy-induced motion and effects of the oncoming stream. Reference Hogg and WoodsHogg and others (2005) showed that the front velocity depends on both the oncoming flow velocity and the Reference Britter and LindenBritter and Linden (1980) ‘buoyancy velocity’ ![]() . However, in both Reference Britter and LindenBritter and Linden (1980) and Reference Hogg and WoodsHogg and others (2005), buoyancy is fed from a source fixed at the tail of the current and does not move with the current as in the motion of an avalanche. This means that in an avalanche the oncoming flow velocity is determined by the avalanche front velocity, itself determined by the buoyancy velocity, whereas in Reference Hogg and WoodsHogg and others (2005) the oncoming velocity is independent of the current dynamics. Furthermore, the Reference Hogg and WoodsHogg and others (2005) flows are on a horizontal plane where there is relatively little mixing. If the dynamics of the Vallée de la Sionne avalanches are dominated by the buoyancy of the plume source, as in both the Reference Britter and LindenBritter and Linden (1980) and Reference Hogg and WoodsHogg and others (2005) experiments, we would expect the front velocity to scale with the buoyancy velocity,
. However, in both Reference Britter and LindenBritter and Linden (1980) and Reference Hogg and WoodsHogg and others (2005), buoyancy is fed from a source fixed at the tail of the current and does not move with the current as in the motion of an avalanche. This means that in an avalanche the oncoming flow velocity is determined by the avalanche front velocity, itself determined by the buoyancy velocity, whereas in Reference Hogg and WoodsHogg and others (2005) the oncoming velocity is independent of the current dynamics. Furthermore, the Reference Hogg and WoodsHogg and others (2005) flows are on a horizontal plane where there is relatively little mixing. If the dynamics of the Vallée de la Sionne avalanches are dominated by the buoyancy of the plume source, as in both the Reference Britter and LindenBritter and Linden (1980) and Reference Hogg and WoodsHogg and others (2005) experiments, we would expect the front velocity to scale with the buoyancy velocity, ![]() .
.
Schematic diagram of an avalanche of height h entraining particles to a depth he in the rest frame of the avalanche.

The main variables in an avalanche flow are shown in Figure 6 in the rest frame of the avalanche. Note that there are four significant lengths: s, the distance travelled (in the steady case s ≈ tuf);the avalanche height, h; the depth of entrained snow cover, he; and from the initial conditions the cube root of the fracture volume, Vf
1/3. Reference Ellison and TurnerEllison and Turner (1959) and Reference TurnerTurner (1973) show that for an inclined plume, the plume height, h, is proportional to the distance travelled, s, (discussed further in section 3.2) due to the entrainment of air. However, this is not the same height as the height of the avalanche head, the plume height corresponding more to the height of the turbulent wake as we move back from the head. Since in a powder-snow avalanche, by definition, the volume of air is very much greater than the volume of snow, the lengths s and h characterize the total volume of the avalanche. These two variables are determined by the interaction of the powder cloud with the ambient air and are dependent variables, though we do not know what this dependence is. We do not have a prescription for the height, h, so we retain it as an independent length scale. The depth of entrained snow cover, he, and the fracture length scale, ![]() are independent variables determined by the avalanche track, though they may be related by Vf ≈ Afhe
, where Af is the fracture area. The strength of the buoyancy source is characterized by he, as discussed above, and
are independent variables determined by the avalanche track, though they may be related by Vf ≈ Afhe
, where Af is the fracture area. The strength of the buoyancy source is characterized by he, as discussed above, and ![]() characterizes the initial conditions.
characterizes the initial conditions.
Three non-dimensional groups can be formed from the variables in Figure 6. We have

where L is one of the lengths h, he or Vf 1/3. Here we consider only steady flows, so that the first two groups are related, and we will look for a Froude number

where ![]() is the reduced gravity which incorporates the density ratio (Equation (2)).
is the reduced gravity which incorporates the density ratio (Equation (2)).
There are many different definitions of g0 throughout the literature, some of which may scale the data better than others depending on the precise conditions. For example, Grobelbauer and others (1993) find two density relations for high-density ratio intrusions, one for the light front and one for the heavy front. For the heavy front in an infinite ambient, the density relation is (ρ – ρa)/2ρa. This is inappropriate for the density ratios found in avalanches because as ρ/ρa becomes very large the density relation (and thus the density-adjusted gravity) tends to infinity. We will use the Reference Britter and LindenBritter and Linden (1980) definition of density-adjusted gravity, Equation (2), which remains finite at large ratios ρ/ρa. The snow-cover density was measured as approximately 200kgm–3 for all of the Vallée de la Sionne avalanche fronts. Unfortunately there are no density measurements from the powder-snow avalanches themselves and this value must be estimated. For the purposes of this scaling study, we shall assume a powder cloud density of 30kgiгT3 for all of the avalanche fronts (Reference Bozhinskiy and LosevBozhinskiy and Losev, 1998).
3.1.2. Scaling
We will consider three possible Froude number scaling laws for the avalanche flow, based on the three independent length variables h, h
e and ![]() . Firstly, if the avalanche dynamics are determined by the initial conditions, i.e. the volume of snow that releases and forms the avalanche, then we expect the front velocity to scale with a length determined by those initial conditions. In this case, the length in the Froude number given in Equation (3) is
. Firstly, if the avalanche dynamics are determined by the initial conditions, i.e. the volume of snow that releases and forms the avalanche, then we expect the front velocity to scale with a length determined by those initial conditions. In this case, the length in the Froude number given in Equation (3) is ![]() where the fracture volume, Vf, is measured by photogrammetry (see section 2). Secondly, we consider the fully developed avalanche flow, characterized by the avalanche flow height, i.e. Ī = h. This scaling is dominated by the interaction with the ambient air. For convenience, we take the avalanche height at the mast measured from the videogrammetry for each avalanche (see section 2) to be a typical value. Lastly, if the dynamics are determined only by the strength of the buoyancy source, as in the Reference Britter and LindenBritter and Linden (1980) and Reference Hogg and WoodsHogg and others (2005) experiments described above, the front velocity should scale with the characteristic depth of the entrained snow cover and Ī = h
e (determined from photogrammetry;see section 2).
where the fracture volume, Vf, is measured by photogrammetry (see section 2). Secondly, we consider the fully developed avalanche flow, characterized by the avalanche flow height, i.e. Ī = h. This scaling is dominated by the interaction with the ambient air. For convenience, we take the avalanche height at the mast measured from the videogrammetry for each avalanche (see section 2) to be a typical value. Lastly, if the dynamics are determined only by the strength of the buoyancy source, as in the Reference Britter and LindenBritter and Linden (1980) and Reference Hogg and WoodsHogg and others (2005) experiments described above, the front velocity should scale with the characteristic depth of the entrained snow cover and Ī = h
e (determined from photogrammetry;see section 2).
Front-displacement vs time plots for all the 2003–05 avalanches (seven avalanche fronts) are shown in Figure 7a. Figures 7b and 8 show the same data but scaled so that the non-dimensional front displacement, s/L, is plotted against the non-dimensional time, ![]() for each avalanche front. The density-adjusted gravity, g¿, is calculated from Equation (2), using the snow-cover density when using the fracture or erosion properties for scaling, and the powder cloud density when scaling with the avalanche height. The mean gradient of each line is the avalanche non-dimensional front velocity or Froude number, as defined in Equation (3) and given in Table 2 for each avalanche front.
for each avalanche front. The density-adjusted gravity, g¿, is calculated from Equation (2), using the snow-cover density when using the fracture or erosion properties for scaling, and the powder cloud density when scaling with the avalanche height. The mean gradient of each line is the avalanche non-dimensional front velocity or Froude number, as defined in Equation (3) and given in Table 2 for each avalanche front.
Seven Vallée de la Sionne avalanche fronts between 2003 and 2005. (a) Avalanche front displacement, s, vs time, t. (b) Nondimensional front displacement, s/L, vs non-dimensional time, ![]() , where the density-adjusted gravity,
, where the density-adjusted gravity, ![]() is defined in Equation (2) and the length scale,
is defined in Equation (2) and the length scale, ![]() is the cube root of the fracture volume. The best-fit line is calculated from the mean of the gradients of the lines. Each line has been shifted so that its first point lies on the best-fit line.
is the cube root of the fracture volume. The best-fit line is calculated from the mean of the gradients of the lines. Each line has been shifted so that its first point lies on the best-fit line.

Seven Vallée de la Sionne avalanche fronts between 2003 and 2005: non-dimensional avalanche front displacement, s/L, vs non-dimensional time, ![]() where the density-adjusted gravity, g0, is defined in Equation (2). (a) Length scale L = h, the avalanche height at the measurement mast; and (b) length scale L = he, the depth of entrained snow cover. The best-fit line is calculated from the mean of the gradients of the lines. Each line has been shifted so that its first point lies on the best-fit line.
where the density-adjusted gravity, g0, is defined in Equation (2). (a) Length scale L = h, the avalanche height at the measurement mast; and (b) length scale L = he, the depth of entrained snow cover. The best-fit line is calculated from the mean of the gradients of the lines. Each line has been shifted so that its first point lies on the best-fit line.

The non-dimensional front velocities (Froude numbers) of seven Vallée de la Sionne powder-snow avalanche fronts. The front velocities have been scaled with ![]() for three different length scales, L: the cube root of the fracture volume; the avalanche flow height at the measurement mast; and the depth of entrained snow cover (erosion). SD is the standard deviation from the mean
for three different length scales, L: the cube root of the fracture volume; the avalanche flow height at the measurement mast; and the depth of entrained snow cover (erosion). SD is the standard deviation from the mean

Note that t is the time elapsed since the triggering explosion. The curves in Figures 7 and 8 have different origins, because the time delay between the explosion and actual avalanche release varies for each avalanche. Since the avalanche can only be seen in the videos once it has started to develop, from the video recordings it is not possible to determine when release occurs. Variation in initial conditions between the avalanches also results in each avalanche having a different virtual origin. For clarity, the curves have been shifted to place their first point on the best-fit line, calculated from the mean Froude number given in Table 2.
The mean and standard deviation of the avalanche Froude numbers are shown in Table 2 for each length scale, L. Roman numerals indicate different fronts of the same avalanche, where the avalanche has split into distinct branches. Unscaled, the standard deviation of the avalanche velocities is 14% of the mean. Ideally, for this kind of analysis we would need a larger range of initial data so we could see the collapse with the scaling more clearly. The scatter in the Froude numbers (the standard deviation as a percentage of the mean) is significantly reduced only when the avalanche height at the mast is the length scale. In this case, the Froude number is 2.2 ± 0.18, i.e. the standard deviation is 8% of the mean, which is a convincing collapse of the data. The fracture properties appear to have little effect on the front velocities further down the track. This shows that the entrainment of air and snow along the track significantly affects the avalanche dynamics, and the initial conditions are slowly forgotten. When scaled with the height of entrainable snow cover, the scatter actually increases. This increase in scatter will be partly a result of the error in estimating the entrained snow depth (Reference Dufour, Gruber, Issler, Schaer, Dawes and HillerDufour and others, 1999), which can be considerable. There are very few quality data on snow entrainment, and there are varying methods of quantifying the entrained snow depth (Reference Sovilla, Burlando and BarteltSovilla and others, 2006). The data we have used are contaminated by later deposition, and for this reason they may not give a representative value of the buoyancy flux into the avalanche head. In addition, more reliable density measurements of the individual avalanches will be an important development. These will give varying values of the density-adjusted gravity, g0, and may improve the scaling.
3.2. Avalanche volume
3.2.1. Measurement difficulties
The problem with measuring the volume of a powder-snow avalanche is that it is not clearly defined. For comparison with compact models such as the KSB (Kulikovskiy– Sveshnikova–Beghin) model (Reference Kulikovskiy and SveshnikovaKulikovskiy and Sveshnikova, 1977; Reference AnceyAncey, 2006; Turnbull and others, in press) or the model in Reference Fukushima and ParkerFukushima and Parker (1990), it is convenient to consider the total volume to be just that of the head. But this is impossible to repeatedly identify from videos. When comparing with plume-type models, such as Reference Ellison and TurnerEllison and Turner (1959) and Reference TurnerTurner (1973), the entire avalanche volume, including the turbulent wake that extends back to the starting zone, should be considered. The videogrammetry analysis has been carried out by different people in different years who have had different ideas of how to define avalanche volume.
Volume data from the five Vallée de la Sionne avalanches between 2003 and 2005 are shown in Figure 9. These data show that the volumes of the 2004 avalanches (Nos. 628 and 629) are both nearly ten times smaller than the volumes of the 2003 and 2005 avalanches. However, the large fracture volume of avalanche No. 629 in particular (Table 1) would lead one to expect a very large avalanche; and to the observer, avalanche No. 629 did appear large. This discrepancy illustrates a problem with videogrammetric analysis: that avalanche data are not comparable unless they have been systematically generated. For videogrammetric field data to be compared between different avalanches and different field sites, it is paramount that a system be devised for the reliable and repeatable delineation of the avalanche perimeter.
Volume variation with time for Vallée de la Sionne avalanches, 2003-05.

In the 2003 and 2005 avalanches, the perimeter was found from the 1 m avalanche height contour from the reconstructed surface. This is the contour in Figure 3, where the avalanche tail extends to close to the fracture line. In the 2004 analysis, a different approach was used and a subjective, unrepeatable method for finding the rear extent of the avalanche was adopted. This resulted in a much lower reconstructed surface area for the 2004 avalanches than for the other years, and thus the apparently much lower avalanche volumes in Figure 9.
3.2.2. Comparison with plume theory
In the following we will use Ellison and Turner’s theory for an inclined plume to analyze the Vallée de la Sionne volume data. From Reference Ellison and TurnerEllison and Turner (1959) and Reference TurnerTurner (1973), the mass continuity equation for an inclined plume such as that shown in Figure 10 is

where U is the mean velocity in the downslope direction, s, and α is the air-entrainment coefficient. This theory does not include the effect of entrained snow at the avalanche base, but given the large density difference between snow and air it is reasonable to assume that the volume of snow in the avalanche is very small compared with the volume of air, except near the starting zone. Thus, air entrainment will dominate the volume growth. Variables are changed from distance, s, to time, t, using d/dt = Ud/ds. Now we can integrate and, if the mean velocity is independent of t (a reasonable assumption given the steady front velocities observed and analyzed in section 3.1), we find the flow height as a function of time
where t 0 is a virtual origin chosen such that h(t0) = 0. If the flow is assumed to be axisymmetric the volume will be proportional to the flow height cubed, thus the volume will increase with time cubed. For example, if the avalanche is a half-cone of cross-sectional area πh2/2 and length U(t – t 0), as shown in Figure 10, the volume is
The same argument can be applied if a different geometry is assumed which will only change the factor πα2/2.
Sketch of an inclined plume travelling with a steady front velocity U and a downslope coordinate s. The plume has height h at time t and height 0 at time t 0.

We look for an effective air-entrainment coefficient, E, so that, for the geometry in Figure 10,
Vallée de la Sionne volume data from the five avalanches between 2003 and 2005 have been fitted for EU 3 and t0, with the function
shown in Figure 11. The variable t – t0 is the time since the triggering explosion, t, corrected to the virtual origin. Values of the fit parameters EU 3 and t 0 are given in Table 3 together with the residuals. The residual, R, is the root-mean-squared relative error between the fit predictions, p i, and the data values, P i,

for each series of n data points. The entrainment coefficient, E, is given in Table 3, found from the fit parameter EU3 and the mean unscaled front velocity for each avalanche given in Table 2.
Vallée de la Sionne avalanches volume variation with cubic fits (see Table 3).

Values of the fit parameters EU3 and t 0 with their residuals and the non-dimensional entrainment coefficient E. The fit function is given by Equation (7)
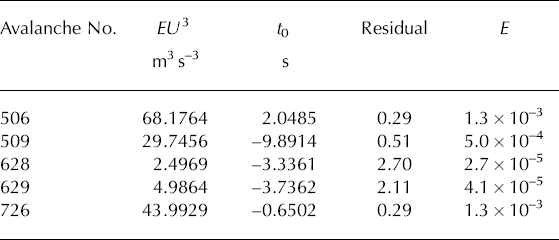
The fit results given in Table 3 show that the three similarly analyzed avalanches (Nos. 506, 509 and 726) have low residuals, that the cubic curve fits well and the volume grows in agreement with Reference Ellison and TurnerEllison and Turner (1959) and Reference TurnerTurner (1973). For these three avalanches the avalanche surface area was chosen to extend from the avalanche front to close to the fracture line of the avalanche for each time- step (see Fig. 3). Most of the avalanche that can be seen is a turbulent wake with only a small and visibly indistinguishable head (the head is distinguishable from the air-pressure data in Reference McElwaine and TurnbullMcElwaine and Turnbull (2005)). Although the head determines the avalanche velocity (Reference Britter and LindenBritter and Linden, 1980), the turbulent wake dominates the volume growth. The cubic growth suggests that this turbulent wake is well modelled by an inclined plume (Reference Ellison and TurnerEllison and Turner, 1959; Reference TurnerTurner, 1973).
For the 2004 avalanches (Nos. 628 and 629) where a much smaller surface area was identified, the volume measurements are not necessarily dominated by the wake. Accordingly, in the case of the 2004 avalanches, the volume measurements are not as well fitted by a cubic function as the turbulent-wake-dominated avalanches. The head of the avalanche is less well modelled by an inclined plume.
3.3. Observations on lateral spreading
A feature of the avalanches, apparent in Figure 3, is that they spread laterally slowly compared with the front velocity. There are several things that can influence the lateral spreading. For example, surface topography affects the way an avalanche spreads: a gully will channel the flow and prevent lateral spread whereas a strongly convex hillside will increase lateral spreading. Reference Dade, Lister and HuppertDade and others (1994) invoked surface drag to explain reduced lateral spreading compared with the predictions, but, as discussed in section 1, for the Reynolds numbers found in powder-snow avalanches surface drag is not significant. A further effect is the pressure field from the external airflow. Reference Webber, Jones and MartinWebber and others (1993) assumed this balance between the hydrostatic and stagnation pressures applied all around the boundary to find constant shape solutions. For a cloud of vertical height h and density ρ on a slope of angle θ, Reference Webber, Jones and MartinWebber and others (1993) balanced the stagnation pressure ![]() with the excess hydrostatic pressure h(ρ – ρa)gcosθ along the current boundary, where un is the velocity normal to the avalanche boundary. Reference von KármánVon Kármán (1940) used this condition at the flow front to show that the Froude number
with the excess hydrostatic pressure h(ρ – ρa)gcosθ along the current boundary, where un is the velocity normal to the avalanche boundary. Reference von KármánVon Kármán (1940) used this condition at the flow front to show that the Froude number
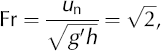
where g' is the reduced gravity

If we apply this condition, as in Reference Webber, Jones and MartinWebber and others (1993), along the boundary of a powder-snow avalanche we find the normal velocities are hugely overestimated. For example, given typical values of slope angle (θ = 30°), powder cloud height (h = 10–50m) and density (ρ = 20–30kgm–3) (Reference Bozhinskiy and LosevBozhinskiy and Losev, 1998), the normal velocity given by the Froude number condition above would be Un ≈ 30–120ms–1. This is far higher than the observations (see Fig. 3).
Assuming that stagnation pressure at the boundary is an overestimate of the pressure, as air accelerates around the sides of the avalanche its pressure drops, so that for the flow shown in Figure 12 the pressure decreases from the stagnation point, X, up the slope towards Y. Thus further up the slope from the head, the stagnation pressure approximation becomes increasingly less valid as the pressure counteracting the spreading decreases. From these arguments, the normal velocity should increase with distance downstream from the head. This Froude number condition gives a lower bound for the normal velocity. The decrease in pressure downstream from the stagnation point therefore suggests that in the vicinity of the head the radius of curvature will increase with time. Figure 3 shows that the radius of curvature in fact varies with time by no more than a factor of two. This is very little compared with the distance the avalanche front has moved down the slope.
A plan view of the flow field inside and around the head of an avalanche in the rest frame of the avalanche. Pressure decreases from the stagnation point, X, to a point downstream, Y.

If, rather than balancing the internal and external pressures to estimate the spreading velocities, we balance the internal inertia, the problem is that of a dam break. In this case, the spreading velocity still scales with ![]() multiplied by some order one factor, the difference being g' and not g. Whichever model we use, the predicted spreading velocities will be much larger than the observations.
multiplied by some order one factor, the difference being g' and not g. Whichever model we use, the predicted spreading velocities will be much larger than the observations.
What, then, can explain the slow lateral growth? The internal motion of the powder cloud can be significant, as demonstrated by the air-pressure measurements of Reference McElwaine and TurnbullMcElwaine and Turnbull (2005) and Russian measurements of the ‘avalanche air blast’ (Reference Grigoryan, Urumbayev and NekrasovGrigoryan and others, 1982). This longitudinal internal motion (see Fig. 12) means that the pressure inside the head is not hydrostatic. For the type of internal flow we expect (Reference McElwaine and TurnbullMcElwaine and Turnbull, 2005), the pressure at the interface will be less than in the hydrostatic case, and lateral spreading will be inhibited. Large internal velocities must be present to explain the shape of the avalanche head.
The powder cloud can be considered as having two distinct regions: the avalanche head and a turbulent wake. Much of the visible avalanche is no longer influenced by the motion of the avalanche head, and is a turbulent wake. Figure 3 shows that the avalanche width in the turbulent wake, far back from the head, also changes little over the course of the avalanche. The vertical growth rate of the turbulent wake is significantly higher than the lateral growth rate.
The Richardson number, Ri, is defined as the ratio of potential to kinetic energy of an entraining interface. For low Richardson numbers, the increase in potential energy counteracting entrainment is small compared with the kinetic energy associated with the interface. Since, in the absence of any cross-slope curvature, any mixing in the cross-slope (lateral) direction is not counteracted by gravity, the Richardson number in this direction is zero. Thus, if the turbulence in the avalanche was homogeneous, it would be expected that the cloud entrains ambient fluid at the highest rate where the Richardson number is zero, i.e. in the lateral direction. With homogeneous turbulence, mixing in the lateral direction would be stronger than in the direction perpendicular to the slope, where the Richardson number is non-zero. In the previous paragraph it was observed that the growth rate perpendicular to the slope is higher than the lateral growth rate. This observation suggests that the turbulence is very anisotropic. Large-scale eddies are formed aligned with the axis of the avalanche due to the downslope velocity and the counteracting drag over the surface of the avalanche. Since these eddies are aligned with the axis of the avalanche, they will entrain ambient air perpendicular to the slope. This entrainment will be much stronger than the lateral entrainment which will occur as the large-scale turbulence decays to smaller scales and becomes isotropic.
4. Conclusions
We have analyzed front position and volume data from the Vallée de la Sionne avalanches between 2003 and 2005 and compared these data with theories for inclined plumes. The front velocity reaches a constant value over most of the track. When non-dimensionalized with ![]() where h is the avalanche height at the measurement mast, then this constant front velocity varies little for the analyzed avalanche fronts. The non-dimensional front velocity, or Froude number, is found to be
where h is the avalanche height at the measurement mast, then this constant front velocity varies little for the analyzed avalanche fronts. The non-dimensional front velocity, or Froude number, is found to be

for the seven avalanche fronts analyzed. Though more physically reasonable, the fracture and snow-cover variables do not scale the avalanche data convincingly.
The total avalanche volume has been found to increase cubically with time. For the analyses where the volume of only the front part of the avalanche was measured, no such cubic growth was found. The cubic growth of the total avalanche volume is dominated by the turbulent wake. The shape of the head and the lack of lateral spreading indicate significant internal motion. In the turbulent wake, there is little lateral spreading compared with the height growth of the powder cloud. This effect is explained by anisotropy of the turbulence generated by large-scale vortical motion in the head.
We have shown that plume theories can accurately describe the volume increase in the avalanche, and have no difficulty with the avalanche tail extending back to the starting zone. This success contrasts with the success of compact models, such as the KSB model, which better capture the front dynamics of the flow. A combination of the two approaches would therefore be useful. There are two ways of approaching this. One is to start from a compact model but assume decaying profiles for density and velocity as we move back from the head in the avalanche. These must be chosen to decay fast enough that they can be integrated over all space. These will then result in the KSB equations but with different closures. This may work well for constant entrainable snow depth and constant slope angles but is non-physical if these vary, since the dynamics of the avalanche are related along its length. Thus, this model may be useful with laboratory experiments but will be less useful for natural avalanches. The alternative approach is to model the avalanche as a plume with time-varying buoyancy in the head, according to the entrainable snow depth and front speed. The head is then a singularity in the plume theory which will need closure to specify a virtual origin correction and the front velocity. With this approach it should be relatively easy to account for lateral spreading by incorporating cross-slope air entrainment and buoyancy-driven lateral forces.
With improvements in data quality and the availability of more data (including density measurements) it will be possible to draw stronger conclusions about the scaling properties of avalanches. Repeatable laboratory experiments, where an experiment can be carried out in the same manner many times, will also be important sources of data for investigating the validity of plume theories for modelling flows such as powder-snow avalanches.


