


Introduction
Potato (Solanum tuberosum L.) is a crop that remains key for addressing global food security and fighting malnutrition due to its high yield as determined by energy per unit of land as well as a provider of digestible proteins, vitamins and micro-elements. Andrivon (Reference Andrivon2017) indicated that its tubers are also less affected by food price variation than that of cereal grains, thereby making this crop interesting to both subsistence farming and income generation. As noted by Firlej and Kubala (Reference Firleja and Kubala2019), the volume of production, gross domestic product value and tuber imports affect the price of potato in the European Union.
There were very few introductions of potatoes from South America to Europe in the 16th century and a few cultivars were grown in the early 18th century (Glendinning, Reference Glendinning1983). They adapted to a short growing season with tuberization under long daylengths. Most potatoes grown in Europe from 1650 to 1750 were closely related to Andean landraces of S. tuberosum Gp. Andigenum (Gutaker et al., Reference Gutaker, Weiß, Ellis, Anglin, Knapp, Luis Fernández-Alonso, Prat and Burbano2019). These potatoes were non-adapted to long daylengths through allelic variants of CYCLING DOF FACTOR1 gene, which are found in the cultivars grown in Europe during the 19th century and related to S. tuberosum Gp. Chilotanum. Widespread selection among seedlings and increasing number of grown cultivars – selected mostly by farmers and hobby breeders – occurred in the late 18th and early 19th centuries because of planting tubers being affected by viruses. The seedlings used for developing these primitive European potato cultivars derived from naturally-set berries, thus including offspring resulting from self-pollination that reduced the genetic variation in the cultigen pool (Glendinning, Reference Glendinning1983). As a result, most of these 19th century potato cultivars were eliminated in Europe, and variation was further reduced after the mid-19th century late blight epidemic, which was caused by the fungus-like oomycete pathogen Phytophthora infestans (Mont.) De Bary. As noted by Glendinning (Reference Glendinning1983), deliberated potato crossbreeding began in early 19th century (before 1810) by T.R. Knight. This approach became widespread in the second half of the 19th century, particularly crossing cultivars that survived late blight and new introductions from South America. More than 500 cultivars in the UK and about 50 in the USA released in the early 20th century ensued from such a crossing block, which kept variation in these cultigen breeding pools rather limited.
The most used potatoes for farming worldwide are vegetatively propagated, mostly outcrossing, highly heterozygous, self-compatible tetrasomic polyploids (2n = 4x = 48 chromosomes) that suffer inbreeding depression after selfing, all of which bring difficulty to breed high yielding F1 hybrid cultivars (Ortiz, Reference Ortiz2015). The segregation in the hybrid offspring after crossing two cultivars or breeding clones makes more challenging further genetic improvement for host plant resistance or tuber quality. The most widely approach used today for developing bred-cultivars worldwide aligns well with a phenotypic recurrent selection scheme that takes a long generation cycle; i.e. more than a decade (Jansky and Spooner, Reference Jansky and Spooner2018). This breeding approach is used because crossing two elite parents (cultivars or advanced breeding clones) with complementary desired characteristics and further phenotypic selection in the segregating offspring fails to increase favourable alleles for target traits therein due to the low frequency of combining them in clones derived from a single cross. Nearly all bred potato cultivars from the 20th century onwards derived from crossing, cloning and selection, thus introducing new phenotypes triggered by new genes (Brown, Reference Brown2011). Nonetheless and in spite of efforts for broadening the genetic base, today's grown potatoes elsewhere ensued from a restricted cultigen pool because of the many traits being sought within a narrow performance boundary to release a newly bred cultivar.
Potato lacks a breeding breakthrough as that noted for semi-dwarf rice and wheat cultivars of the Green Revolution or F1 hybrids of maize and other seed crops, including various vegetables (Stokstad, Reference Stokstad2019). Indeed, potato breeders are yet to achieve genetic gains such as those noted with main cereal staples. Furthermore, Douches et al. (Reference Douches, Maas, Jastrzebski and Chase1996) indicated that although potato productivity (per unit area) increased 6-fold throughout the 20th century in the USA, the cultivars with the greatest yield potential were released in the first half of that century or before. Likewise, the genetic gain was significant but small for specific gravity and processing quality. In this regard, significant progress was made on developing US potato cultivars with good chip quality as measured by tuber solids, chip colour, reducing sugar levels, sucrose levels and per cent of defect-free chips (Love et al., Reference Love, Pavek, Thompson-Johns and Bohl1998).
Estimating the rates of genetic gains over time allows the periodic assessment of progress made by plant breeding. For example, the relative annual genetic gains for total and marketable tuber weight as well as starch content – as measured in cultivars released between 1980s and 2010s – were 1.15, 1.42 and 0.16, respectively, in Ethiopia (Gebrehanna et al., Reference Gebrehanna, Ali and Desta2020). Similarly, genetic gains were determined for tuber yield under heat stress by comparing breeding clones from three cycles of recurrent selection in Brazil (Benites and Pinto, Reference Benites and Pinto2011). The genetic gains across cycles were 37.8% for tuber weight, 13% for mean weight of large tubers, 32.4% for the percentage of large tubers and 0.8% for specific gravity.
The knowledge about genetic gains assists on measuring the results of previous breeding for target trait(s) and fine-tune the strategy for their betterment. Hence, the aim of our research was to use a direct comparison of potato cultivars released and grown across Europe in the last 200 years to understand how breeding contributed to improving productivity, resilience and quality traits in a target population of environments in the Nordic region affected by late blight and long daylengths, thus allowing for the first time in this continent to determine genetic gains in potato breeding. The observed genetic gain for tuber yield was further related to changes in national potato yield averages in Sweden to define the breeding share related to productivity improvement.
Materials and methods
Multisite trials were undertaken in 2020 for various tuber characteristics and host plant resistance to late blight included 170 cultivars released for farming throughout western Europe during the last 200 years (Supplementary Table S1) in both Mosslunda (ca. 56°01′46″N, 14°09′24″E, 1 m.a.s.l.) and Umeå (63°49′30″N, 20°15′50″E, 12 m.a.s.l.) and a subset of 114 of them in Helgegården (56°01′ N, 14°04′ E). One cultivar in Umeå did not grow well and was eliminated from the trial. The trials included seven post 2nd World War released cultivars bred for the starch processing industry; namely, ‘Allstar’ (2015), ‘Avenue’ (2010), ‘Kuras’ (1996), ‘Nofy’ (2017), ‘Quadriga’ (2005), ‘Saprodi’ (2014) and ‘Tarzan’ (1989). In each site incomplete block designs with two replications of 10-plant plots were used. There was a 0.3. m spacing among plants within the row and 0.7–0.75 m spacing between the rows. Fungicides throughout the cropping season were used in Helgegården against P. infestans, thus allowing to evaluate tuber yield potential in this site, while other crop husbandry practices were similar across sites. Total tuber yield and by size grading (<40 mm, 40–50 mm, 50–60 mm, >60 mm; kg) as well as tuber flesh starch (determined in percentage after measuring specific gravity) were assessed across the three testing sites. Reducing sugars in the tuber flesh defined with the aid of a potato glucose strip test (Mann et al., Reference Mann, Lammerink and Coles1991) in Umeå, and host plant resistance to P. infestans measured by area under disease progress curve (Fry, Reference Fry1978) only in Mosslunda were the other two characteristics evaluated.
Best-linear unbiased predictors (BLUPs) using mixed models were calculated for all characteristics in each testing site using the META-R software (Alvarado et al., Reference Alvarado, Rodríguez, Pacheco, Burgueño, Crossa, Vargas, Pérez-Rodríguez and Lopez-Cruz2020). Annual rates of genetic gains were estimated by a simple regression considering the year of release as independent variable and the cultivar's BLUP for each characteristic as dependent variable. These genetic gain estimates measured by the regression coefficient were made for all cultivars as well as for those released in France, Germany, The Netherlands and United Kingdom due to their sample size (at least a dozen of cultivars per country in each testing site). A t test determined if the regression coefficient was significantly different than zero. The relative genetic gains over the years (%) for each characteristic were estimated by dividing the absolute rates of genetic improvement (measured by the slope) by the mean and multiplying the resulting quotient by 100.
The relative potato productivity (as measured by tuber yield) across the European Union (EU28), for northern Europe (Nordic Region and Baltic States) and in Sweden over time was estimated using available country data for the 1961–2019 period (FAOSTAT, 2021). The harvest year was the independent variable, and the dependent variable was the yield data (hg/ha) in both regression analyses.
Results
The combined analysis of variance (ANOVA) across sites revealed significant variation (P < 0.001) for all characteristics across sites, as well as a significant genotype × environment interaction. On average tuber yields of the post 2nd World War cultivars were larger than those of cultivars grown before the 1940s, while the opposite was true for percentage of tuber flesh starch-except for those bred for use by the industry (Table 1). The starch-bred cultivars had the largest mean tuber yields in each and across testing sites and showing most of their weight in tubers of large (50–60 mm) to very large size (>60 mm).
Average best linear unbiased predictors for tuber weight (total and according to size), starch percentage, reducing sugars and late blight resistance in European potato cultivars released since the 1800s at three Nordic testing sites
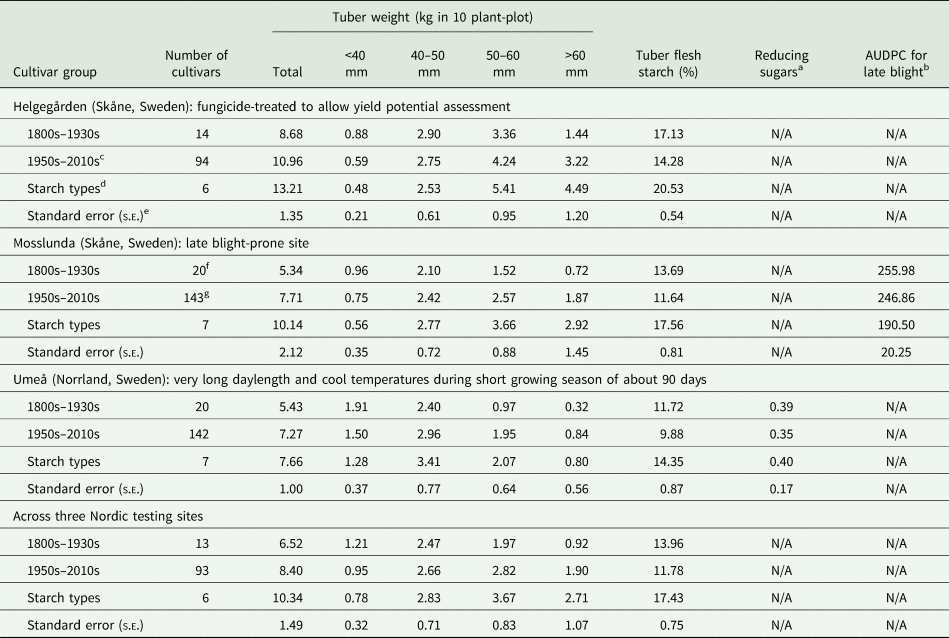
a Based on strip test.
b Area under disease progress curve.
c Excluding starch cultivars for industry.
d All released since mid–1990s.
e The standard error of the mean difference among cultivar groups (S.E.D) = s.e. × √(1/ri + 1/rj), where ri and rj are the number of cultivars in ith and jth groups, respectively.
f 15 cultivars for flesh’ starch.
g 136 cultivars for flesh’ starch.
The average performances in each testing site were used to regress the breeding progress of released potato cultivars in Europe during the last 200 years for tuber weight (total and according to size), flesh starch percentage, reducing sugars in the flesh and host plant resistance to late blight (Table 2).
Annual genetic gains (%) based on best linear unbiased predictors in western European potato breeding [1800s–2019] as measured in high yield potential site at (a) Helgegården, Skåne, southern Sweden, (b) Mosslunda, Skåne, southern Sweden and (c) Umeå, northern Sweden during 2020 (using an incomplete block design with two replications of 10-plant plots under fungicide treatment)
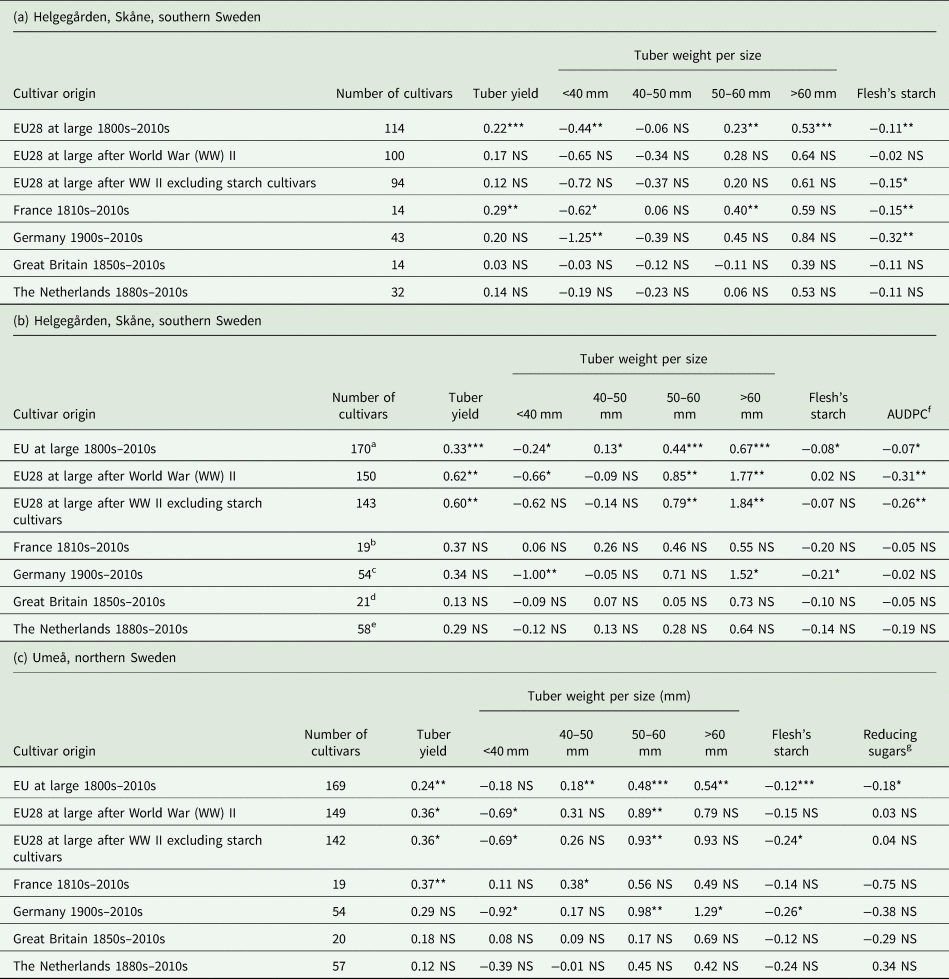
a 160 cultivars for flesh’ starch.
b 16 cultivars for flesh’ starch.
c 51 for flesh's starch.
d 20 for flesh's starch.
e 56 for flesh's starch.
f Area under disease progress curve.
g Based on strip test.
***, **, * and NS indicate a significant slope (trait on year of release) at P ⩽ 0.001, P ⩽ 0.01 or P ⩽ 0.05 and non-significant at P > 0.05, respectively.
There were significant (P < 0.01) trends for all characteristics evaluated in 114 cultivars at the high yield potential site at Helgegården except for weight of 40–50 mm tubers (Table 2a). The significant annual genetic gains ranged from −0.44% (P < 0.01) for weight of tubers below 40 mm to 0.53% for weight of tubers above 60 mm (P < 0.01). The annual genetic gains were, however, non-significant when considering only the post 2nd World War released cultivars. The negative significant trends for both weight of tubers <40 mm and for starch percentage in the tuber flesh suggest that new cultivars were bred for larger tuber size but with smaller starch content. This feature was observed greatly in cultivars released in France and to lesser extent for those released in Germany at this testing site.
In the late blight prone site at Mosslunda, the trends were significant (P < 0.05) for all characteristics evaluated in 170 cultivars released in western Europe, but not for weight of 40–50 mm tubers and flesh starch percentages in post 2nd World War released cultivars (Table 2b). The range of significant annual genetic gains ranged from −0.07% (for host plant resistance to late blight as measured by the AUDPC) to 0.67% (weight for very big tubers >60 mm). In this stressful testing site, the trends were only significant (P < 0.05) for the cultivars released in Germany for tuber weight of small (<40 mm) and very big tubers (>60 mm); i.e. −1 and 1.52%, respectively, as well as for starch percentage in the tuber flesh (−0.21%). These results confirm that most recent released potato cultivars reduced their starch in the tuber flesh and increased greatly their tuber size. They also had a very small but significantly (P < 0.05) steady increase of their host plant resistance to late blight since the 1800s, and with a larger genetic gain noted on cultivars released after the 2nd World War.
Same trends as those from the two testing sites in southern Sweden were noted for 169 cultivars evaluated under the very long daylength of Umeå in northern Sweden (Table 2c). There were significant (P < 0.05) annual genetic gains for all characteristics except for weight of tubers below 40 mm. The largest and significant annual genetic gain was observed for weight of tubers above 60 mm (0.54%, P < 0.01), while the lowest were for tuber quality traits such as starch percentage (−0.12%, P < 0.05) and reducing sugars (−0.18%, P < 0.05) in the flesh. Significant genetic gains were, however, only observed for total tuber yield and weight of tubers below 40 mm or having 50–60 mm. Hence, these results indicate progress being made for improving tuber yield of potato cultivars for northern latitudes based on specific tuber sizes. The starch percentage and reducing sugars in the tuber flesh were slightly reduced in most recent released cultivars with big tubers, particularly by those bred in Germany.
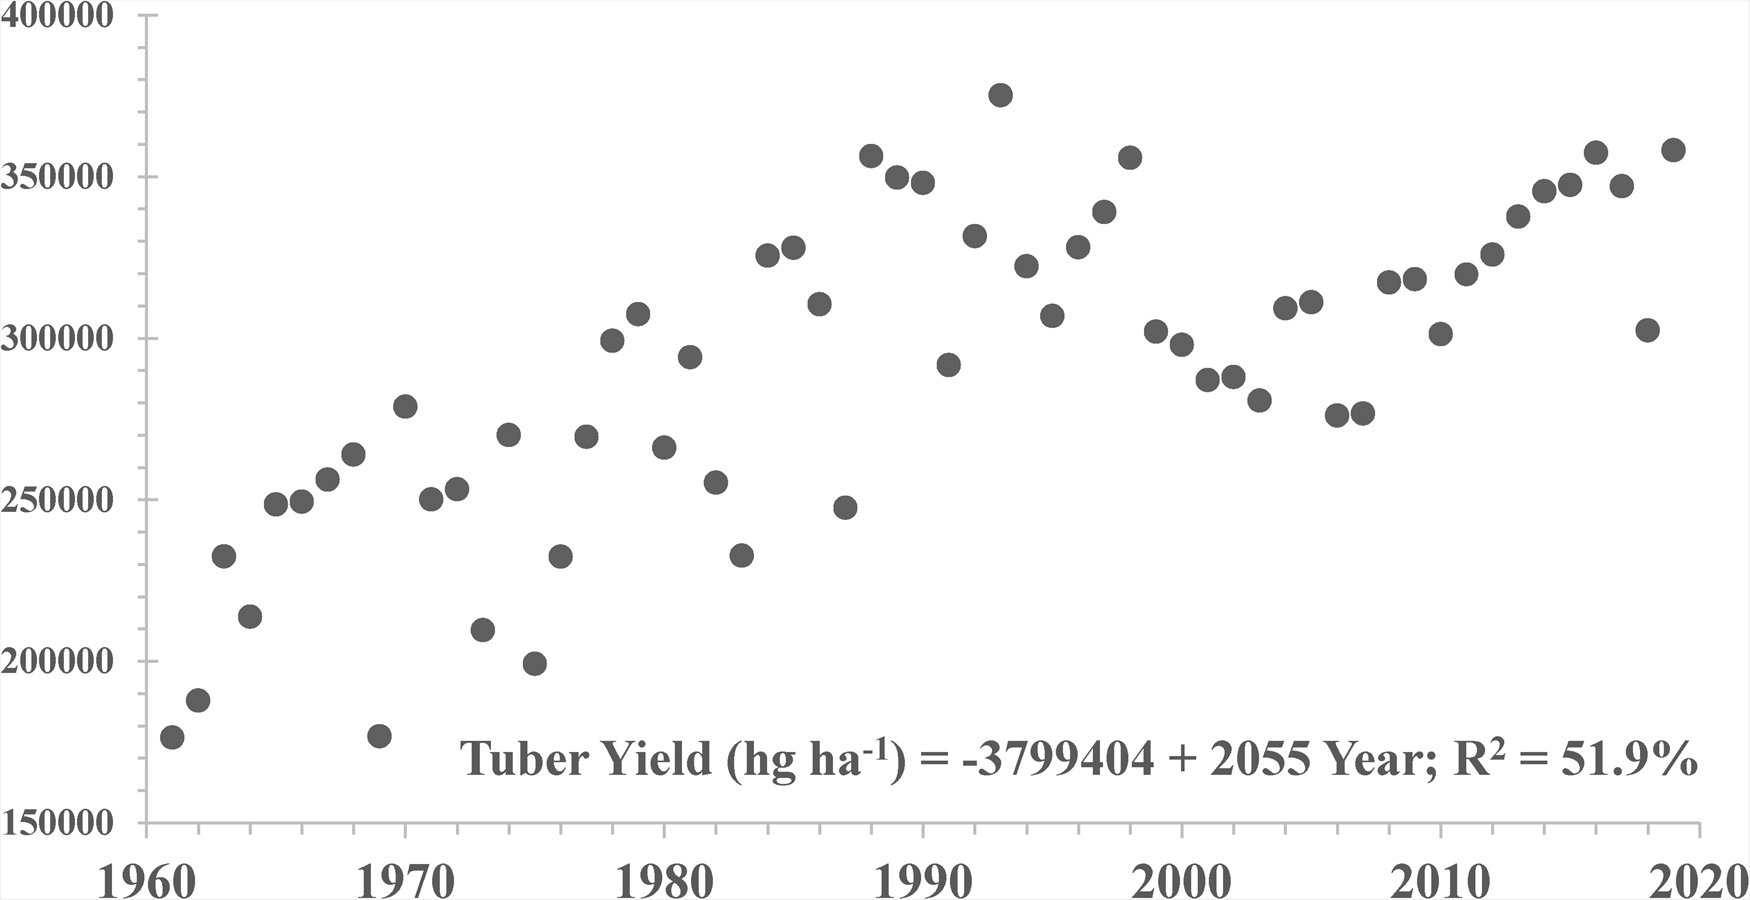
Figure 1 shows the national average tuber yield (hg/ha) at harvest from 1961 to 2019 in Sweden. There was a highly significant (P < 0.01) and positive trend during this 59-year period. The annual average rate of productivity increase in Sweden was 0.71%, which was smaller than those estimated for northern Europe (0.85%) in particular, and the EU28 at large (1.22%). The average annual genetic gains across testing sites in Sweden after the Second World War II (1950s onwards) was about 0.36% after excluding potato cultivars bred for the starch industry; i.e. ca. 50% of the total productivity gains in this country for table potato, which accounts for ¾ of the total area grown in this country (Eriksson et al., Reference Eriksson, Carlson-Nilsson, Ortíz and Andreasson2016). Hence, most recent potato released cultivars grown in this country (and mostly bred elsewhere in the EU28) may account for at least ½ of the increase in national yield observed in the last six decades, while crop husbandry (including the use of inputs such as fertilizers and pesticides) could explain the remaining of productivity increases of potato in Sweden.
Discussion
To the best of our knowledge this multi-site trial research provides the first quantitative assessment of realized genetic gains for 200 years of potato breeding in Europe. Total tuber yield had a relatively low annual genetic gain across sites (about 0.26%/year), which is significantly below the 1.5% setup by the CGIAR as a high-level key performance indicator for rates of improvement by breeding programs worldwide (Hunt, Reference Hunt2021). Furthermore, Cobb et al. (Reference Cobb, Juma, Biswas, Arbelaez, Rutkoski, Atlin, Hagen, Quinn and Ng2019) advocate increasing rates of genetic gains in staple crops from below 1% to at least 2% to be able to cope with climate change and meet the end-user demands. Annual genetic gains around 1% or above were only noted for weight of tubers below 40 mm (on average 1.06% across testing sites) or above 60 mm (1.22% across testing sites) in cultivars bred and released in Germany (Table 2). It seems that these cultivars were selected due to their big tubers, which appears to be significantly related to total tuber weight. In this regard, Ortiz et al. (Reference Ortiz, Reslow, Crossa and Cuevas2021) found significant (P ⩽ 0.05) genetic and phenotypic correlations among the tuber weight characteristics irrespective of their sizes in the same target population of environments as this multi-site trial research, thus confirming that most recent cultivars released in Europe had medium to big size tubers and a very few small tubers.
Quality tuber flesh traits such as starch percentage (Table 2) and reducing sugars (Table 2b), which do not appear to be correlated to tuber weight (Ortiz et al., Reference Ortiz, Reslow, Crossa and Cuevas2021), showed relatively low annual genetic gains (<0.2%) for the last 200 years of potato breeding in Europe. Their rates of improvement were smaller to those noted for tuber starch content by Gebrehanna et al. (Reference Gebrehanna, Ali and Desta2020) in Ethiopia between 1987 and 2013, and lower for reducing sugars in the tuber flesh than those indicated by Love et al. (Reference Love, Pavek, Thompson-Johns and Bohl1998) for US cultivars released from 1876 to 1997.
The selection responses (ΔG) are measured by the breeders' equation, which is defined as:
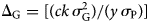
where c, k and y are the parental control, a function of the selection intensity and number of years to complete one selection cycle, respectively, while σ 2G and are σ P the genetic variance and the square root of the phenotypic variance, respectively. This equation can be used throughout the breeding process; i.e. from design through engineering to delivery. It allows defining the selection scheme according to the heritability of the trait(s) included in the product profile for a cultivar, estimating the potential genetic gains of any characteristics in the target population of environments, and measuring the genetic gains until farmers grow the released cultivar(s).
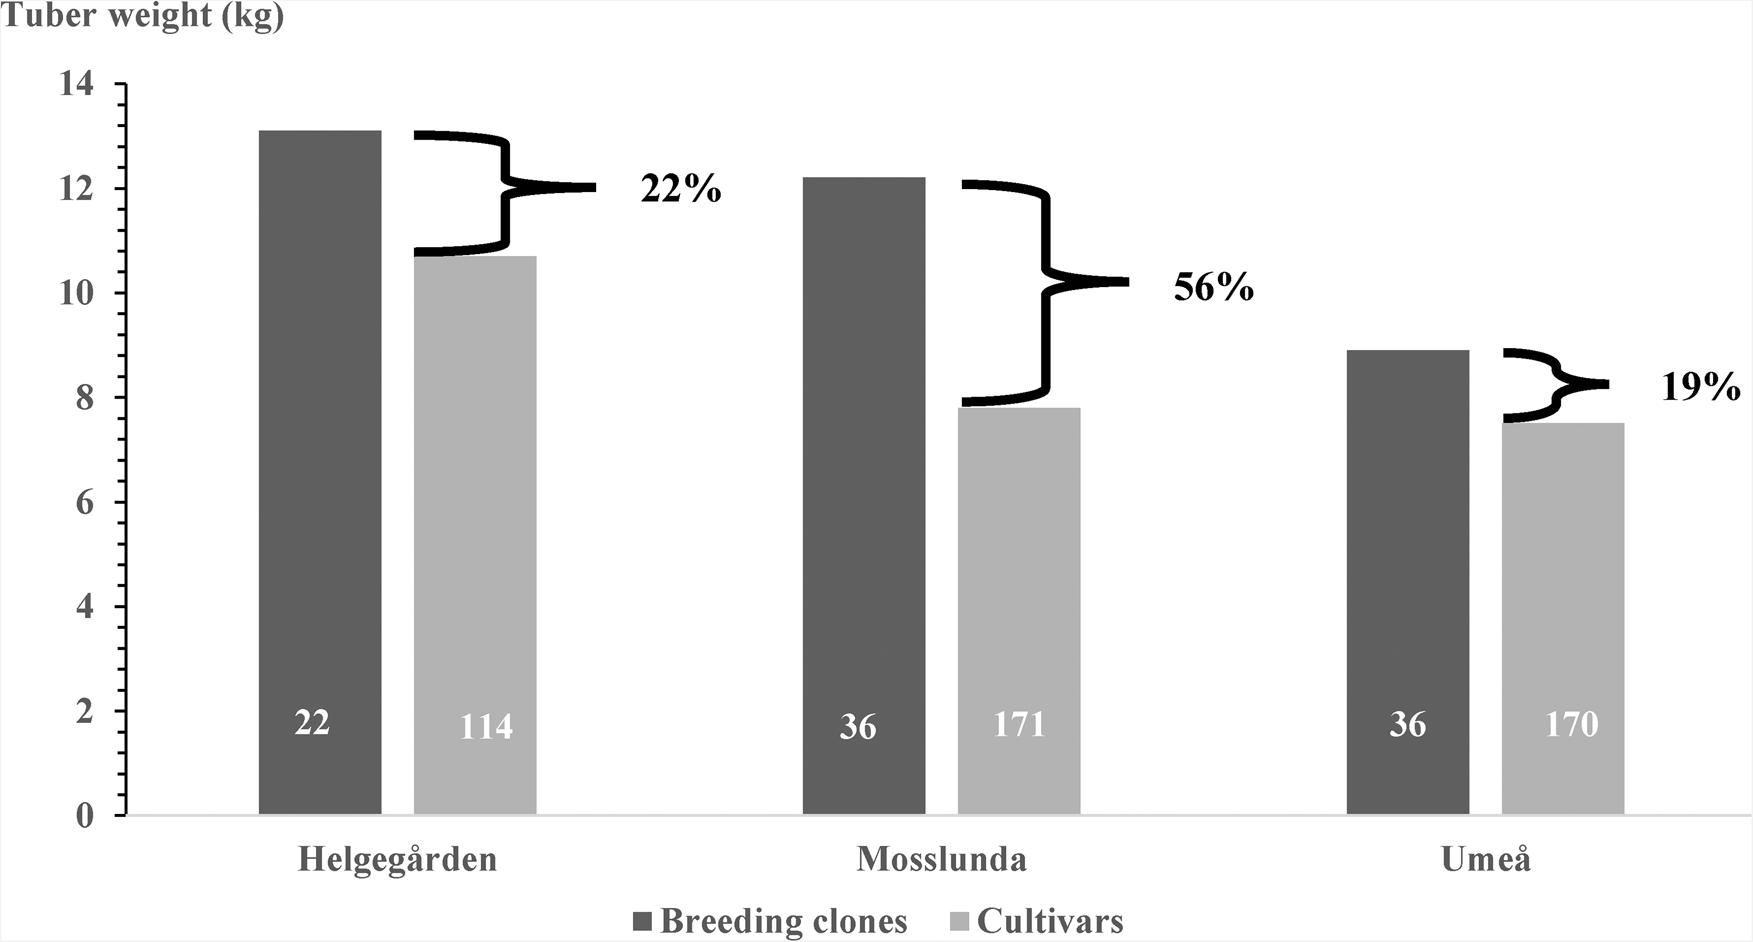
Heritable variation appears to be significant for tuber yield, host plant resistance to late blight, and both starch content and reducing sugars in the tuber flesh in the western European potato cultigen pool (Ortiz et al., Reference Ortiz, Reslow, Crossa and Cuevas2021). The management of genetic variation coupled with strict selection and appropriate field testing led to identifying several promising advanced breeding clones (T4 onwards) whose tuber yields, on average, were significantly above the mean tuber yield of the released cultivars in each testing site of the target population of environments (Fig. 2). On average, the largest tuber yield difference (>50%) was noted in the late blight-stress prone site because the breeding clones show significantly higher host plant resistance to the oomycete P. infestans causing this disease that affects both the leaf canopy and tubers of the potato. Tuber yield loss due to late blight has been estimated by comparing trial results from fungicide-treated and untreated plots (Dowley et al., Reference Dowley, Grant and Griffin2008). In may be at least 30% in main potato-producing areas in southern Sweden (Reslow et al., Reference Reslow, Carlson-Nilsson, Crossa, Cuevas and Ortiz2022). Furthermore, there are significant genetic and phenotypic correlations between host plant resistance to late blight and total tuber yield (Ortiz et al., Reference Ortiz, Reslow, Crossa and Cuevas2021). These correlations and yield loss due to late blight may account for the large differences observed for total tuber weight at Mosslunda (Fig. 2), where the host plant resistance of the breeding clones as measured by the AUDPC was, on average, significantly higher than that noticed in the released cultivars of western Europe; i.e. 150 ± 7 v. 246 ± 3, respectively (Reslow et al., Reference Reslow, Carlson-Nilsson, Crossa, Cuevas and Ortiz2022). Only 1 released cultivar was rated as highly resistant to late blight (AUDPC <100) and other 27 as partial resistant (AUDPC = 100–199), while there were 3 breeding clones showing an AUDPC below 100 and other 33 with AUDPC ranging between 100 and 199. Although there was a significant but small relative annual genetic gain (0.07%) for host plant resistance to late blight as measured by the AUDPC (Table 2b), these results suggest that priority should be given to increase the rate of improvement for this characteristic in the cultigen potato breeding pool in western Europe.
Total tuber weight (10-plant plot) of breeding clones versus released potato cultivars at three testing sites in Sweden. Numbers within each bar are the total number of breeding clones or released cultivars, while percentages after the braces indicate the average differences between them in each testing site.
Source: Reslow et al. (Reference Reslow, Carlson-Nilsson, Crossa, Cuevas and Ortiz2022).
Ware potatoes are eaten after baking, boiling, frying, mashing or roasting, as well as in stews, salads or as fingerlings, crisps and chips. The various end-users (growers, fast food restaurants, table and crisp markets or the starch industry) define the characteristics to be included in the product profiles for developing potato cultivars and breeding populations, as well as the genetic enhancement approach for delivering genetic gains. Likewise, Bonierbale et al. (Reference Bonierbale, Amoros, Salas, de Jong, Campos and Ortiz2020) argued that product profiles must indicate the quantitative level (absolute or relative) to be achieved for productivity, protection and quality traits and using as baseline a released cultivar. The development of these product profiles should include not only professionals (e.g. agronomists, pathologists or nutritionists) but also end users who assist on setting the trait levels, which are the aims for breeding potato cultivars. For example, low and very low reducing sugars in the tuber flesh are necessary for chips and crisps, respectively. Such markets also ask for potatoes with the right texture for cooking types but differ in tuber shape and size. Long and large potatoes with superficial ‘eyes’ and average dry matter concentration are sought by the chip fast food restaurants, while potato crisps are best from small round potatoes with high dry matter. Similarly, the starch industry seeks large, round potatoes with high dry matter, and the table potato consumers prefer average size tubers with low to average dry matter, superficial ‘eyes’ and smooth skin. Such distinct tuber quality characteristics in the product profiles that meet stringent end-user demands may slow the delivery of genetic gains for tuber yield through potato breeding, which also must consider improving host plant resistance to old and emerging pathogens and the target population of environments where the cultivar(s) will be released (Mori et al., Reference Mori, Asano, Tamiya, Nakao and Mori2015). As indicated by Walker (Reference Walker1994), market quality preferences are known to slow cultivar changes (and the genetic gains therein) in potato, which are also influenced by yield potential and market value.
The challenging tasks for breeding various characteristics (and most of which display quantitative variation) may be facilitated by multi-trait BLUPs – based on pedigree information if available – when using a selection index. BLUPs may also increase genetic gains for low heritability characteristics (Slater et al., Reference Slater, Wilson, Cogan, Forster and Hayes2014). Another approach for accelerating and improving the rates of genetic enhancement in potato will be the use of genomic prediction modelling of breeding values if selection accuracy can be achieved (Slater et al., Reference Slater, Cogan, Forster, Hayes and Daetwyler2016; Bradshaw, Reference Bradshaw2017). In this regard, Selga et al. (Reference Selga, Reslow, Pérez-Rodríguez and Ortiz2022) indicated that for tuber yield, specific gravity and host plant resistance to late blight using advanced breeding clones as training population cannot be used for selecting among early generation breeding clones (T1) or across F1 full-sib family offspring based on the genomic prediction of breeding values (GEBV). They proposed the use of GEBV for within full-sib family selection. Likewise, Ortiz et al. (Reference Ortiz, Crossa, Reslow, Pérez-Rodríguez and Cuevas2022) noted that multi-environment, polysomic-based GEBV (or GBLUP) facilitated the selection of breeding clones and released cultivars for further use in crossing blocks for the desired characteristic(s) in the target population of environments.
Conclusion
The relative realized annual genetic gains for potato breeding in western Europe are mostly small. They may be increase and accelerated by broadening the diversity of the cultigen breeding pool, avoiding crossings among related elite germplasm, and using BLUPs or GBLUPs for selecting promising germplasm for advancing them in the cultivar pipeline or for their further crossing in population improvement according to defined multi-trait product profiles.
Supplementary material
The supplementary material for this article can be found at https://doi.org/10.1017/S002185962200034.
Author contributions
R. O. conceived and designed the study. F. R. conducted data gathering. J. Cr., J. Cu. and R. O. performed statistical analyses. R. O., J. Cu., J. Cr. and F. R. wrote the article. All authors have read and agreed to the final version of the manuscript.
Financial support
This research was possible through funding provided for Sveriges potatisförädling by the the Swedish University of Agricultural Sciences (SLU) and from the Swedish Research Council Formas for both Sveriges potatisförädling (since 2011) and project Genomisk prediktion i kombination med högkapacitetsfenotypning för att öka potatisens knölskörd i ett föränderligt klimat (2020–2022).
Conflict of interest
The authors declare no conflicts of interest exist.
Ethical standards
Not applicable.


 Open access