
Electoral institutions shape democracies by governing how vote counts are translated into political power. Changes in electoral systems may, therefore, give rise to strategic responses of voters and politicians in anticipation of the electoral systems’ mechanical constraints.Footnote 1 For example, a shift toward more proportional representation could cause voters to shift their support to smaller political parties. Likewise, small political parties may be more likely to participate in elections when the threshold for representation is low. Duverger famously labeled these behavioral responses ‘psychological effects’, as opposed to the ‘mechanical effect’, which is the simple translation of votes into seats.Footnote 2
Since the 1980s many established democracies, for example, France, Italy, New Zealand and Japan, have experienced major electoral reforms.Footnote 3 In other countries, such as the United Kingdom, changes of the electoral system have been high on the agenda, although the status quo has prevailed. To evaluate the consequences of electoral reforms, proposed or implemented, we must understand both the mechanical and psychological effects. However, this has proved a challenge. In an early review of the literature, Taagepera and Shugart conclude that ‘the Duverger psychological effect is the one major relation within the electoral system that remains unquantified’.Footnote 4 There are two main reasons why the psychological effect has proved ‘elusive’.Footnote 5 First, it is challenging to ascertain the relative magnitudes of mechanical and psychological effects. Secondly, electoral reforms often arise in times of political change, which makes inference more complicated.Footnote 6
Early attempts at capturing Duverger’s mechanical and psychological effects relied on cross-country data and produced mixed results.Footnote 7 Cross-country analyses of electoral systems are problematic, since countries differ along many dimensions, making the identification of causal effects difficult. To mitigate this omitted variable problem, scholars have increasingly exploited within-country variation in electoral laws. These studies suggest that strategic adjustments to electoral reform could be substantial.Footnote 8 We add to this literature by combining a strong identification strategy with a novel method for disentangling psychological and mechanical effects.
To date, Blais et al. has provided the best attempt to separate the psychological and mechanical effects.Footnote 9 They use data from simultaneous lower and upper house elections in Switzerland and simultaneous elections for the Japanese Lower House. They find that psychological effects pertaining to both voters and parties are empirically relevant. Our empirical approach builds on the method proposed in their article. Like Blais et al., our basic idea is to use the electoral system’s formulaic structure to generate a large set of counterfactual election outcomes.
In comparison to Blais et al., our article makes two key contributions. First, we extend their framework for comparing electoral systems to specifically examine reforms. This has important implications for how the two types of effects should be considered. Specifically, we demonstrate that the psychological effect consists of two components when applied to electoral reforms: (1) how parties and voters adjust in response to the new system and (2) how these strategic responses change the mechanical effect.
Our second contribution is to apply the methodological framework to an empirical setting in which we can estimate the causal psychological effects under plausible assumptions. A specific concern with the approach of Blais et al. is that simultaneous elections can be expected to have an independent effect on both voting and party behavior.Footnote 10 Our empirical approach, which uses an arguably exogenous change in the electoral system, rests on a weaker identifying assumption. For example, it is not problematic for our research design if omitted factors affect political outcomes, as long as these factors remain constant over time.
While most existing analyses of electoral reforms are based on national data, often comparing majoritarian and proportional electoral systems, we study a Norwegian municipal electoral reform within the class of proportional election systems. Specifically, we analyze the switch from a D’Hondt (DH) to a Modified Sainte-Laguë (MSL) seat allocation formula, which took effect with the 2003 municipal elections. The reform was uniformly imposed by the central government on the municipalities, which makes it plausible to treat the reform as exogenous with respect to local political outcomes. Another attractive feature of the reform is that it only affected municipal elections, while the simultaneously held county elections were not affected. Thus we can isolate the electoral reform’s effect from other general time trends.
The change from the DH to the MSL method mechanically increases the proportionality of the seat allocation – mostly because of a reduction in the effective electoral threshold.Footnote 11 This will, holding political agents’ behavior constant, increase the number of parties winning representation.
All agents that care about the election’s outcome may react strategically to the mechanics of the electoral system. The psychological effects therefore encompass strategic behavior on the part of both citizens and political elites.Footnote 12 Changing the electoral system from DH to MSL is expected to produce three types of psychological effects.
First, we expect the reform to lead to less strategic desertions of small parties. Votes for small parties that were previously viewed as wasted are now more likely to be seen as going to a party that has a chance of winning representation. Secondly, we predict similar adjustments on the political system’s supply side: since entry is costly, both in terms of effort and resources, parties will enter the election only if the benefits of running outweigh the costs. We therefore expect more parties to run in a given district after the reform.
Finally, in our empirical setting, a municipality’s discretion to set the size of its council may be used to offset the effect of the reform. Reducing the council size will mechanically increase the effective electoral threshold and increase the advantage for large parties. Thus we would expect to see a reduction in the council sizes at the time of the reform. Such ‘defensive behavior’ is expected to dampen the reform’s effect.
Our results confirm our prior expectations and show that voters, parties and incumbents all responded to the reform. We find that the number of parties that won council seats increased by, on average, about 0.2. About half of this effect is due to the mechanics of the seat allocation formula. The other half is due to a shift in the voting distribution toward smaller parties. Without reductions in council sizes, the total effect of the number of parties winning representation would have been slightly larger.
The psychological effect on the lists winning council seats seems to be driven by dynamic adjustment on the political system’s supply side. In line with the conjecture of Cox, our results indicate that strategic responses in the elite strata are relatively more important than strategic responses in the mass electorate.Footnote 13
APPLICATION
In October 1997, Norway’s national government appointed an electoral reform commission with the mandate to simplify and revise the electoral system. In January 2001, this commission presented a report with proposed electoral reforms, one of which was to change the allocation formula used for translating votes into seats at the municipal level from a DH to an MSL formula. The reform commission argued that this change would be advantageous since it would harmonize electoral rules across all governmental tiers.Footnote 14 This proposal was incorporated into electoral law in June 2002.Footnote 15
Descriptive Analysis
Our empirical analysis is based on data from 387 municipalities for the election preceding the reform (1999) and the election following the reform (2003).Footnote 16 Table 1 offers descriptive statistics by election year on the main outcome variables we use in the empirical analysis: the number of parties winning representation (NoP), the effective number of parties (ENoP), an index developed by Laakso and Taagepera, and the index of disproportionality proposed by Gallagher.Footnote 17 In addition, we provide descriptive statistics for some underlying factors that may also be affected by electoral reform: the number of parties running, the effective number of parties based on votes cast (ENoP Votes ), the number of joint lists and the council size (for further details, see Online Appendix B).
Descriptive Statistics, Pre- and Post Electoral Reform

Note: the main outcome variables are the number of party lists represented in the council (NoP), the effective number of parties (ENoP) and the Gallagher Index, which measures the disproportionality of the electoral system (Index). Descriptives are based on municipal elections in 1999 and 2003. Data from Fiva, Halse, and Natvik (Reference Fiva, Halse and Natvik2012). Column 3 provides differences in mean estimates with standard errors clustered at the municipal level in parentheses. ***p<0.01.
We document an increase in NoP and ENoP, and a fall in the disproportionality index that coincides with the electoral reform. We also find that the average number of parties running increased from 6.35 to 6.73 after the electoral reform. There were fewer joint lists after the electoral reform, but the difference is not statistically significant.
When calculating ENoP based on votes cast (rather than on the allocation of seats) we find a shift in the vote distribution toward small parties, but the difference is not statistically significant. In Online Appendix B, we investigate the shifts in the distribution of votes in more detail and document a noticeable shift in votes toward small parties after the reform. For example, the share of votes for parties that receive less than 5 per cent of the total votes increased by about one-third.
The number of council members is chosen by the previous local council, but the local discretion is subject to restrictions imposed by the Local Government Act of 1992. Table 1 shows that from the 1999–2003 to the 2003–07 election period, the average council size fell by 2.5 members, corresponding to an average reduction of about 10 per cent. For all other election years in the period 1975–2007, the average council size change was much smaller (see Online Appendix B).
Seat Share-Vote Share Curvature
To demonstrate how the change in the seat allocation formula changed the relationship between votes and seats, we show the seat share-vote share curvature before and after the reform in Figure 1.Footnote 18
Seat share-vote share curvature, before and after reform Note: the figure is constructed by grouping (binning) parties together based on their vote share, using a bandwidth of 1 percentage point. The data are from municipal elections in 1999 and 2003.
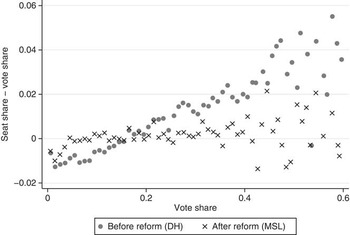
As expected, the advantage given to large parties is greater when using DH than when using MSL. A party that received 40 per cent of the votes before the reform would, on average, receive a ‘seat share bonus’ of about 2 percentage points, while it received a bonus of about half a percentage point after the reform.
County Elections
An important part of our identification strategy is that we can use the county election returns in each municipality to control for general time trends in party support. In Online Appendix B, we document that there is a strong degree of overlap between patterns of voting across the two offices. Our outcomes of interest are also similar if we use the county election returns to calculate them. In Figure 2, we show the relationship between the actual municipal outcomes and the counterfactual outcomes, in which we use the votes for the county election (measured at the municipality level) to allocate the seats, but keep everything else constant. We show both the scatterplot and the binned averages of the county controls as a function of the actual outcome. For both ENoP and Gallagher’s Index there is a strong and essentially linear relationship. This provides a strong rationale for our identification strategy, which will be explained in more detail below.
Municipal outcomes and the county control Note: the scatterplot to the left shows the relationship between the ENoP based on the local council and the ENoP of a counterfactual local council based on votes for the county election (measured at the municipal level). The scatterplot to the right shows the relationship between the Gallagher Index based on municipal vote and seat data and the corresponding variable for the county-level voting and (hypothetical) seat data (measured at the municipal level). The data are from municipal and county elections in 1999 and 2003. The larger circles are binned averages with fifty observations in each bin.

METHODS
The key empirical challenge of separating the mechanical and psychological effects of electoral reform is that they occur jointly. Our empirical approach addresses this issue through pairwise comparisons of actual and counterfactual seat allocation outcomes. The basic intuition behind this approach is to use counterfactual seat allocations to answer the ‘what if’ questions that provide the foundation for separating the two different types of effects. The estimate of the mechanical effect, for example, answers the question ‘What would have happened if we changed the electoral system, but kept everything else constant.’ By creating a counterfactual seat allocation in which we keep everything constant, we can answer this question.
To illustrate our empirical strategy we use Figure 3, which shows both actual (cells A and D) and counterfactual seat allocation outcomes (cells B, C and D 99). In each cell we show the mean values for our three main outcome variables. We return to these in the results section.
Illustration of empirical strategy Note: the figure shows the actual pre- and post-political outcomes (A and D) and the counterfactual political outcomes (B, C and D99). Reported are mean values of the number of party lists represented in the council (NoP), the effective number of parties (ENoP) and the Gallagher Index, which measures the disproportionality of the electoral system (Index).

The counterfactual seat allocations necessary for separating the psychological and mechanical effects are constructed as follows. In cell B we apply the post-reform seat allocation method, MSL, to the pre-reform vote distribution. In cell C we instead apply the pre-reform seat allocation method, DH, to the post-reform vote distribution.
In cell D, which is split into two parts, we use the actual post-reform vote distribution and seat allocation method. The difference between the left-most part (which we refer to as D) and the right-most part (which we refer to as D 99) is that the former uses the actual council size to distribute seats, while the latter uses the pre-reform council size. A comparison of these two parts of cell D allows us to isolate the impact of the reduction in council size.
Before we explain how we separate the mechanical and psychological effects, we analyze the total effect of the reform by simply comparing actual pre- and post-reform seat allocation outcomes (A vs. D).
The mechanical effect of the reform is how the electoral outcome would have changed with the introduction of the new seat allocation method, if everything else had remained constant. Cell B captures such a ‘parallel world’. Thus by comparing counterfactual Outcome B to the actual pre-reform Outcome A, we can exactly measure the mechanical effect.
Since Outcome B does not take into account the strategic reactions of voters and parties, a comparison of A vs. B gives us only part of the picture. To fully understand the consequences of electoral reform we also need to quantify the psychological effects. We do this by keeping the seat allocation method constant while allowing everything else to change. In our framework, this is done by contrasting the counterfactual Outcome B, in which we apply the post-reform seat allocation method to the pre-reform voting outcome, with the actual post-reform seat allocation outcome D. Thus the total effect of reform (A→D) is the sum of the mechanical effect (A→B) and the psychological effect (B→D).
The psychological effect can be partitioned into two subcomponents. First, we have the direct effect of political agents adjusting in response to the new system. For example, a substantial shift in votes toward smaller parties will increase the number of parties winning representation, even if we (counterfactually) use the pre-reform seat allocation method to allocate the seats. This part of the psychological effect is quantified by contrasting the actual pre-reform seat allocation (Outcome A) with the counterfactual seat allocation (Outcome C), in which we apply the pre-reform seat allocation method, DH, to the post-reform vote distribution.
The strategic responses of voters and parties may also impact political outcomes indirectly by changing the mechanical effect (the impact of a lower effective electoral threshold). To see why, consider the same example as above: a shift in the vote distribution toward smaller parties, either as a consequence of strategic behavior from voters or parties, would lead to a heavier left tail of the vote distribution. The mechanical effect of changing from DH to MSL using the post-reform vote distribution will therefore have a larger impact on the number of parties winning representation than if we use the pre-reform vote distribution. The second component of the psychological effects is therefore to reinforce the mechanical effect. To measure this effect, we compare the impact of changing the seat allocation method after the political actors responded to the reform (C→D) to the unmitigated mechanical effect (A→B), which is calculated under the political status quo.
Finally, we examine the impact of changes in council sizes. Strategic changes in council size may affect the political outcomes we study both directly and indirectly. The mechanical constraints of the electoral system will directly change as a consequence of changes in the council sizes. As we discuss above, this will partly offset the effect of the changes in the electoral formula, which may indirectly affect the behavior of voters and parties. With our framework we cannot isolate the consequences of actions that are indirect responses to the reform. However, we can quantify how much of the total psychological effect was driven by the direct effect of reducing the council size. We do this by comparing the actual post-reform seat allocation Outcome D to a counterfactual situation in which the council size remained constant at the 1999 level (D 99).
Estimation Strategy
The basic principle of the estimation strategy is a pairwise comparisons of the outcomes in Figure 3, in different pairs of cells, c. The regression analysis takes the following form:
 $$Y_{{i,c}} =\alpha _{i} {\plus}\beta Reform_{c} {\plus}\gamma Y_{{i,c}}^{{County}} {\plus}{\varepsilon}_{{i,c}} ,$$
where Y i,c is an outcome variable based on the outcome (NoP, ENoP, Index) in cell c for municipality i, α i is a set of municipal fixed effects, and Reform c is a dummy variable equal to 1 for the cell that corresponds to a reform cell, and 0 for the comparison cell. For example, to estimate the mechanical effect of changing the electoral system from DH to MSL we define Reform A = 0 and Reform B = 1. Here, β is the parameter of interest capturing the effect of the electoral reform on Y i,c . We cluster standard errors at the municipality level to allow for arbitrary correlation within each municipality.
To avoid contamination of the estimated reform effects by general changes in party support, we exploit the fact that municipal and county government elections coincide in time and space. More explicitly, we utilize the information we have on voting behavior from the same electorate for a separate office, but where the electoral formula remained constant before and after the municipal electoral reform. Even though the seat distribution at the county level is determined by considering the entire county jointly, we exploit election returns measured at the municipal level to construct a set of control variables $Y_{{i,c}}^{{County}} $
.Footnote
19
$Y_{{i,c}}^{{County}} $
.Footnote
19
Thus β captures the causal effect of the electoral reform on Y
i,c
as long as Cov(Reform
c
,ε
i,c
)=0. The identifying assumption is that after conditioning on $Y_{{i,c}}^{{County}} $
, there are no time-varying factors (correlated with reform) that have an independent impact on Y
i,c
.
$Y_{{i,c}}^{{County}} $
, there are no time-varying factors (correlated with reform) that have an independent impact on Y
i,c
.
As mentioned in the introduction, the closely related analysis of Blais et al. utilizes differences in electoral rules across simultaneous elections to identify psychological and mechanical effects. For this strategy to produce unbiased estimates, one needs to assume that all factors affecting voter and party behavior, except the electoral rules, are similar across both elections.Footnote 20 This assumption is likely to be violated, as the strategic decisions of political agents may produce interaction or contamination effects across simultaneous elections. Voters might, for example, engage in electoral balancing across legislatures. Simultaneous elections can also affect party behavior. For example, consider the case of the simultaneous Swiss elections to the upper and lower houses used by Blais et al. The lower house elections are proportional, while the upper house elections are conducted in single- or two-member districts. Small parties therefore have incentives to put their best candidates in the lower house elections, since they have little chance of winning representation in the upper house election. If this is the case, it would bias the estimates.
Our empirical approach, utilizing an arguably exogenous change in the electoral system, rests on a weaker identifying assumption. It is not problematic for our empirical strategy if omitted factors affect the political system, as long as these factors remain constant over time. Yet interaction or contamination effects across simultaneous elections may still bias our results. For example, if electoral reform incentivizes strategic entry at the municipal level, it may increase the number of parties running at the county level as well. Such lack of independence across elections would bias our tests against finding any effect of electoral reform.Footnote 21 We therefore report results both with and without county controls.
A limitation of our approach is that the total psychological effects may unfold gradually over subsequent elections.Footnote 22 Our empirical approach only captures the short-term effects, and may therefore be considered a lower bound on how electoral systems affect the strategic behavior of political agents.
RESULTS
In Table 1, we present our main results. In the first row we show the estimates for the total effects of electoral reform (A→D). This is followed by the estimates of the mechanical effect (A→B), the total psychological effect with (B→D) and without council size changes (B→D 99), the two subcomponents of the psychological effect ((A→C) and ([C→D]−[A→B])), and finally the effect of the council size reduction (D 99→D).
The county control is irrelevant for the mechanical effect, since we evaluate the reform’s effect on a given vote distribution. This is also the case when we evaluate the effect of the council size change. All other regressions are estimated both with and without the county control, but we only report the estimates for the county control for the total effects.
Number of Parties
The results for the NoP represented in the council are shown in Columns 1 and 2 of Table 1. In line with the descriptive analysis, we find that the reform increased the number of party lists in the council by 0.20. This is a nontrivial effect, which is statistically significant at the 1 per cent level. If no municipality increases the number of party lists by more than one, the point estimate indicates that an additional party list will be present in one out of five municipalities. The county control is also statistically significant with the expected positive sign, but including it leaves the estimate of the reform effect basically unaltered.
The mechanical and psychological effects are of a similar magnitude and contribute roughly equally to the total effect. The total psychological effect (B→D) is only statistically significant at the 10 per cent level (and only when the county control is included). However, if we counterfactually hold the council size constant, the psychological effect almost doubles and becomes statistically significant (compare Rows 4 and 5). When we separate the two components of the psychological effect (Rows 6 and 7), we see that most of the effect operates through the mechanical effect.
The psychological effect can be driven by dynamic adjustment on the political system’s supply (strategic entry) or demand side (strategic voting), or both. We cannot fully separate the two mechanisms, since parties’ strategic responses could take two broad forms. The first concerns the decision to run in an election. The second concerns changes in behavior when a party decides to run (for example, increased campaigning). We can, however, split the sample according to whether the number of lists was constant, or if new lists were running to shed some light on this issue. Conducting such an analysis, we find that there was only a positive psychological effect when new lists were running. This is a clear indication that the effect is primarily driven by strategic responses on the supply side.Footnote 23
Finally, the results show that the effect of reducing the council size (Row 8) is statistically significant and that it reduced the number of represented parties by 0.057 per municipality. In the aggregate, this means that the reduction in council size stopped about twenty-two party lists from getting into a municipal council (387×0.057).
Effective Number of Parties
As reported in Column 3 of Table 2, the ENoP increased by 0.26 as a consequence of the electoral reform, which corresponds to about one-fourth of a standard deviation. This effect is statistically significant at the 1 per cent level, and basically remains unaltered if we include the county control (Column 4). This suggests that electoral balancing across the two elections does not seem to be a source of bias. The positive effect of the county control implies a positive association between the fragmentation of the local council and the fragmentation of a counterfactual local council based on votes for the county election (measured at the municipal level). Since the electoral reform estimate barely changes when we include a highly relevant control variable, it is unlikely to change much if we could perfectly control for changes in party support that are unrelated to the electoral reform. This contention is further supported by a set of placebo regressions using information from elections held in 1995 and 2007 (see Online Appendix C).
Decomposition of Mechanical and Psychological Effects

Note: outcomes refer to notation presented in Figure 3. The dependent variables are the number of party lists represented in the council (NoP), the effective number of parties (ENoP) and the Gallagher Index, which measures the disproportionality of the electoral system (Index). The county control is computed using municipal-level voting data for the county elections. The county elections coincide in time and space with the municipal elections, but the allocation formula used did not change. Outcome subscripts denote the council size used to allocate the seats. Municipality fixed effects are included in all specifications. Standard errors clustered at the municipality level in parentheses. *p<0.10,**p<0.05, ***p < 0.01.
As expected from Figure 3, we see that the mechanical effect is almost entirely driving the total effect. The shift in the voting distribution toward smaller parties increases the ENoP, but the effect is small and statistically insignificant. The reduction in council size contributes to a slightly lower ENoP level, but relative to the total effect the contribution is small.
The reason why the mechanical effect overwhelms the psychological effects is evident in Figure 1. Under MSL, only the small parties around the threshold for the first seat are disadvantaged. Under DH, all small parties are disadvantaged. This results (mechanically) in a much more even distribution of seats under MSL than DH. The comparable shift in the vote distribution is much smaller. Thus the psychological effect will only impact a small subset of the parties, while the mechanical effect affects all of them.
Gallagher’s Disproportionality Index
The results for the disproportionality index are provided in Columns 5 and 6 of Table 2. The total effect of about −0.5 percentage points corresponds to almost one-half a standard deviation decrease in disproportionality. The county control is statistically insignificant.
For the disproportionality index, the psychological and mechanical effects go in opposite directions. Given that DH causes a systematic divergence between the seat share and the vote share (evident in Figure 1), the mechanical effect contributes to a reduction in disproportionality. The psychological effects go in the opposite direction. This dampening effect is driven by the reduction in council size (compare Rows 4 and 5, see also Row 8). Given that the average deviation between the seat share and vote share will automatically increase as we reduce the council size, this result is what we would expect. The part of the psychological effect that is directly induced by the shift in the voting distribution toward smaller parties does not contribute to a change in the disproportionality index. This is because there is only a weak relationship between the vote share and the difference between the seat share and vote share under the MSL (cf. Figure 1).
Magnitude of Effects: Historical Context
In 1953, a similar electoral reform to the one studied here was implemented at the national level in Norway. Since the national electoral reform was a compromise between the Labor Party and the opposition parties, one should be cautious about giving changes in outcomes over time causal interpretations.Footnote 24 They are nonetheless useful for putting our results into context. Lijphart found that the national reform of moving from DH to MSL in Norway in the 1950s led to an increase in the ENoP of 0.35 and a decrease of the disproportionality index of 4.15 percentage points.Footnote 25 The results we find for the ENoP are thus comparable to the national reform, while the effect on the proportionality of the election system is much smaller. One explanation for this difference is that the pre-reform level of disproportionality was higher at the national than at the municipal level.
Council Size Reductions
As seen above, the reductions in council size did play an important role in reducing the impact of the reform. However, looking at the full sample we get the average across places that did and did not reduce the council size. To assess the impact of the reduction, we should analyze the places that reduced their council size, with the expectation that the reductions had a clear effect. In Table 3, we present the most important estimates, including the total effect (A→D), the mechanical effect (A→B) and the total psychological effect (B→D 99). Each effect is estimated separately for municipalities that kept their council size constant (Columns 1, 3 and 5) and those that reduced it (Columns 2, 4 and 6).
Electoral Reform Effects by Council Size Reductions

Note: for explanatory details, see Table 2.
We first turn to the results for the NoP. Where the council size was constant, the total effect was an increase of almost 0.3 parties per municipality, while there was no increase in municipalities that reduced the council size (Column 2). Council size reductions prevented a greater number of represented parties after the reform. There was essentially no difference in the mechanical effect between the two groups (second row). The psychological effect was about 50 per cent larger where the council size was not changed (third row). Although the difference is not statistically significant, it suggests that voters and parties were more responsive when the implicit electoral threshold was reduced the most. Finally, in the municipalities that reduced the council size, the total impact was to reduce the average number of parties by 0.16.
For the effects on the ENoP, we do not see much of a difference between the places that did and did not reduce their council size. This reinforces the findings from Table 1 that the council size reduction only had a minor impact on this outcome.
For the Gallagher Index, the reduction in council size does have an important impact. When we compare the total effects, we see that the council size reductions essentially cancel out the effect of the reform. This is due to the fact that when there are fewer seats to distribute, the average deviation between the seat share and vote share becomes larger. Again, there is no difference in the mechanical effect between the two groups. As we saw in Table 1, the shift in the vote distribution had no noticeable impact on disproportionality, which is also the case when we look at the two groups of municipalities individually (B→D 99). In municipalities in which there was a reduction, the total impact was almost the same size as that of the mechanical effect, but of the opposite sign.
CONCLUSION
Ever since Duverger, there has been a long-standing interest in the mechanical and psychological effects of electoral systems.Footnote 26 In this article, we propose a framework for uncovering the causal effects of electoral reform, which allows us to ascertain the relative magnitudes of these two effects. We use this framework to show how the psychological effect may operate through the mechanical effect of the reform.
Our application is based on a nationwide municipal electoral reform in Norway, which changed the seat allocation method from D’Hondt to Modified Sainte-Laguë. The total effects of the electoral reform are all in line with what we expect: the proportionality of the seat allocation, the number of parties represented and the effective number of parties all increase. For the effective number of parties, the mechanical effect drives the total effect. But for the two other outcomes, the psychological effects also play an important role.
For the proportionality of the seat allocation, the mechanical and psychological effects go in opposite directions. The mechanical effect increases the proportionality of the system, while reductions in the size of the local council (a choice variable for pre-reform incumbents) contribute to reduced proportionality. This psychological effect served to dampen the total effect on the proportionality of the seat allocation.
While the mechanical effects of electoral reforms can be observed instantaneously, the full psychological effects may unfold gradually over subsequent elections. We find that the reform led to an extra party being represented in about one out of five councils in the first set of elections succeeding the reform. The strategic behavior of political elites contributed to about half of this effect. The other half was due to the mechanics of the seat allocation formula. Voters appear not to have changed their behavior in anticipation of the new electoral systems’ mechanical constraints. We cannot, however, rule out that such responses occur in ensuing elections.
The credibility of our empirical strategy is bolstered by the fact that the results remain unaltered when controlling for voting outcomes for county governments elected simultaneously. This suggests that the results are not likely to be driven by changes in voter sentiment between the pre- and post-reform elections.
Our analysis demonstrates that to understand the consequences of electoral reform, one needs to take into account not only the mechanical effects but also the strategic responses political agents may make in anticipation of these, and how these forces interact.


