

Introduction
Time-dependent ice-sheet modelling can provide information on the behaviour of present and past ice sheets and their response to global climate change. One of the quantities derived from such studies is total ice volume, which is related to changes in global sea level. Models are capable of providing, among other things, information on ice-sheet configurations, flow regimes and basal temperatures. The use of numerical methods in ice-sheet models makes it possible to describe the complex interactions between ice temperature, ice velocity and ice-sheet geometry.
Numerous ice-sheet modelling experiments with varying objectives have been conducted on the present Antarctic and Greenland ice sheets (cf. Reference Fastook and BrownFastook, 1990; Reference HuybrechtsHuybrechts, 1990, Reference Huybrechts1996; Reference MacAyealMacAyeal, 1992; Reference Greve and HutterGreve and Hutter, 1995; Reference HindmarshHindmarsh, 1997) and on the former Fennoscandian and Laurentide ice sheets (cf. Reference Fastook and HolmlundFastook and Holmlund, 1994; Reference Holmlund and FastookHolmlund and Fastook, 1995; Reference Siegert and DowdeswellSiegert and Dowdeswell, 1995; Reference Clark, Licciardi, MacAyeal and JensonClark and others, 1996). As models have improved in recent years, results from ice-sheet modelling have been tested against glacial-geological field data to assess theories on the formation of moraines and till covers (cf. Reference Pattyn, Huybrechts and DecleirPattyn and others, 1991; Reference HuybrechtsVan Tatenhove and Huybrechts, 1996). Ice-sheet models have also been used to study the erosive influence of ice sheets upon the subglacial landscape (cf. Reference GlasserGlasser, 1995).
Crucial to the results obtained from ice-sheet models is the accuracy of the input data. Modelling studies of the Antarctic ice sheet have in this sense benefited considerably from Budd’s 20 km by 20 km digitization of the Antarctic Folio dataset on bed and surface topography (Reference DrewryDrewry, 1983). However, Reference DrewryDrewry (1983) pointed out that some of the data in the Antarctic Folio are highly generalized, especially regarding bed altitude in areas where field data were sparse. This was certainly the case for Dronning Maud Land (DML), East Antarctica, the field area for the present study. In recent years several institutions have collected new data on ice-sheet bed and surface elevations in DML, including the Alfred Wegener Institute for Polar and Marine Research, Bremerhaven, Germany; the Institut fur Angewandte Geodasie (IfAG), Frankfurt, Germany; the Department of Physical Geography at Stockholm University; the Norsk Polarinstitutt, Oslo/Tromsø; and the British Antarctic Survey, Cambridge, U.K. Pending the compilation and publication of these and other new Antarctic data (Reference VaughanVaughan, 1996), some of these new field data have been combined with previously published data to create a detailed 10 km by 10 km resolution digital dataset of bed and surface topography for western DML (Reference Naslund, Holmlund and OerterNäslund and Holmlund, 1996; Fig. 1).
Location map of western DML. The 400 km×440 km area covered by the new 10 km×10 km resolution data set of bed and surface topography is marked by the square. Note the location of the Vestfjella and Heimefrontfjella nunatak ranges and Veststraumen.

The new high-resolution dataset was used in the present study as input to a time-dependent ice-sheet model. Modelling experiments were then carried out with two objectives: (i) to study the response of this part of the East Antarctic ice sheet to climatic change, and (ii) to study changes in basal thermal conditions between the present ice sheet and a maximum palaeo-ice configuration. Before these two studies were executed, the model was calibrated under present climate conditions, providing information on present ice-flow patterns and basal temperatures. The results from the subsequent six climate-change simulations provide information on how the ice sheet may react to changes in climate. The results can be used when we try to explain potential future observations of changes in ice-sheet volume. The section on the modelling of a maximum possible palaeo-ice-sheet configuration is central for the study of the long-term landscape development of DML (Reference Holmlund and NäslundHolmlund and Näslund, 1994; Reference NaslundNäslund, 1997, Reference Naslund1998). The objective is to test the hypothesis that the coastal mountain ranges within the study area are cold-based at present, and that they were also cold-based during past periods with a more extensive ice-sheet coverage and colder climate. If this was the case, the glacial landscape that dominates these mountain ranges has been formed or reshaped, not by the late Cenozoic Antarctic ice sheet, but rather by earlier wet-based mountain glaciers and ice sheets. Changes in the distribution of basal melting, and thus erosive capacity, between the present ice configuration and the maximum ice sheet are discussed in relation to the genesis of large-scale glacial landforms at high elevations, and landscape modification in general.
Description of the Model
The model is a time-dependent map-plane model, which uses the finite-element method to solve the mass-continuity equation. Earlier versions of the model have been described in detail elsewhere (Reference Fastook and ChapmanFastook and Chapman, 1989; Reference Fastook and BrownFastook, 1990, Reference Fastook1994; Reference Fastook and HolmlundFastook and Holmlund, 1994). The model exclusively considers ice that is grounded, i.e. it does not include ice shelves. The grounding line is free to migrate according to changes in upstream ice-sheet dynamics and to bed topography. Isostatic changes of the bed are taken into account by the model. Changes in sea level are not treated by the model, which has some implications for the interpretation of the results. This version of the model was part of the European Ice Sheet Modelling Initiative (EISMINT) phase two, which aimed at comparing existing ice-sheet models, and it yielded output results in good agreement with other major ice-sheet models (Reference PaynePayne and others, in press).
The main input to the model, apart from bed topography, is a parameterized mass balance at each grid node. A mass-balance relationship based on an empirical fit to present-day accumulation rates for the Antarctic ice sheet was adopted (Reference Fastook and PrenticeFastook and Prentice, 1994). The mass-balance relationship follows Reference Jouzel and MerlivatJouzel and Merlivat (1984), Reference Braithwaite, Olesen and OerlemansBraithwaite and Olesen (1989) and Reference Fortuin and OerlemansFortuin and Oerlemans (1990). The mass-balance scheme gives an accumulation rate at each node determined by surface altitude, surface slope and latitude, thus constituting a simple parameterization of the ice sheet’s effect on local climate. For each node, a surface temperature is derived from a lapse rate (0.9oC per 100 m) modified for distance from the pole. The temperature is used to calculate saturation vapour pressure, and the accumulation rate is obtained from a fit of accumulation rate as a function of saturation vapour pressure and surface slope. A comparison between the output from the mass-balance parameterization and field data is made in the section “Calibration of the model”. The climate forcing of the entire ice-sheet model is done by varying the mean annual air temperature near sea level (TNSL).
In the absence of an ice-shelf model, a calving-rate factor along the grounding line is used to simulate ice-shelf calving. This is done by introducing a specified amount of ablation for the grid where the grounding line is located.
A finite-element temperature solver, with 20 layers through the ice thickness, is coupled to the mass-continuity solver to generate ice temperatures. Derived ice temperatures, together with density variations with depth, control ice hardness and ice flow. The thermodynamic calculation accounts for vertical diffusion, vertical advection, and heating caused by internal shear. Heating by internal shear is important for ice deformation near the bed where most of the shearing occurs. Horizontal diffusion and advection of heat within the ice sheet is not considered, nor does the model incorporate heat conduction in the upper layer of bedrock. The formula used for calculating the pressure-melting point (pmp) is:
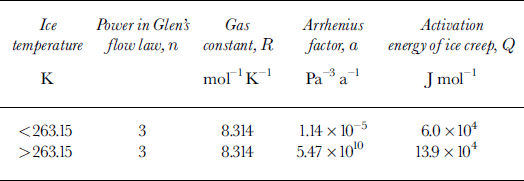
(Reference Huybrechts and PayneHuybrechts and others, 1996), where T m is the pressure-melting temperature expressed in Kelvin, T 0 is the triplepoint temperature of water (273.15 K), b is the change in melting point with ice depth (8.7 × 10⁻⁴ K m−1) and H is the ice thickness in metres. All basal temperatures reported in the study are relative to pmp, i.e. the zero contour line on maps showing basal temperatures encloses areas with basal melting. For the ice thicknesses within the study area, the maximum deviation between pmp and 0°C is ∼1.75°C. The reported values of basal temperatures are estimated to be reliable within ±5°C. Although this accuracy is rather low, it is sufficient for the objectives of the study. The flow parameters were set according to Table 1, basically following Reference Paterson and BuddPaterson and Budd (1982) and Reference PaynePayne and others (in press).
Flow-law parameters used in the experiments
Study Area and Topographical Data
The study area is located in the coastal region of western DML (Fig. 1). Two mountain ranges, Vestfjella and Heimefrontfjella, are located approximately parallel to the coast. The area between the mountain ranges, Ritscherflya, is 500–1500 m a.s.l. The Amundsenisen high-altitude polar plateau is situated southeast of Heimefrontfjella. The approximately 80 km wide Veststraumen ice stream drains the ice sheet between Heimefrontfjella and Vestfjella. The maximum ice velocity of Veststraumen in the grounding zone is ∼200 m a−1, giving an approximate flux rate of 12–16 km3 a−1. The maximum ice thickness within the study area, ∼2000 m, is found in Veststraumen and at the polar plateau. In places, the bed of Veststraumen is 800 m below sea level. A local ice dome, Hogisen, is located on the northwestern side of Vestfjella (Fig. 1). A small, 20 km wide ice stream, Plogbreen, is located northeast of the ice dome. The 110–150 km wide Riiser-Larsenisen ice shelf is situated along the coast. A more detailed description of this region is given in Reference Holmlund and NäslundHolmlund and Näslund (1994) and Reference NaslundNäslund (1997).
In order to perform credible modelling experiments on the study area, a 10 km×10 km resolution dataset of ice-sheet surface and bed topography was constructed by compiling old and new data (Figs. 1 and 2). The area covered by the dataset has its two northern corner points at 71°23′S, 16°51′W and 72°5′S, 5°46′W, and its southern corners at 75°8′S, 21°7′ Wand 76°0′S,7°28′W (Fig. 1). It covers an area of 400 km x 440 km (176 000 km2), resulting in 1845 grid nodes. The ice-sheet surface topography and ice-velocity measurements (unpublished data, Department of Physical Geography, Stockholm University) show that ice fluxes into the region across the southern and northern borders are low.
Maps showing the surface topography (a) and bed topography (b) of the study area according to the dataset compiled for the present study, and the surface topography (c) and bed topography (d) of the same area as represented in the Antarctic folio data. In (b) note the deep trough north of Heimefrontfjella and the smaller trough in northern Vestfjella hosting the Veststraumen and Plogbreen ice streams, respectively. The coordinate system, expressed in km, has its origin at the pole, with positive X along the 90° E longitude and positive y along the 0° longitude. The data shown in (a) and (b) were used as input to the model.

A large part of the data on ice-sheet surface and bed elevations used for the datasets was collected by the Department of Physical Geography, Stockholm University. These radar soundings of ice thickness, and differential global positioning system measurements of ice-surface altitude, were performed during the Swedish Antarctic Research Programme (SWEDARP) expeditions, 1987–94 (Reference HolmlundHolmlund, 1988; Reference Holmlund, Isaksson and KarlénHolmlund and others, 1989; Reference Naslund, Pohjola and StroevenNäslund and others, 1991, Reference Näslund, Huss, Richardson, Melander and Grönlund1995; Reference Naslund and BodinNäslund and Bodin, 1994; Reference Kuylenstierna, Bronge and Lonnroth-GarlssonKuylenstierna and Bronge, 1995). Additional data on bed topography were taken from Reference DrewryDrewry (1983), Reference Orheim and DrewryOrheim and Drewry (1986) and Reference Hoppe and ThyssenHoppe and Thyssen (1988). Additional information on surface altitude was taken from topographical maps published by the Norsk Polarinstitutt (1972–78), from satellite image maps by IfAG (1988–89) and from Reference StåhlStåhl (1994). More information on the data and methods used to compile the datasets can be found in Reference Naslund, Holmlund and OerterNäslund and Holmlund (1996).
The accuracy of the new dataset varies according to the quality of the data used for different sub-regions. Bed data have a generally lower accuracy than surface data due to the rougher topography of the bed. Bed altitudes (Fig. 2b) are generally estimated to be correct to within ±150 m. In the southwestern corner of the study area and in the deep trough of Veststraumen the bed altitude may be incorrect by several hundred metres. Nevertheless, the large-scale bed morphology of the region is well depicted by the bed dataset. The topography of the ice-sheet surface (Fig. 2a) is estimated to be correct to within ±100 m.
When comparing the new dataset (Fig. 2a and b) with data from the digitization of the Antarctic Folio (Fig. 2c and d), it is important to remember that the latter was not originally intended for detailed regional studies. Nevertheless, such a comparison is justified by the fact that the Antarctic Folio database is still widely used as input to ice-sheet models, including regional-scale modelling. However, the use of data from the Antarctic Folio for regional studies should be approached with caution. This is exemplified by the present study area, where prominent features in the bed topography, such as the 500–1000 m deep trough northwest of Heimefrontfjella (Fig. 2b), are not present in the Antarctic Folio data (Fig. 2d). The trough, with its base at 600800 m below sea level, is occupied by Veststraumen which drains a major part of the ice sheet in this region. Another prominent bed feature lacking in the Antarctic Folio dataset is Vestfjella. Such major regional features are important for ice-sheet modelling on this scale. The most obvious improvement offered by the new bed dataset over the Antarctic Folio data is the large increase in detail.
The importance of improved data is also evident in the ice-sheet surface topography (cf. Fig. 2a and c). The largest difference in ice-surface elevation between the Antarctic Folio data and the new dataset is found close to the nunatak ranges. On the upstream side of Heimefrontfjella, the ice-sheet surface has been corrected by more than +1000 m, while in other places the surface has typically been corrected by −200 to +600 m. Using the Antarctic Folio data as input for ice-sheet modelling in this region would not produce acceptable results. Presumably this would also be the case for many areas at the margin of the Antarctic continent.
Boundary Conditions
Since the study area constitutes a subset of the East Antarctic ice sheet, the ice-flux boundary conditions along the margins must be defined. A zero flux was specified across the northern and southern margins of the area (Fig. 1). This is justified by the fact that ice velocities across these borders are very low, as shown by the fact that the contour lines of the ice surface are perpendicular to the boundary. Along the eastern margin, for which a low but significant ice flow was expected, the model was used to set the flux-boundary conditions to present-day conditions. The ice flux required to keep the surface at its present altitude was calculated for each node along the margin. The defined ice fluxes at the borders were then held constant in all subsequent experiments. The assumption made in adopting this approach is that any flux changes along the borders during climatic changes are negligible. This is considered to be a reasonable assumption for the study area, because along the eastern margin, i.e. on the polar plateau, changes in ice-sheet topography during the climate-change simulations are expected to be small. This has been shown to be the case in previous coarser-grid modelling studies of the entire Antarctic ice sheet where glacial/interglacial shifts produced surface elevation changes on the East Antarctic plateau typically within 100 m (Reference HuybrechtsHuybrechts, 1990). Likewise, along the northern and southern margins of the study area we did not expect changes in the surface topography that would introduce a considerable ice flux in or out of the area, but rather that the contour lines of the ice sheet would remain basically perpendicular to the margin. When constant margin fluxes are used, a climate change affects only local ice fluxes within the study area, and not ice fluxes across the borders. A result of this condition is that modelled results close to the margins should be regarded as unreliable.
An important boundary condition for the ice-temperature calculations, in addition to the air temperature used to force the model, is the value of the geothermal heat flux at the bed. In the absence of data on geothermal heat flux from the Antarctic continent, values are normally estimated from the correlation between heat flux and major geological features (Reference Lee, Uyeda and LeeLee and Uyeda, 1965). A geothermal heat flux of 0.042 W m−2 is often used in calculations of Antarctic basal temperatures (cf. Reference Huybrechts and PayneHuybrechts and others, 1996). This value is valid for Precambrian shields in general (Reference Lee, Uyeda and LeeLee and Uyeda, 1965), and should thus be applicable to the East Antarctic ice sheet. A higher value of 0.0546 W m−2 has also been used in Antarctic modelling experiments (cf. Reference HuybrechtsHuybrechts, 1990). This is usually considered as an average value for the entire Antarctic continent (Reference Sclater, Jaupart and GalsonSclater and others, 1980). In the present study, the 0.0546 W m−2 value of Reference Sclater, Jaupart and GalsonSclater and others (1980) was used. One reason for this was the location of the study area at the margin of the Precambrian shield which constitutes a former rifting zone. In this situation, tectonic movements may have generated an increased geothermal heat flux. The objective of testing the hypothesis that the mountain ranges within the study area are cold-based and were also cold-based under past, more extensive ice sheets was another reason for using the higher value. The 25% higher heat-flux value, with somewhat higher basal temperatures as a result, represents a more conservative approach in the context of the hypothesis to be tested. Nevertheless, sensitivity tests were made with different heat fluxes in order to see the effect on basal temperature. For the present-day climate, a 25% reduction in geothermal heat flux corresponds to a decrease in basal temperature of ∼3.5°C.
The model does not calculate temperatures within the subglacial bedrock. Inclusion of this process in the model would make heat flow more slowly from the bed to the ice as the bedrock changed temperature along with the ice above it.
Calibration of the model
Before model-sensitivity experiments are conducted, the model must be calibrated to determine and set unknown properties of the ice sheet, mainly regarding sliding at the bed. The aim of the calibration is to obtain a modelled steady-state ice-sheet configuration that compares well with the present configuration under the present climate. Subsequent model runs are then started from the fitted steady-state ice sheet, allowing the unique effect of a simulated climate change to be studied. This method assumes that the present-day ice sheet does not have a highly pronounced positive or negative mass balance. This assumption is supported by preliminary evaluations of mass-balance data from the area (unpublished data, Department of Physical Geography, Stockholm University).
The model was calibrated by simulating changes in basal sliding. In this process, sliding was not explicitly modelled. Instead, enhanced internal deformation was used as the fitting parameter (cf. Reference HulbeHulbe, 1998). Changes in sliding were thus simulated by changing the flow-enhancement parameter of the ice. This flow enhancement could in reality be manifested through sliding at the bed and/or softer ice close to the bed. Since we are unable to model fast-flow velocities that do not depend on stress, a reasonable alternative is to use the simulated sliding in the fitting process. The drawback to this approach is that the areas of simulated sliding, through enhanced flow, become somewhat arbitrary and fixed in time. However, this is not considered to interfere with the main purposes of the present study.
In the calibration, enhanced flow was introduced in a 30–50 km broad zone along the coastline, upstream from the grounding line. In this zone, a flow-enhancement factor of 1.4 (EISMINT enhancement factor) was applied, resulting in strain rates one order of magnitude greater than elsewhere for the same driving stress. The ice inland from this zone had no flow enhancement, i.e. a flow-enhancement factor of 1 was used. Simulating sliding in a near-coastal zone is reasonable, considering that the ice/bed interface may be in contact with the sea and thus be at hydrostatic pressure, and that the overlying ice is relatively thin. An independent dataset of ice velocities measured in the field was used to check the behaviour of the model during the calibration against the present ice-sheet configuration.
In the calibration it was clear that fitting the ice sheet to the present-day measured configuration posed some difficulties. In the lower part of Veststraumen, modelled steady-state configurations exaggerated either the velocities or the ice thickness. Steady-state velocities here were on the order of 500 ma−1, which is 2–3 times higher than measured velocities. There are five possible explanations for this:
-
1. The mass-balance parameterization at the ice-sheet surface may be oversimplified for the experiment, overestimating the accumulation rate.
-
2. The mass balance at the base of the ice sheet is not included in the mass-balance calculation, which excludes possible basal ablation by melting.
-
3. The ice flux across the eastern margin, now set as a constant boundary condition, could be overestimated.
-
4. The way in which basal sliding is treated may be too simple.
-
5. This part of the ice sheet has a positive mass balance.
The third explanation was tested by setting the boundary flux to zero. The fitting problem remained, showing that this explanation was not important in causing the inaccurate fit.
Regarding the surface mass-balance parameterization, a comparison between the present-day accumulation rate obtained from the mass-balance parameterization (Fig. 3) and extensive field data (cf. Reference Isaksson and KarlénIsaksson and Karlén, 1994; Reference Richardson, Aarholt, Hamran, Holmlund and IsakssonRichardson and others, 1997) indicates that the accumulation rates produced are generally in good agreement with field data. In some regions, however, such as on the high-altitude polar plateau and in a zone immediately upstream from the area with steep surface gradients along the grounding line, the model seems to slightly overestimate the accumulation rate, while around and within Heimefrontfjella the modelled accumulation seems to be underestimated. The possible overestimation of the mass balance for some areas may contribute to the difficulty in fitting the ice sheet. The mass-balance parameterization was originally constructed for the Antarctic ice sheet as a whole (Reference Fastook and PrenticeFastook and Prentice, 1994). Ideally, for the present type of study, one would use a regionally based mass-balance parameterization, based on field data from the region studied. Nevertheless, the more generalized mass-balance parameterization is regarded as sufficient for the purposes of this study.
Present-day accumulation rates obtained from the model mass-balance parameterization.

Regarding the mass balance at the base of the ice sheet, tentative results from the modelling experiments indicate that as much as 1m a−1 of melting may occur beneath Veststraumen. Including this factor in the mass-balance calculation would remove mass from the system that may now appear as either too high velocities or too thick ice. Improving the mass-balance parameterization and including basal melt in the mass-balance calculation would improve future modelling studies, as would the inclusion of a better treatment of basal sliding. The overall conclusion is that all the above explanations except the third may be involved in producing the difficulty in the fitting process.
With the above information in mind, we decided for the present study to use a calibrated steady-state ice sheet where ice thicknesses were in agreement with measured data, and accepted that modelled steady-state ice velocities in the lower part of Veststraumen were higher than in reality. In the final fit to an equilibrated ice sheet, the present-day measured ice-sheet configuration (Fig. 2a) was run for 20 kyr in 2 year time-steps under the present-day climate (TNSL set to −14°C). The resulting present equilibrated ice-sheet configuration is seen in Figure 4. For most areas, the ice-sheet surface elevations in this configuration are within 100–150 m of measured surface elevations (Fig. 2a). One minor area northeast of Vestfjella is 300 m off. The uncalibrated ice sheet (Fig. 2a) has a total ice volume of 135 000 km3, while after calibration (Fig. 4) the volume is 147 000 km3. The volume error in the fitting process is thus <9% of the initial volume, which confirms a good quality of the fit regarding ice-sheet configuration. The steady-state calibrated ice sheet has an area of 123 000 km2.
The calibrated steady-state ice sheet used for subsequent experiments. The velocity vectors show column average velocity, with the longest vectors corresponding to a velocity of 500 ma−1. Note the relatively high velocities in Veststraumen (Fig. 1) and the very low velocities on the polar plateau. Line a–b shows the location of the profile in Figure 9.

The mass-balance parameterization also influences basal temperatures. One result of an overestimated mass balance is that basal temperatures are lowered due to the increased vertical advection of cold ice towards the bed. However, an overestimated mass balance also produces higher velocities, which in turn produce more shear heat close to the bed, a process opposing the effect of the vertical advection. It is not known to what extent the two processes cancel each other out, so for this study it is simply recognized that the absolute values of basal temperatures are tentative due to uncertainties in geothermal heat flux and possibly due to an oversimplified mass-balance parameterization.
Present-Day Ice-Sheet Characteristics Suggested by the Model
The velocity vectors for the present-day ice sheet clearly show the high velocity of Veststraumen compared to the surrounding ice sheet (Fig. 4). Two main source areas for the ice that enters the ice stream are also suggested, the Amundsenisen polar plateau and the Heimefrontfjella range. Ice that originates from Amundsenisen mainly deflects around Heimefrontfjella before entering the ice stream. The highest accumulation rates within the study area are found on the coastal side of Hogisen where the accumulation exceeds 0. 5 m a−1 (Fig. 3). Another area with relatively high accumulation rates is found along the grounding zone. The lowest accumulation rate, from 0.2 to < 0.1 m a−1, is found on the polar plateau.
The basal temperature distribution for the present ice sheet is seen in Figure 5. The highest basal temperatures are found where the ice sheet is thick and where ice velocities are high, for example in the Veststraumen trough (see also Fig. 9). Here the model predicts that large areas are at the pmp. Contrary to what is shown in Figure 5, Veststraumen is probably wet-based all the way out to the grounding line. A higher spatial resolution of the input data would probably give a slightly different picture in the narrow part of the trough. Some basal melting is also indicated beneath Plogbreen and in the low-relief area northeast of Vestfjella.
Basal temperature distribution for the calibrated present-day ice sheet. Temperatures are expressed relative to the pmp.

The lowest basal temperatures are found in areas where the ice sheet is thin and ice velocities low. The best example of cold basal temperatures is found within Heimefrontfjella (Fig. 5), with temperatures typically 15–30°C below pmp. In the trough valleys that cut across Heimefrontfjella, the model suggests higher basal temperatures, around 5–15°C below pmp. Gonsidering the accuracy of the temperature calculations, some of these through valleys may have melting basal ice. At intermediate altitudes, such as in the large low-relief area northeast of Vestfjella, present-day basal temperatures are approximately 10°C below pmp.
A comparison between Figures 4 and 5 reveals that, along the ice stream, the velocities are more or less perpendicular to the temperature gradients at the bed. In other words, temperatures are basically uniform along the ice stream, which indicates that the simplification of neglecting horizontal advection of heat in this case is not unreasonable. However, neglecting horizontal advection is a major shortcoming of the model and needs to be addressed in future versions. If horizontal advection were included, it would cool the ice column, since ice originating from higher altitudes has a lower temperature. This would give somewhat lower basal temperatures than in Figure 5.
Climate-Change Simulations
Description of the climate-change experiment
This experiment consists of a group of six climate-change simulations. They were performed to study the response times and changes in ice-sheet volume and flow regime in relation to present or future climate changes, regardless of any residual effects that the present ice sheet may have inherited from climate changes in the past. From the onset of the simulated climate changes, the model was run for a total of 20 kyr with a 2 year time-step. The climate forcing for the experiments is seen in Table 2. The 5°C slow-warming simulation (0.5°C per century) was conducted in order to study the response of the ice sheet in western DML to the inferred global warming (Reference Houghton, Callander and VarneyHoughton and others, 1992).
Climate forcing for the six experiments on climate change

Results
One way to study the response of the ice sheet to the simulated climate changes is to plot the evolution of the total ice volume through time. Figure 6 presents changes in total ice volume for the study area when applying the climate-forcing scheme in Table 2. The results are also summarized in Table 3. In all four of the 5°C warming and cooling simulations, the ice-sheet configuration does not reach a new equilibrium even after 20 kyr, while in the two 10°C climate peak simulations the ice sheet is close to a new steady state by the end of the run (Fig. 6). No surface melting occurs during any of these experiments.
Total ice volume as a function of time, for the entire study area during the climate-change experiments (Table 2).

Changes in total ice volume in the six climate-sensitivity experiments

Discussion
The behaviour of the ice sheet is consistent throughout the six climate-change simulations. The three climate-warming simulations all initially gave a 2–4% increase in ice volume (Fig. 6) due to a raised accumulation rate. In the lower part of the ice sheet, where most of the internal shear takes place, warming of the ice leads to an increased ice flow. At around 1.3–2.1 kyr (Fig. 6), the warm wave has reached the lower parts of the ice sheet and warmed it enough to compensate for the raised accumulation at the surface, resulting in a decreasing ice volume. The opposite is true of the climate-cooling scenarios, where the ice volume first decreases due to a decreased accumulation rate, then increases when cold ice reaches the lower part of the ice sheet, decreasing the ice flux.
All 5°C climate-change simulations give compatible results. Both the 5°C instant- and slow-warming scenarios result in a new approximate steady-state configuration smaller than the initial ice sheet (Fig. 6). The reduction is 2 000 km3, or 1.5% of the initial ice volume (Table 3). The reduced ice volume is manifested mainly as a lowering of the ice-sheet surface and not as a retreat of the grounding line. The 5°C instant- and slow-cooling scenarios result in a new approximate steady state where the ice-sheet volume is 1500 km3 greater than with the initial condition, corresponding to a 1% increase in ice volume. In other words, the investigated part of the ice sheet does not appear to be very sensitive to present or future climatic changes (within the limitations of the model, the assumptions made and the specified boundary conditions). All climate-sensitivity tests, including the 5°C slow-warming scenario which may be the most realistic one, produced changes of only a few per cent in the total ice volume. A similar temperature amplitude during a global climate change over a longer time period, and including the effect of ice build-up in the Northern Hemisphere, would yield a more drastic change in ice volume for the study area. Globally driven changes in sea level could then affect the position of the grounding line (Reference Denton, Hughes and KarlénDenton and others, 1986), and thus change the configuration of the ice. An analogous situation is simulated in the maximum palaeo-ice-sheet experiment. Nevertheless, the ice sheet appears to have a robust behaviour in response to climate change on the shorter time-scale studied. This result is in line with results by Reference HuybrechtsHuybrechts (1993), who came to the same conclusion in model studies of the entire Antarctic ice sheet. In both the 10°C warming and cooling climate-peak simulations, the ice sheet is capable of re-establishing its present configuration after the present-day climate returns. This indicates that the ice sheet has a stable behaviour in response to large climate peaks with a duration of a few thousand years.
The climate experiments simulate the reaction only of the grounded part of the ice sheet, neglecting possible increased calving and ice-shelf melt rates under periods of climate warming. Including the potential unstable behaviour of ice shelves under climate warming (cf. Reference Vaughan and DoakeVaughan and Doake, 1996; Reference Doake, Corr, Rott, Skvarca and YoungDoake and others, 1998) could make the reaction of the grounded part of the ice sheet more pronounced than is found in the climate-warming experiments. However, it is difficult to envisage what the quantitative result of this would be. Within the study area, Riiser–Larsenisen constitutes a relatively narrow, thin ice shelf with few pinning points. This could mean that including the shelf in the model would not give results considerably different from the ones reported above. Nevertheless, this incompleteness of the model should be kept in mind, especially when considering the results of the 10°C warming experiment.
In Figure 7 the response time of the ice sheet is exemplified by the first 8 kyr of the three warming experiments. Here both the climate forcing and total ice volumes are shown in the same figure. The lag between the climate peak and the volume peak is apparent. From the 5°C warming experiments it can be seen that the time lag between the climate optimum and the largest ice volume is smaller for slow climate changes (∼1kyr) than for rapid changes (∼1.4kyr) (Fig. 7). In the +10°C climate-peak experiment the time lag is very short, only 200 years (Fig. 7). This shows the immediate effect of a change in accumulation rate. The fast decrease of the ice volume is due to a reduced accumulation as the climate again turns colder. However, the climate peak also produces a long-term response in the ice sheet. From around 3 kyr on (Fig. 7), the combined effect of the reduced accumulation and the warm wave that slowly penetrates down into the ice sheet produces an ice volume lower than the initial volume. Not until 10 kyr after the climate peak does the total ice volume return to its initial value (Fig. 6). This demonstrates the slow long-term response time of the ice sheet to this 2 kyr climate change. Long residual effects of 10–20 kyr and more are also seen in the other climatic-change simulations (Fig. 6). The approximately 5°C climate warming that marked the final phase of the last glaciation ended about 10 kyr ago (Reference JouzelJouzel and others, 1993). It is thus possible that the ice sheet in western DML is not yet fully adjusted to the major climate change that ended the last glaciation.
Climate forcing and evolution of total ice volume for the first 8 kyr of the three climate-warming simulations. TNSL denotes annual mean air temperature near sea-level.

The transient behaviour of the temperature at the bed is here briefly described. In the 5°C instant-warming scenario large parts of the bed start to warm about 1 kyr after the abrupt climate change. After 5 kyr the basal temperatures are stabilized at values approximately 5°C warmer than present values, i.e. the bed has experienced the same temperature increase as the climate on the surface. In the large area northeast of Vestfjella with low bed relief and an ice thickness around 300–800 m, the warm-climate signal also reaches the bed about 1kyr after the climate peak in the 10°C warm-peak experiment. Subsequently the bed cools back to present temperatures.
The result that no surface melting occurred during any of the climate experiments most probably reflects the cold climate of the study area. In the model, ablation is calculated from a summation of positive degree days obtained by imposing a seasonal amplitude on the mean annual temperature. In the climate experiments, there were probably not enough positive degree days to generate sufficient surface melting to be seen in the coarse spatial resolution of the model. Today, low air temperatures, also during summer, make the surface melting in this region highly restricted, with limited melting taking place in low-altitude areas close to sea level. The water produced by this melting is not lost from the system, but refreezes within the cold firn and thus is not a loss of mass.
Maximum Palaeo-Ice-Sheet Simulation
Description of the maximum palaeo-ice-sheet experiment
The experiment concerns the configuration, basal temperatures and erosive capability of the ice sheet during a maximum palaeo-ice-sheet distribution and a comparison with the present-day ice-sheet characteristics. Previous studies of this area have shown that large-scale subglacial landforms within Vestfjella and Heimefrontfjella (Reference Holmlund and NäslundHolmlund and Näslund, 1994) and below Amundsenisen (Fig. 1) (Reference NaslundNäslund, 1997) are currently covered by a cold-based and thus essentially non-erosive ice sheet, thereby preserving landforms. In this context it is of interest to study whether cold-based conditions also prevailed in these submerged mountain ranges during late Cenozoic glacial periods when the ice sheet was more extensive than at present. If so, subglacial landforms formed by glacial erosion, such as cirques and glacial valleys, have not been affected by the ice sheet for a long period of time and could not be of late Cenozoic age. If the ice sheet remained cold-based over the mountain ranges during the late Cenozoic, the glacial alpine landforms of these areas were formed and shaped by early wet-based mountain glaciers or early wet-based ice sheets. To study this, a maximum possible ice-sheet distribution was simulated by advancing the grounding line as far as possible, i.e. out to the continental-shelf edge. During stages with a more extensive ice cover, the ice-sheet grounding line need not have advanced all the way out to the continental-shelf edge each time. However, since an ice-sheet configuration with the grounding line at the continental-shelf edge represents the maximum possible extent of the ice sheet during its history, including the late Cenozoic glacial periods, this position is of interest when discussing long-term landscape evolution and the ice-sheet impact on the landscape through glacial erosion.
To make the grounding line advance to obtain a maximum ice-sheet distribution, the calving rate was set to zero, and the annual air temperature was lowered by 5°C, a value comparable with the temperature difference between the Last Glacial Maximum (LGM) and the present conditions as observed in the Vostok ice core (Reference JouzelJouzel and others, 1993). After the grounding line stabilized at the continental-shelf edge, the calving was reintroduced and the model was run to reach equilibrium under the new climate.
Results
The configuration and surface velocity vectors of the ice sheet at the simulated maximum ice-sheet configuration are seen in Figure 8. The grounding line has migrated outwards 70–100 km compared to the present day (Fig. 4). The area of the ice sheet has increased from the present value of 123 000 km2 to 164 000 km2, that is by 33%. The ice volume has increased from 147 000 km3 to 271 000 km3, an increase of 124 000 km3 or 84%. With this maximum ice configuration, Vestfjella, which is situated close to the former grounding line, is completely buried by the ice sheet. The ice thickness over the former Vestfjella nunataks is around 200–500 m. A remnant of Högisen (Fig. 1) is seen as a convex surface feature. In Heimefrontfjella many of the mountain peaks are still protruding through the ice sheet as nunataks (these details are not shown in Figure 8). Figure 9 shows a profile across Vestfjella and Heimefrontfjella including the present-day calibrated ice sheet and the modelled maximum configuration. Here the difference in thickening between Ritscherflya, downstream of Heimefrontfjella, and the high-altitude Amundsenisen, upstream of Heimefrontfjella, is readily seen. The figure is discussed below.
The modelled maximum palaeo-ice-sheet distribution, with the grounding line advanced to the continental-shelf edge. In this reconstruction, parts of Heimefrontfjella still protrude from the ice sheet (not shown) while Vestfjella is completely buried by the ice sheet. The longest vectors correspond to a column average velocity of 500 ma−1.

Bed and ice-sheet surface profile across Vestfjella and Heimefrontfjella for the present ice sheet and the maximum palaeo-ice-sheet configuration. The location of the profile ( a–b ) is seen in Figure 4. The present-day ice sheet is frozen to its bed along the entire profile, except in the deepest part of the Veststraumen trough where the bed is melted. The profile does not run along a flowline.

The basal temperature distribution for the maximum ice configuration is seen in Figure 10. The Heimefrontfjella area still has the lowest basal temperatures within the study area, 20–35°C below pmp. In Vestfjella and at Högisen, basal temperatures are 10–25°C below pmp. The large region with low bed relief northeast of Vestfjella has higher basal temperatures than before, ranging from the pmp to 10°C below pmp. Here, large areas are melted at the bed. Larger areas of basal melting are also present in the Veststraumen trough. Also in Vestfjella, the bed beneath the small Plogbreen ice stream is warmer than at present, with the basal ice at the pmp.
Basal temperature distribution for the maximum ice sheet in Figure 8 undera LGM climate. The cross close to Heimefrontfjella marks the location of an inferred subglacial sediment flood plain previously studied by radar soundings.

Discussion
In the maximum palaeo-ice-sheet simulation, the ice sheet reached a relatively stable new configuration (Fig. 8) after about 10 kyr. The main characteristics of the present-day ice flow (Fig. 4), such as Veststraumen and the flow of ice around Heimefrontfjella, are still present at the maximum ice-sheet configuration (Fig. 8). The ice velocities on the polar plateau are still very low. Ice velocities at Plogbreen in Vestfjella (Fig. 1) have increased significantly compared to the present (Fig. 4). Under present-day conditions this ice stream is hardly recognizable because of the restricted resolution of the grid (Fig. 4). In the maximum ice-sheet configuration, Plogbreen is clearly activated, having higher surface velocities and covering a larger area than at present (Fig. 8). Its activation is due to the warmer basal conditions, with increased basal melting, in the considerably thickened former grounding zone.
Figure 11 shows the difference in ice-sheet surface elevation between the maximum and present ice-sheet configurations. It shows that the largest changes in ice thickness occur in the former grounding zone, with a 600–900 m increase. The largest increase in thickness within the study area, >1000 m, occurs in the lower parts of the present Veststraumen. The ice-sheet surface here was initially at a low elevation, constituting the concave drainage basin of Veststraumen (Fig. 4). In Vestfjella the increase in ice thickness is about 300–800 m. At Ritscherflya the change is in the order of 400–600 m, while around Heimefrontfjella it is generally 0–300 m. The smallest increase in ice thickness, typically <150 m, occurred on Amundsenisen. Some areas here even experienced a lowering of the ice surface due to the reduced accumulation. The small change in ice thickness on the polar plateau is in agreement with results from modelling the entire Antarctic ice sheet (Reference HuybrechtsHuybrechts, 1990).
Difference in surface elevation between the maximum palaeo-ice sheet and the present equilibrated ice sheet, shown with a 150 m contour interval.

Because the simulated major advance in grounding-line position resulted in large changes in ice-sheet thickness downstream of Heimefrontfjella but only minor changes upstream of the mountain range (Figs. 9 and 11), it is seen that the presence of the mountain range attenuates the effect that the change in grounding-line position has on the ice thickness of the polar plateau. This is in agreement with the results of Reference Pattyn, Huybrechts and DecleirPattyn and others (1991), who used a numerical flowband model to study glacial/interglacial changes in ice-sheet configuration in Sør Rondane, eastern DML. The fact that parts of Heimefrontfjella still protrude from the ice sheet at this maximum ice-sheet configuration is a strong indication that this was the case during the LGM. Field data supporting ice-free conditions at nunataks located relatively far from the present grounding line ( >150 km) during the LGM come from dating of snow-petrel nest sites. In Mühlig-Hoffmann-fjella, central DML, nest sites have been radiocarbon-dated to 34 kyr BP (Reference Steele and HillerSteele and Hiller, 1997). Although this radiocarbon date is at the limit of the dating method, it shows that the sample site was either ice-free or covered by cold-based ice during the LGM. This is one of very few absolute datings on events of importance for the long-term glacial history of the area.
Comparison of the present-day basal temperature distribution with that from the maximum ice-sheet configuration reveals that complex changes have taken place. This is seen in Figure 12, which shows the difference in basal temperature between the two configurations. Most of the areas that are ice-covered today have become warmer at the bed in the maximum configuration. This is valid for parts of Vestfjella, most of Ritscherflya and parts of Amundsenisen, where basal temperatures are a few °C to > 10°C warmer than at present. Exceptions occur in a large region around Heimefrontfjella, Högisen (Fig. 1) and a small region near the northeastern corner of the study area, which all have 5–10°C colder basal conditions during the maximum ice-sheet configuration. The area that was covered with ice during the ice-sheet advance, i. e. between the former grounding line and the continental-shelf edge, also has lowered basal temperatures. The cooling of the bed varies between a few °C and slightly more than 10°C (Fig. 12).
Difference in basal temperature between present-day conditions and the maximum ice-sheet configuration.

Basal temperatures increased mainly in areas where the ice thickness increased significantly, such as along the former grounding zone where the temperature increase is up to 10°C. They also increased in areas where the ice thickness was already considerable, such as around Veststraumen and beneath parts of the polar plateau (Fig. 12). Because the ice temperature cannot rise above the pmp, large areas in the lower parts of Veststraumen show no change in basal temperature(Fig. 12). However, the areas with basal melting are larger at the maximum configuration. A notable exception is a small area in the uppermost part of Veststraumen, which shows less basal melting at the maximum configuration, possibly due to a decreased ice flow.
A lowering of the basal temperature occurred in areas which had initially thin ice, such as Heimefrontfjella and at the Högisen. Previously unglaciated areas, outside the former grounding line, were overridden by cold-based ice. In Heimefrontfjella and at Högisen the increase in ice thickness was not enough to compensate for the 5°C colder climate, which resulted in a lowered basal temperature. Southeast of Heimefrontfjella, beneath Amundsenisen, changes in basal temperatures are small (Fig. 12) due to the small change in ice thickness (Fig. 11).
Previous studies of localities around Heimefrontfjella and Vestfjella and beneath Amundsenisen have shown that subglacial landforms at high altitudes within the landscape, such as cirques and glacial valleys, are covered presently by cold-based ice (Reference Holmlund and NäslundHolmlund and Näslund, 1994; Reference NaslundNäslund, 1997). In addition, a subglacial valley with a horizontal valley floor interpreted as a sediment floodplain or valley delta was observed (Reference NaslundNäslund, 1997). The location of this valley is marked by a cross in Figure 10. It was inferred that the glacial landforms must have originated from an earlier glacial period with a climate that supported wet-based erosive glaciation. Reference Holmlund and NäslundHolmlund and Näslund (1994) observed that the orientation of the cirques was governed by local topography and therefore suggested a formation by local mountainous glaciers. Figure 5 shows that not only the previously studied individual localities, but the entire Heimefrontfjella range and most of Vestfjella are presently covered by cold-based ice. This supports the idea that the glacial landforms within the mountain ranges are old. Due to the complex interactions between climate, ice-sheet dynamics and ice temperatures, Reference Holmlund and NäslundHolmlund and Näslund (1994) and Reference NaslundNäslund (1997) could not quantify changes in the basal temperature distribution during earlier periods with a more extensive ice coverage. In this context, the modelled maximum ice-sheet configuration (Fig. 8) constitutes an extreme end-point in contrast to present conditions. Previous ice-sheet configurations with more extensive ice coverage than the present, such as during the LGM, must have been within the limits of the present-day ice coverage and that of the modelled maximum configuration.
The modelling results show that Heimefrontfjella and most of Vestfjella are covered by cold-based ice during the maximum ice-sheet configuration (Fig. 10). In Heimefrontfjella and at Högisen, basal temperatures are even colder during the maximum configuration due to the colder climate (Fig. 12). Even with the uncertainties introduced by some of the simplistic assumptions in the model, the continuous cold-based conditions within these high-altitude regions are indisputable. Wet-based conditions and glacier erosion do not occur within the high-altitude mountains today, nor have they likely occurred during colder stages with a more extensive ice coverage in the past, such as during the Quaternary glacial periods. This conclusion is supported by the results of Reference Steele and HillerSteele and Hiller (1997), which indicate that wet-based conditions did not affect these mountains during the Last Glacial Maximum. The results of the modelling thus support the idea that large-scale glacial landforms within the studied mountain ranges were formed by glacial erosion that occurred prior to the formation of the mainly cold-based late Genozoic Antarctic ice sheet (Reference Holmlund and NäslundHolmlund and Näslund, 1994; Reference NaslundNäslund, 1997, Reference Naslund1998). Due to similar geographical, glaciological and climatological conditions, the same may also be true of the other coastal mountain ranges in DML.
In the area with the inferred sediment-filled valley beneath Amundsenisen (Reference NaslundNäslund, 1997), the maximum ice configuration yields basal temperatures similar to or slightly lower than present values (Figs. 10 and 12). This is in line with the discussion in Reference NaslundNäslund (1997), where it is argued, on the basis of the morphology and preservation of the presumed sediment deposit, that no prolonged periods of basal melting have occurred at this locality during the ice-sheet history. The cold-based conditions in these areas under the different modelled ice-sheet configurations point to the great antiquity of the alpine landscape of DML, and also to the possibility of delicate sediment deposits having been preserved under cold-based ice coverage for long periods of time.
The modelling results further show that the landscapes situated at intermediate elevations, such as the low-relief area northeast of Vestfjella, may have experienced alternating phases of cold- and warm-based ice coverage. Low areas of the landscape are today wet-based (Fig. 5). During the more extensive ice-sheet coverage these low, wet-based regions persisted, and some intermediate-altitude areas also turned wet-based. This resulted in a greater total wet-based area for the palaeo-ice-sheet simulation than for the present ice sheet. This suggests that former larger ice sheets, under moderate climate cooling, may have had a greater impact on the subglacial landscape trough erosion than the present-day ice sheet. However, this is valid only for the region as a whole, and not for the high-altitude mountain ranges which seem to have been continuously covered by cold-based protective ice. Regarding fast-flowing ice streams like Veststraumen, it is possible that they have produced wet-based conditions in the deep troughs within the coastal regions of DML from the onset of ice-sheet glaciation up to the present day. These low-lying regions of the landscape are still today being reshaped by glacial activity. The results show the importance of bed topography and ice velocity for the basal temperature distribution of ice sheets, and thus also their impact on the subglacial landscape.
Conclusions
A new 10 km by 10 km resolution dataset on ice-sheet bed and surface topography for western DML was used as input to a time-dependent ice-sheet model. The results show that the studied part of the East Antarctic ice sheet has a robust behaviour relative to the simulated climate changes, including an experiment simulating the inferred global warming. The ice volume of the grounded part of the ice sheet changed 22.5% during simulations of 5°C climatic warming and cooling, and 3–4% for 10°C warming- and cooling-peak experiments. These results are from an ice-sheet model without an ice shelf. If the ice shelf were included it is possible that the ice-volume change would be larger, especially for the 10°C climate-warming scenario. The ice-sheet response to climate changes can be explained as having two components. First, there is the immediate response when the ice-sheet volume changes due to changes in accumulation rate. Second, there is a delayed response that occurs after about 1 kyr when the climate signal reaches the bed of the ice sheet, thereby affecting the ice flow and thus the ice volume. The latter process, which acts in the opposite sense from the first, has a response time on the order of 10–20 kyr or more. The long response times suggest that the investigated ice sheet may not yet be fully adjusted to the climate change that ended the LGM. A robust behaviour of the ice sheet was also observed for two 10°C climate-warming-and-cooling-peak experiments. The ice sheet was able to re-establish its present configuration after the climate changed back to present-day values.
The modelling results show that large parts of the landscape at high and intermediate altitudes are presently covered by cold-based ice. The lowest basal temperatures, as low as 30°C below pmp, occur in Heimefrontfjella. Relatively low basal temperatures are also indicated at Högisen. Beneath Amundsenisen, basal temperatures are around 10°C below pmp. In the lowest part of the landscape, i.e. in the deep trough of Veststraumen, the ice-sheet bed is melted. A few other minor areas of basal melting are indicated, for example in the trough occupied by the small Plogbreen ice stream in Vestfjella. This illustrates the importance of bed topography and ice velocity for the basal temperature distribution, in turn determining the potential for landscape modification.
A reconstruction of a maximum palaeo-ice distribution, with a climate comparable with that during the LGM, indicated large changes in ice thickness downstream of Heimefrontfjella at Ritscherflya, and especially along the former grounding line, but yielded only insignificant changes in ice thickness on the polar plateau. The results strongly suggest that nunataks were present along Heimefrontfjella during the LGM. At the maximum ice configuration, low- to intermediate-altitude areas of the subglacial landscape experienced an increase in basal temperature of up to 10°C, unless the bed was already melted. In general, the areas of basal melting increased in size.
The parts of the landscape that were glaciated during the ice-sheet advance became covered by cold-based ice. High-altitude regions, such as Heimefrontfjella, Högisen and Vestfjella, which all clearly were initially cold-based, cooled by 5–10°C during the maximum ice configuration. This suggests that cold-based conditions prevailed within the mountain ranges during the late Cenozoic glacial periods when the ice sheet was more extensive. The result of the modelling supports the hypothesis that the alpine landscape commonly found within the coastal mountain ranges of DML was formed by glacial erosion by wet-based local mountain glaciers or early wet-based ice sheets before the present, mainly cold-based, ice sheet came into existence.
Acknowledgements
The study was financed by the Swedish Natural Science Foundation (NFR) and Stockholm University. Improvements to the manuscript were made after comments by P. Jansson, S. Jonsson, B. Lundén, C. Richardson, S. Simpson, R. Greve and two anonymous referees. The authors are grateful for the kind assistance of these persons.


